Category Aircraft Flight

Direct lift control

The traditional control surfaces only directly produce turning moments. Thus, the conventional elevator control produces a pitching moment, which alters the pitch attitude, and hence angle of attack. This action only indirectly produces the desired effect of increasing the lift. However, by deflecting some form of flap or flaperon, while simultaneously deflecting the elevators downwards, it is possible to increase the overall lift, directly, without changing the aircraft’s pitch attitude. If the centre of gravity lies behind the wing centre of lift, as illus­trated in Fig. 10.16, then both wing and tail can contribute positive increases in lift whilst still keeping the moments in balance. Placing the centre of gravity aft, however, produces low natural stability unless a canard layout is used. To maintain stability and synchronise the controls it is almost essential to use an automatic system.

Such direct lift control is useful in combat manoeuvres. Very effective use of direct lift control has been demonstrated by the British Aerospace Harrier (Fig. 7.12). The Harrier however, uses the thrust vectoring capability of the engines rather than control surfaces. Direct lift control causes the aircraft to jump suddenly upwards, or downwards, an unorthodox manoeuvre that was found to be particularly useful for dodging missiles, and in aerial dog-fights. The Harrier was also the first production aircraft, other than a helicopter, to be able to fly both sideways and backwards.

Active control of individually adjustable surfaces can also be used to reduce structural loading, as described in Chapter 14.

Wing lift

Fig. 10.16 Direct lift control

By deflecting a flap or similar wing surface whilst simultaneously adjusting the tail lift by altering the tail incidence or camber, the overall lift can be increased directly, with no change in pitch angle. If the centre of gravity lies aft of the wing centre of lift, then both surfaces will generate a positive increase in lift. This however tends to reduce the natural stability of the aircraft

Effect of altitude on short period pitching oscillation

The damping of the SPPO depends largely on the pitching moment produced by the tail surfaces as a result of the rate of change of pitch angle. Therefore it will be altered by changes in the tailplane effectiveness for a given amplitude of the motion. If the aircraft is flying at high altitude, the density is reduced. Thus, for a given aircraft attitude, and hence lift coefficient, the speed of flight will have to be higher to maintain the required lift from the wings. Thus a given rate of pitch will result in a smaller angle of attack as far as the tailplane is concerned, and its effectiveness will be reduced (Fig. 12.5).

Fig. 12.5 Effect of altitude on damping

As altitude increases a larger air speed is required. A given angular velocity results in a smaller inclination of the relative air stream and a smaller change in tail lift (a) Low speed (b) High speed

This is not the only problem associated with altitude. Many aircraft in high altitude cruise will be flying transonically. This condition encourages move­ment of the shock system on the top surface of the wing in response to small changes in aircraft attitude. This leads to a further deterioration in stability.

Stagnation

Another feature of the flow is that the air following the dividing stream­line slows down as it approaches the wing, and if the wing is not swept it actually stops instantaneously on the surface before dividing. Because the par­ticles are momentarily ‘stagnant’ at this position, it is known as a stagnation position.

It should be remembered, that in Fig. 1.13, we are looking at a two­dimensional section. If we take a three-dimensional view, as in Fig. 1.14, then we need to consider imaginary stream-surfaces. It will be seen, that the divid­ing stream surface meets the wing section along a line just under the leading edge. The stagnation position, seen as a point in the two-dimensional section, is just an end-on view of this stagnation line.

If the wing is swept, then only the component of flow at right angles to the wing leading edge is stopped, and the line of contact is called a dividing attach­ment line.

Stagnation

Fig. 1.14 Stream surfaces

In a three-dimensional view, the flow can be represented by stream surfaces

Stagnation

Fig. 1.15 Pressure distribution around an aerofoil

Flow separation and stalling

In Chapter 1 we described how, at high angles of attack, the air flow separates, and fails to follow the contours of an aerofoil, resulting in stalling. To see how this happens, and why it is connected with the boundary layer, we need to look again at how the pressure varies around a wing section.

Figure 3.3(a) shows a typical low speed wing section under normal flight conditions. The pressure reaches its minimum value at a point A, somewhere around the position of maximum thickness on the upper surface. After this, the pressure gradually rises again, until it returns to a value close to the original free-stream pressure, at the trailing edge at B.

This means, that over the rear part of the upper surface, the air has to travel from low to high pressure. The air can do this by slowing down and giving up some of the extra kinetic energy that it possessed at A, according to the Bernoulli relationship p + pV2 is constant. The situation can be likened to that of a cyclist who can free-wheel up a hill, as long as he is going fast enough at the bottom.

Close to the surface, in the boundary layer, however, some of the available energy is dissipated in friction, and the air can no longer return to its original free-stream conditions at B, just as a cyclist would not be able to free-wheel up a hill quite as high as the one that he had just coasted down.

If the increase in pressure is gradual, then the process of turbulent mixing or molecular impacts allows the outer layers to effectively pull the inner ones along. The boundary layer merely thickens, leaving a slow-moving wake at the trailing edge, as in Fig. 3.3(a).

If the rate of increase in pressure is rapid, the mixing process is too slow to keep the lower part of the layer moving, and a dead-water region starts to form. The boundary layer flow stops following the direction of the surface, and separates, as shown in Fig. 3.3(b). Air particles in the dead-water region tend to move towards the lower pressure, in the reverse direction to the main flow. This mechanism is the primary cause of stalling. As the aerofoil angle of attack is increased, the pressure difference between A and B increases, and the separa­tion position moves forward, as in Fig. 3.3(c). (See also, Fig. 1.19.)

Flow separation and stalling

(c)

The process of mixing in the turbulent boundary layer is much more rapid than the process of molecular mixing and impacts in the laminar layer, so a tur­bulent boundary layer is less prone to separation than a laminar one of similar thickness. This represents the other important difference between the two types of layer. You will see, therefore, that the type of layer affects the stalling char­acteristics of the aerofoil.

Negative drag

In Chapter 2 we described how upwash can occur at the tips of swept wings. When this happens, the resultant force vector is tilted forwards, so that negative drag, or thrust is generated. It is also possible to create a negative contribution

Negative drag

Fig. 4.20 Creative Canard: the Vari-Eze designed by Burt Rutan

Design features include wing-tip winglets doubling as fins, composite materials, and a nose wheel that can be retracted in flight, and for ground parking, as shown. Amateur pilots would probably get away with forgetting to lower the undercarriage; a common error

A maximum cruising speed of nearly 200 mph, with a stall speed of 55 mph, despite a mere 6.77 m span, make this an attractive alternative to conventional designs

to drag by bending the leading edge downwards. A low pressure is produced on the top of this drooped surface either by attached or vortex flow, and as it is facing forward, a negative contribution to drag results. The droop of the leading-edge needs to be matched to the flight conditions, and so, a mov­able leading-edge flap is required. The leading-edge flaps on the Eurofighter Typhoon shown in Figs 8.3 and 10.8 may be used for drag reduction as well as high lift production.

Clearly, it is not possible to pull oneself along by one’s bootstraps, and such a negative drag contribution can do no more than reduce the overall drag.

In supersonic aircraft, it would be possible to produce genuine overall negat­ive drag or thrust by burning fuel to heat up and raise the pressure in the wake. However, there would be considerable practical problems in implementing such a system.

Negative drag
Подпись: (profile drag)
Подпись: 200
Подпись: 100
Подпись: 100
Подпись: Trailing vortex
Подпись: Boundary layer

Negative dragSpeed (m/s)

Fig. 4.21 The variation of drag with speed for a typical light aircraft

Note how the trailing vortex drag reduces with increasing speed while the boundary layer drag rises. The resulting total drag therefore has a minimum. Flying slower than the minimum-drag speed would require an increase in thrust

The low speed ducted fan or propulsor

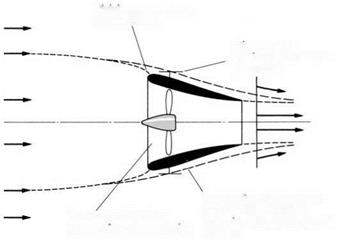
The alternative flow pattern shown in Fig. 6.10 and 6.13 is obtained when the thrust is high in relation to the free-stream speed. It therefore occurs when any turbo-fan aircraft is taking off. As the aircraft speed increases, the flow pattern gradually changes to that shown in Fig. 6.12.

In Fig. 6.13, we have superimposed the surrounding stream-tube shape for a propeller producing the same thrust. It will be seen that when operated at low speed, the ducted fan is equivalent to a propeller of larger diameter. The propulsive efficiency of the ducted fan should thus be higher than for an unducted propeller of the same diameter.

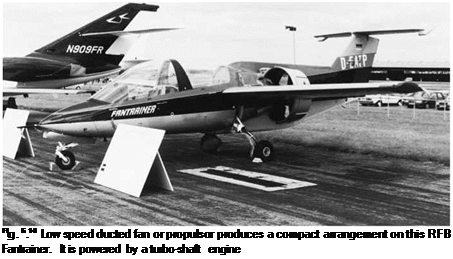
In the situation illustrated in Fig. 6.13 the flow speeds up as it approaches the fan, and the pressure at inlet is thus lower than the free-stream value. This is not a disadvantage in low speed flight, where there are no problems due to compressibility effects. An example of a ducted fan installation may be seen on the Fantrainer shown in Fig. 6.14. The Optica, shown in Fig. 4.9, is another example.

The low speed ducted fan or propulsor
Подпись: Surrounding stream-tube

The low speed ducted fan or propulsorFig. 6.13 Ducted fan at low speed

Подпись: Fig. 6.14 Low speed ducted fan or propulsor produces a compact arrangement on this RFB Fantrainer. It is powered by a turbo-shaft engine

The surrounding stream-tube for a propeller producing the same amount of thrust is also shown. It will be seen that the ducted fan is equivalent to a propeller of larger diameter

Apart from increasing the effective diameter, the ducted fan can reduce noise, and also provide a means of containment, if one of the blades should come off; an important feature for the propulsion of airships.

Because the fan diameter is smaller than the equivalent propeller, it can be run at a higher rotational speed, which is an advantage when the drive is taken directly from the engine shaft.

To prevent flow separation, the propulsor duct intake needs to be shaped quite differently from the high speed type, as may be seen from comparison of Figs 6.12 and 6.13. The propulsor duct is rather like an annular aerofoil, and sustains a circulation. Leading-edge suction provides part of the overall thrust. The power required to produce that thrust still ultimately comes from the engine, of course.

The disadvantage of the propulsor is that it adds to the weight, cost and the complexity of the aircraft. The duct also produces some extra surface friction drag, and the overall increase in efficiency may be small.

Other types of powerplant

So far we have restricted discussion to two of the most common types of power – plant in order to illustrate the way in which conditions for best economy

change according to the type of powerplant which we decide to employ. We must not forget, however, that other types of powerplant are used, and these alternatives are mentioned in Chapter 6.

Of these alternatives perhaps the most common is the turbo-prop. This tends to be something of a ‘half-way house’ between the piston engine and the turbo-jet. The basic efficiency of the gas turbine will rise with increasing speed, but the propeller efficiency will deteriorate as the speed increases because of the effects of compressibility. The use of the more advanced type of propeller and the unducted fan mentioned in Chapter 6 promises to overcome some of these problems and extend the speed range over which such a powerplant can be used.

At higher speeds other forms of propulsion such as the ramjet or turbo-rocket may start to look attractive, particularly if we take a more comprehensive view of the economics of an aircraft than the simple measure of the fuel required to accomplish a particular journey for a given payload.

More about the tip flow

Problems with the tip region are not confined to the difficulties with boundary layer and local load distribution discussed above. The problem is compounded by an effective loss of sweep in this region. This can be seen by plotting isobars on the wing surface. Isobars are familiar to most people because they are in general use on weather maps. They are obtained by drawing lines through points on the wing surface having the same pressure thus providing a sort of ‘contour map’ of the distribution. Figure 9.16(a) shows how the isobars become less swept in the tip region which reduces the effectiveness of the geometric sweep angle.

This effect may be offset by using a thinner section in this region. Fortun­ately, from the structural point of view, the outboard sections of the wing are

(a)

Fig. 9.16 Isobars (lines of constant pressure) on a swept wing

To produce patterns such as those in (b) and (c) requires a considerable amount of twist and camber variation along the wing (a) Normal uncorrected isobars (b) Ideal pattern (c) Alternative pattern

Fig. 9.17 Planforms giving a constant spanwise sectional lift coefficient

(a) Planform giving a constant spanwise sectional lift coefficient

(b) Planform with straight trailing edge

the easiest to deal with in this way, since the bending moment is lower. The loading in the tip region can also be improved and made less ‘peaky’ by the use of local changes of camber and twist, but these modifications can also only be ‘tuned’ to a single design angle of attack. A further method, which will work throughout the range of angle of attack, is to modify the planform (Fig. 9.17). The particular form of taper shown in Fig. 9.17(a), while it produces the right result from the point of view of the ‘pure’ aerodynamic requirement, has clear drawbacks when the need to fit control surfaces or high lift devices is taken into account. In this case a straight trailing edge is an obvious advantage, and the planform of Fig. 9.17(b) results. Even so it may still not be completely possible to obtain quite the desired planform. Structural design must be considered and it may become necessary to demand a straight leading as well as trailing edge in order to fit a leading-edge slat over a sufficient span.

The control of helicopters

At first sight, helicopter controls appear similar to those of a fixed-wing air­craft. A control stick or handlebar grip provides roll and pitch control via the cyclic pitch control mechanism mentioned in Chapter 1, and foot pedals con­trol the yaw, usually by controlling the tail rotor thrust. The main difference lies in the addition of a collective pitch control lever which can be used to make the helicopter go up or down. This lever is usually located beside the pilot’s seat and resembles a car handbrake lever both in appearance and position. Pulling the lever up causes the helicopter to rise.

Controlling a helicopter is initially much more difficult than flying a fixed – wing aircraft, as the helicopter responds quite differently, and may appear to be quite unstable. Very few student pilots can hold a small simple helicopter in a controlled hover for more than a few seconds on their first attempt. Like rid­ing a bicycle though, it seems relatively easy once the skill has been acquired.

Recommended further reading

Davies, D. P., Handling the big jets, 3rd edn, CAA, London, 1971.

Middleton, D. H., Avionic systems, Longman, Harlow, 1989.

Wilkinson, R., Aircraft structures and systems, 2nd edn, Mechaero Publishing, St. Albans, UK, 2001, ISBN 095407341X. A good easily read introductory text with a non-mathematical approach.

Some aspects of safety at take-off – decision speeds

As was mentioned above, take-off is a potentially hazardous operation and consequently steps must be taken to make the risk of accident acceptably low. The first thing to note in this regard is that all machines fail at some time or other and aero engines are no exception to this rule. During the take-off the

Fig. 13.2 Take-off

An F-18 in take-off configuration with flaps and leading-edge devices partially deployed

engines are working particularly hard and it is necessary to analyse the effect of likely failure at all stages in the take-off procedure and to ensure that enough runway is available to abort the take-off should this be necessary.

Multiple engined aircraft have the obvious advantage that it is possible to design so that failure of one engine can be tolerated and the take-off continued on the remaining engine or engines. This advantage is not gained without some complication, however. If an outboard engine were to fail then, because the other engines are operating near full thrust, a large yawing moment is produced which must be counteracted by the fin and rudder of the aircraft (Fig. 13.3). The low speed rudder authority required can lead to some quite large fin and rudder assemblies (Fig. 13.4).

Frequently this yawing moment is the factor which decides on the size of the fin and rudder for an aircraft, rather than any consideration of normal flight and manoeuvre. Another problem which may arise is due to the fact that the rudder authority depends on the air speed. Unless the speed is high enough then the rudder authoriy will not be great enough to cope with the ‘engine out’ case and the aircraft must not be ‘rotated’ for take-off until sufficient authority is

Fig. 13.3 Engine failure during take-off

Fin and rudder must be able to counteract yaw due to asymmetrical engine thrust

Fig. 13.4 Twin-engined aircraft designed for a low landing speed may require a very large fin to cope with the yawing moments produce on failure of one engine as on this D. H. Canada Dash-8

available. It may be this factor, rather than the aircraft stalling speed, which limits the take-off speed in a particular case.

During the take-off the pilot has to be aware of all factors such as the above, which may have safety implications. He will need to know exactly at which point along the runway that the ‘point of no return’ occurs where there will be insufficient remaining runway length to abort the take-off and bring the
aircraft to rest, as well as being aware of the point at which sufficient rudder control authority will be available to cope with the worst engine failure case envisaged for the type of aircraft.

A further complicating factor is that neither of these conditions depends solely on the type of aircraft and the length of runway from which it is operat­ing. The aircraft take-off weight may vary between wide limits and the local weather will also affect the calculations. In general if the airfield is at high altitude, the air density will be reduced which will reduce the aerodynamic forces on the aircraft at a given speed. High ambient temperature will also reduce engine performance and change the calculations yet again. Head or tail winds will also alter the pilot’s calculations.

Thus critical conditions during the take-off have to be carefully evaluated before each flight, bearing such local factors in mind. Pilots therefore have a large amount of ‘homework’ to do before taking to the air!

Clearly the pilot’s workload during the take-off is high and a relatively straightforward method must be used to ensure that the safety requirements are met. Thus for a multi-engined aircraft a ‘decision’ speed, V1, is worked out for the particular take-off conditions. If an engine fails, or other failure occurs before this speed is reached then the pilot knows that it is possible to bring the aircraft safely to rest in the remaining runway length. If the speed is higher than V1 when the failure occurs it will be better to continue with the take-off and land later.

The important points in the take-off of a typical jet aircraft are shown in Fig. 13.5. Following the decision speed, V1, the aircraft continues to accelerate until the ‘rotation’ speed, VR, is reached at which point the nose is lifted. The aircraft takes off and starts the initial climb out at the safe take-off speed V2. As we have seen above, this speed may be determined by a number of factors. Which particular factor determines the rotation speed depends on the aircraft design and the circumstances of its operation. Firstly it may be determined simply by the requirment to have an adequate safety margin above the stalling speed. Secondly the speed may have to be somewhat above this value because, for example, the angle of incidence obtainable on the ground may be limited by tail clearance to a value well below the stalling incidence. Finally the speed may be dictated by the rudder control requirement which accompanies engine failure.

35 ft

V3

Climb

Fig. 13.5 Take-off speeds

Critical points of the take-off are defined by speeds which are easily monitored by the pilot

The take-off manoeuvre is regarded as complete when the aircraft passes over the ‘screen’ height of 35 ft for a jet transport. The speed at this point is known as V3. After the screen height has been reached, the pilot has to comply with noise requirements in the subsequent climb-out. The aircraft must also be designed to climb safely and return for landing following engine failure.

The relatively high take-off speed for jet aircraft might make the operation appear more dangerous than for a piston-engined type, but the probability of engine failure is much lower for the jet than for a piston engine working at its maximum rating.