Category Basics of Aero – thermodynamics

Problems of Chapter 4

Problem 4.1

The residence time is tres = 3.33-10-5 s and the measurement time tmeas = tref « 1.67-10-4 s.

Problem 4.2

pSuth = 2.67-10-5 kg/ms, р1 = 3.51-10-5 kg/ms, p2 = 2.64-10-5 kg/ms.

Дрі = (p1 — (ASuth)/^Suth = 0.31, Др2 = (м2 — I^Suth)/^Suth = —0.01.

Problem 4.3

kHan = 0.036 W/mK, k1 = 0.048 W/mK, k2 = 0.037 W/mK. Дк1 =

(k1 kHan)/kHan 0.33, Дк2 (k2 kHan)/kHan 0.03. kEucken °.°37

W/mK. ДкHan (kHan kEucken)/kEucken 0.027.

Problem 4.4

Cp = 1,032.71 m2 /s2, K, у = 1.385, PrHan = 0.7576, PrEucken = 0.7421, Preq. (4.19) = 0.7418.

Problem 4.5

On page 99 it was mentioned, that in that case fluid mechanics and thermo­dynamics are decoupled. With zero Mach number the Eckert number E is zero, too. The compression work and the dissipation work terms disappear from the energy equation.

However, because the velocity v is non-zero, the speed of sound a = J~fRT must be very large if M = 0:

v v

M = — : а м-гО = yrj———— t °°-

a M |^o

Assuming that the gas properties are unchanged, this means that the tem­perature is infinitely high. Obviously fluid mechanics and thermodynamics are decoupled.

Problems of Chapter 3

Problem 3.1

Подпись: CpTt Problems of Chapter 3

Solution: For perfect gas it holds h = cpT. The speed of sound is a2 = yRT. These relations are introduced into eq. (3.2):

With

Подпись:‘У R Cp Cp cv

cp cv cp

Подпись: and Ыжv0/aсо the result is

Tt = Co(l + ^Ml).

Problem 3.2

From Table 4.4 we find Pr = 0.7458. The recovery factors then are riam = /Pr = 0.8636, and rtUrb = /Pr = 0.9069.

At H = 30 km the free-stream temperature is То = 226.509 K, Table 2.1. The the specific gas constant of air is R = 287.06 m2/s2K, Table B.1.

With that the speed of sound is a0 = 301.712 m/s and the flight Mach number Ыо = 3.314.

The results are Tt = 724.16 K, Trlam = 656.18 K, Trturb = 677.72 K. Problem 3.3

Simplify eq. (3.25) to the proportionality Tra = c(x/L)-n/4 = c(x/L)-0-125. Measure in Fig. 3.3 the temperature at x/L = 0.1: Tw « 1,100 K and find the constant c = 824.88 K.

Measure the temperature at a) x/L = 0.3: Tw « 994 K and b) x/L = 0.75: Tw « 880 K, and compare with the temperatures from the proportionality at these locations: a) Tw « 958 K, b) Tw « 855 K.

How do you rate the result? The temperature follows approximately the behavior (x/L)-n/4.

Problem 3.4

Simplify eq. (3.25) to the proportionality Tra = c(x/L)-n/4’6 = c(x/L)-0 0435. Measure in Fig. 3.3 the temperature at x/L = 0.1: Tw « 874 K and find the constant c « 790 K.

Measure in Fig. 3.3 the temperature at x/L = 0.75: Tw « 820 K and compare with the temperature from the proportionality at that location: Tw = 800 K. How do you rate the result? The temperature follows approximately the behavior (x/L)-n/4 6.

Problem 3.5

At H = 60.56 km the Mach number is Ыж = 15.7. The free-stream temper­ature is T^ « 247 K. At x/L = 0.5 the (radiation-cooled) wall temperature is Tw « 916 K.

Assume that the Reynolds number remains unchanged and that this holds also for the ratio of specific heats and the recovery factor. Assume further Tra ^ Tr and simplify eq. (3.25) to Tra ж Tr0’25. Choose Yeff = 1.3 and Pr =1 and find Tra, M^=!7/Tra, M^=i5.7 = 1.0396. Hence Tw « 952.2 K compared to originally Tw « 916 K. With the higher flight Mach number the wall temperature is larger.

Problem 3.6

Proceed like in Problem 3.5 and find Tra, M^=i4/Tra, M^=i5.7 = 0.946. Hence Tw = 866.4 K. With the lower flight Mach number the wall temperature is smaller.

Problem 3.7

Problems of Chapter 3 Подпись: Mi Mo Подпись: 0.5

From the scaling law eq. (3.34) the proportionality

is obtained.

Подпись: 1.040 andThe ratios are Tra, Mx, = 17/Tra, Mx,= 15.7

Tra, M^=i4/Tra, M^=i5.7 = 0.944. The agreement is good.

Problem 3.8

Problems of Chapter 3 Подпись: Tra)

The Reynolds number increases with decreasing altitude. Simplify eq. (3.25) to

and find

Подпись:rp4-(2n-1) T ra

(Reref, l)1 71

It follows for both laminar (n = 0.5) and turbulent (n = 0.2) flow

Reref, L ^ ж : Tra ^ Tr,

i. e., the radiation-adiabatic temperature approaches with increasing Reynolds number the recovery temperature: radiation cooling becomes ineffective. See in this regard also Fig. 3.4.

Solution Guide and Solutions of the Problems

Problems of Chapter 2

Problem 2.1

The nominal density at 70 km altitude is рж = pnom = 8.283-10-5 kg/m3, Table 2.1. The actual density is pactuai = 7.4Б47-10-5 kg/m3.

Assume that the RV can be approximated by a flat plate and determine the drag with the help of Newton’s theory, Section 6.7:

CD = 2 sin3 a.

This relation yields

CDnom = 0.707.

Because the actual drag is to be the nominal one, we have pnomCDnom = pactUaiCDcorr. We obtain from this CDcorr = 0.78Б.

Make a Taylor expansion around the actual drag coefficient and keep the linear term only:

Solution Guide and Solutions of the Problems

+ O(Aa2)).


From that equation the correction angle Aa is found to be

Подпись: Aa = (CDcorr - CDnom )/, dCD m

da

With

dCD


Solution Guide and Solutions of the Problems

2.1213 rad-1,


da


Solution Guide and Solutions of the Problems

the correction angle is Aa = 0.037 rad, respectively Aa = 2.12°.

With the corrected angle acorr = 47.12° the value CDcorr = 0.787 is obtained.

(C Springer International Publishing Switzerland 2015 E. H. Hirschel, Basics of Aerothermodynamics,

DOI: 10.1007/978-3-319-14373-6 _11

Problem 2.2

Remember the mass fractions of the undisturbed air and find eventually with eq. (2.6): a) pn2 = 912.98 Pa, po2 = 284.05 Pa, b) pn2 = 0.803 Pa, po2 = 0.250 Pa.

Problem 2.3

Determine the density in the test section, take the simple approximation for the viscosity of air, Section 4.2, p = 0.702-10-7 T, find A facility = 0.00003 m, and Dfacility = 0.0001 m.

Generic Scramjet Inlet: The Shock-on-Lip Situation

Shock wave/boundary-layer interaction at a generic two-ramp inlet config­uration with different wall temperatures was studied experimentally by T. Neuenhahn with the TH2 shock tunnel of the Shock Wave Laboratory of the RWTH Aachen University, Germany [12]. We discuss here only the matter of the ramp-shock position with respect to the inlet cowl leading edge as func­tion of the wall temperature. The shock-on-lip condition is a layout objective for CAV’s and ARV’s, see, e. g., [1].

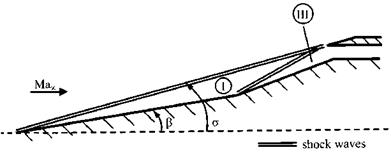
The geometry of the two-ramp inlet model with internal electrical resis­tance heating is shown in Fig. 10.9 together with the oblique shock waves of the inviscid flow. The inlet has a sharp leading edge in order to avoid entropy layer influences.

Generic Scramjet Inlet: The Shock-on-Lip Situation

Fig. 10.9. Schematic of the sharp-edged two-ramp inlet with the oblique ramp shock waves [12]. The angle of the first ramp is ві = в = 9°, that of the second ramp в2 = 20.5°, the angel of the first oblique shock wave is a = a(Mві).

The flow parameters of interest for us are given in Table 10.8. Of the two test conditions used in the experimental study, only condition I is relevant.

Table 10.8. Test conditions of the two-ramp inlet flow [12].

Test condition

Moo

Re’L [1/m]

Too [K]

Boundary-layer state

I

7.7

3.5-106

100

laminar

II

7.6

4.5-Ю6

210

laminar

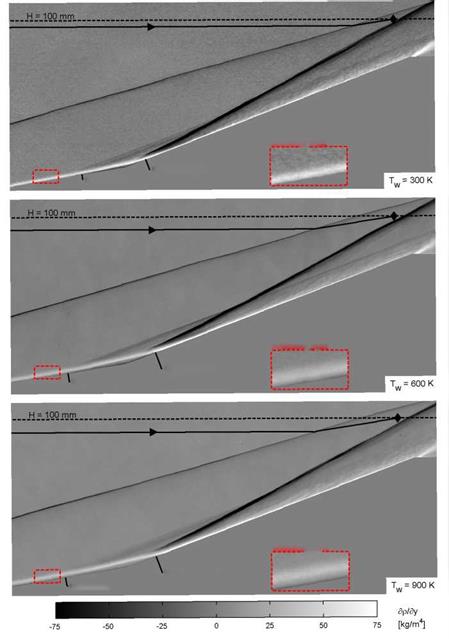
Schlieren pictures of the inlet flow for the wall temperatures Tw = 300 K, 600 K, and 900 K are given in Fig. 10.10.

Generic Scramjet Inlet: The Shock-on-Lip Situation

ф Leading edge of the cowl


Boundary layer


Reattachment


Separation


Boundary layer


Reattachment


Separation


Boundary, Layer


Reattachment


Separation


Fig. 10.10. Schlieren pictures of the two-ramp inlet flow for three different wall temperatures [12].


Generic Scramjet Inlet: The Shock-on-Lip Situation

The broken lines and the diamonds in the upper right corners of each of the pictures indicate the location of the leading edge of the assumed cowl lip (H = 100 mm). It represents the inviscid design point in which the two ramp shocks are directed on the lip. This shock-on-lip situation leads to the highest mass flow into the propulsion system.

The three schlieren images give important information regarding viscous effects as such and also regarding viscous thermal surface effects. Take the Tw = 300 K case. The boundary layer on the first ramp due to its displacement thickness shifts the oblique shock wave upwards compared to the inviscid layout situation. The result is that a lower mass flow enters the inlet. This is indicated by the streamline which impinges on the diamond after it has been deflected by the oblique shock wave. The mass flow hence is 2.6 per cent smaller than the inviscid layout mass flow. This mass-flow defect is called the spillage flow.

If the wall temperature is enlarged, the displacement effect of the bound­ary layer on the first ramp is enlarged, and the now slightly steeper shock wave is further shifted upwards.[176] The spillage flow increases. For the highest wall temperature Tw = 900 K it finally reaches 5.2 per cent.

These results tell us the importance to take into account in inlet design both viscous effects and thermal surface effects. In the reality of course the flow situation is much more complex as in this generic inlet case. In design work the understanding of the effects as well as the limitations of both ground – facility simulation and computational simulation is mandatory.

10.2 Problems

Problem 10.1. Derive the proportionalities to the reference temperature of the flat-plate thicknesses of compressible laminar and turbulent two­dimensional boundary layers as well as that of the viscous sub-layer. Employ the relations for the Blasius and the 1-th-power turbulent boundary layer. Assume ш = 0.65. Compare with the values given in Table 10.1.

Problem 10.2. Write for eq. (10.1) the proportionalities to T*/Te for both laminar and turbulent flow.

Problem 10.3. Compute the ratio of the two boundary-layer thicknesses STw =воок/$тт=ілоок of the case in Section 10.4. Measure the thicknesses in Fig. 10.1 and compare.

Problem 10.4. From Fig. 10.4 in Section 10.7 the skin-friction coefficients for case a) and case b) were read to be cf, a « 0.005-0.0025, and cf, b ~ 0.003-0.0015. Find the reference-temperature values and compare.

Flat Plate/Ramp: Length of the Separation Zone

We have seen in the previous section that the thermal state of the surface, in particular the surface temperature, leads to a reduction of the skin friction, but to an increase of the size of the strong-interaction zone around the hinge line of a deflected wing flap.

The deflected flap constitutes a supersonic compression ramp, idealized as a flat plate/ramp configuration. The strong interaction around the hinge line is an Edney type VI interaction, Fig. 9.6 c) in Sub-section 9.2.1. We discuss results of experimental and numerical investigations of the influence of the surface temperature on such a M= 7.7 flow. The experimental investigation was made in the shock tunnel TH2 of the Shock Wave Laboratory of the RWTH Aachen University, Germany. The model is a flat plate/ramp model with internal electrical resistance heating. The ramp angle is 15°.

In Fig. 10.5 the results in terms of the (local) separation and attachment points illustrate the effect [8, 9]. The flow parameters are given in Table 10.6. The flow basically is laminar.

Table 10.6. Flow parameters of the flat plate/ramp case [8, 9].

Moo

Tt [K]

Re’A [1/m]

Tw/Tt

Boundary-layer state

7.7

1,500

4.2-106

0.2-0.666

laminar

The wall temperature ratio is 0.2 A Tw/Tt A 0.666 with Tt = 1,500 K. With increasing surface temperature the length of the separation region Lsep becomes larger. Lsep = 0 defines the corner point (hinge line) of the ramp, which lies 21.6 cm downstream of the sharp leading edge. Also a ramp with

10.5 cm length was employed.

The separation point (point S in Fig. 9.6 c) on page 343) moves up­stream and the reattachment point (point A) less strongly downstream. The experimental and the numerical data are in good agreement. The upstream

Fig. 10.5. Experimentally and numerically determined separation and reattach­ment points on a ramp configuration as function of the surface temperature Tw /T0 (To = Tt) [8, 9].

movement of the separation point is due to the fact that the hotter the sur­face, the smaller the density in the flow near the surface. This reduces the momentum flux of the boundary layer and hence its ability to negotiate the adverse pressure gradient induced by the ramp.

A detailed account of the experimental work is given in [10]. We discuss only three figures from that publication in order to further illustrate the thermal surface effect. The flow parameters are given in Table 10.7.

Table 10.7. Flow parameters of the experimental flat plate/ramp cases [10].

Test condition

Moo

Яе’А, [1/m]

Too [K]

Boundary-layer state

I

8.1

4.6-106

118

laminar

II

7.7

3.5-106

254

laminar

III

7.1

3.1-106

452

laminar

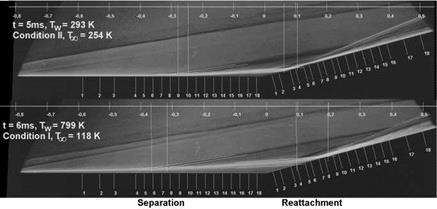
Fig. 10.6 shows typical schlieren pictures for the reference conditions II (upper picture) and I (lower picture). The flat plate/ramp model was heated such that different ratios ‘wall temperature’ to ‘free-stream temperature’ resulted. This ratio is the relevant similarity parameter regarding viscous thermal surface effects, Section 4.4. In the upper picture that ratio is Tw/T^ = 1.15, in the lower Tw/Тж = 6.77.

The schlieren pictures, Fig. 10.6, indicate well the influence of the different temperature ratios Tw/Тж. The barely visible thin short broken lines left indicate the separation shock, see also Fig. 9.6 c), and the thin long broken lines the separation zone.

Flat Plate/Ramp: Length of the Separation Zone

Fig. 10.6. Typical schlieren pictures of the flat plate/ramp flow [10]. Upper picture: condition II, Tw = 293 K, T’x = 254 K, Tw/T’x = 1.15, lower picture: condition I, Tw = 799 K, T^ = 118 K, Tw/T’ж = 6.77.

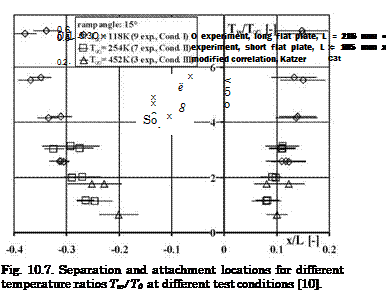
The separation and attachment locations as function of the temperature ratio Tw/TЖ are given in Fig. 10.7. The figure looks quite similar to Fig. 10.5. The data of the upper schlieren picture with Tw/TЖ = 1.15 are the second from below, and those for the lower one with Tw/Tж = 6.77 the ones above.

In [10] the experimentally found lengths of the separation zones LB were compared with those found with a correlation due to E. Katzer for the adi­abatic wall [11]. The authors of [10] have modified that correlation in order to take into account the influence of the wall temperature. The length LB is the straight distance between the points S and A in Fig. 9.6 c) on page 343.

Given in Fig. 10.8 are the experimentally found ratios LB/L as function of Tw/TЖ together with those found with the modified Katzer correlation. The data agree fairly well. Also the data found with the shorter flat plate fit in well. They were obtained in order to clarify questions regarding free shear-layer transition effects.

Flat Plate/Ramp: Length of the Separation Zone

7 8

Tw/Too

Fig. 10.8. Ratio of the length Lb of the separation zone to the length of the flat plate L as function of the temperature ratio Tw/Tо [10].

Reduction of the Turbulent Skin Friction with Side Effects

A computational study of the flow past the HOPPER/PHOENIX configura­tion dealt in particular with thermal surface effects [4]. The RV-W HOPPER was a sub-orbital rocket-propelled single stage space-transportation system studied in the frame of FESTIP, see, e. g., [1].

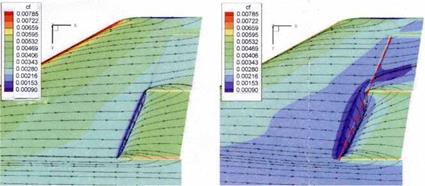
We consider a result found for a re-entry trajectory point with the speed vж « 1 km/s at H « 37 km altitude. The flow parameters are given in Table 10.5. The skin friction was obtained with fully turbulent RANS solutions for two wall-temperature conditions: a) Tw « 500 K, which in the surface part shown in Fig. 10.4 approximately is the radiation-adiabatic temperature belonging to the trajectory point, b) Tw « 1,600 K, which in the shown surface part approximately is the radiation-adiabatic wall temperature belonging to Мж = 14.4 and vж « 4.7 km/s at H « 55 km altitude.

Condition b) with the higher wall temperature resembles the thermal reversal situation of the Space Shuttle Orbiter mentioned in Section 3.1. It is, however, a generic condition.

Table 10.5. Parameters of the flow past the HOPPER/PHOENIX configuration

[4].

Moo

R&L, oo

L [m]

Too [K]

а П

Villlf l ]

T„ [K]

Boundary-layer state

3.2

8.071-106

50.2

242.22

15

20

~500/~l,600

turbulent

Fig. 10.4 shows for condition a) a skin-friction coefficient from the left to the right between cf « 0.005 and 0.0025, and for condition b) between cf « 0.003 and 0.0015. That means that we have a distinctly smaller skin friction for the higher wall temperature.

The effect that the higher wall temperature leads to a smaller (turbulent) skin friction is clearly seen. But there are at least two major side effects and a minor one:

— First to the in Fig. 10.4 at once noticeable major side effect. For condi­tion a) around the hinge line a small separation zone is present, which indicates a—slightly three-dimensional—Edney type VI interaction, typ­ically present at such a supersonic compression ramp, Sub-Section 9.2.1. Downstream of it on the flap the asymptotic ramp flow, although three­dimensional, is present: the—not shown—surface pressure coefficient at­tains the asymptotic behavior, which characteristically is a plateau [1].

For the higher wall temperature, condition b), we see a considerably enlarged—and more three-dimensional—interaction zone with reduced skin

Reduction of the Turbulent Skin Friction with Side Effects

Fig. 10.4. Flow past the lower left wing side of the HOPPER/PHOENIX configu­ration [4]. Influence of the wall temperature on the skin friction. Left part, condition

a) : radiation-adiabatic wall temperature Tw & 500 K (є = 0.8), right part, condition

b) : Tw & 1,600 K. Inboard wing flap deflection niwf = +20° (downward). The flow is from the left to the right. The view is towards the lower (windward) side.

friction on the flap, and—not shown—a markedly reduced surface pres­sure.[175] This reflects the influence of the wall temperature on the tangential boundary-layer profile discussed in Section 10.2. The wall-near momentum flux in the boundary layer is reduced and the flow reacts stronger on an adverse pressure gradient.

The outcome of this side effect is that with the hotter wall the efficiency of the flap is reduced. Generally we note that this holds for any aerody­namic trim or control surface. A detrimental effect would also be present on inlet ramps.

— The second major side effect becomes obvious, if we recall that a hotter surface increases the boundary-layer thickness, the displacement thickness etc., Section 10.2. A larger boundary-layer thickness means—besides an intensified shock/boundary-layer interaction—an increase of the pressure or form drag of a body (wing, fuselage, etc.), an increase of the decambering of an airfoil, etc. [3]. A reduction of the skin-friction drag can be nullified, at least partly, by one or more of these effects.

— The patterns of the skin-friction show that the three-dimensionality of the attached viscous flow ahead of the flap is slightly enlarged for the higher wall temperature, as is to be expected [3]. This minor side effect may lead— at least in the boundary-layer part of the flow—to a deviation from the ideal onset flow of the flap: two-dimensional and normal to the hinge line.

Whether one or all of these effects are important for a flight vehicle, in particular for a CAV, depends on its shape, its mission, the part of the trajectory, and so on. Regarding the form drag, for instance, one should note that trailing edges of hypersonic vehicles may have a considerable thickness in order to cope with the thermal loads.

Generally the question of turbulence modeling for flows with embedded strong interaction phenomena must be considered, Sub-Section 9.2.1 and Sec­tion 8.5. Basically, however, the above results can be trusted. The problems usually are those with the prediction of the thermal loads in the interaction zone.

Cone-Flow Experiment: Amplification of the Second Instability Mode by Cooling

In Section 8.1.4 the influence of the Mach number and the thermal state of the surface on the stability of high-speed boundary layers was discussed. In Fig. 8.5 the influence of wall cooling on the first and the second (Mack) instability mode was shown with theoretical/numerical results of E. Kufner.

New experimental results regarding the influence of the wall temperature on boundary-layer instability and transition of S. Willems and A. Gulhan at DLR Cologne, Germany generously were made available for this book [6].

The experiments were performed in DLR’s hypersonic wind tunnel H2K (air) with a 7° half-angle cone model with two different nose radii (rN = 0.1 mm and 2.5 mm). The model length accordingly is 732.3 mm and 715.0 mm. In a segment between 130 mm and 320 mm—the middle segment— different surface temperatures from Tw = 203 K to Tw = 523 K are set with a temperature-controlled oil flow through a hypocaust in the model. The flow parameters for the case presented here are given in Table 10.4.

Table 10.4. Parameters of the cone-flow experiment [6]. The recovery factor used is r = 0.854.

Moo

Ac A [1/rn]

To [K]

Too [K]

Trec [K]

Tw [K]

6.03

8-Ю[174]

500

61

436

203—523

On the model’s rear segment between 320 mm and the end of the cone the surface temperature was measured with infrared cameras. The high-speed static pressure fluctuation measurements were made with PCB piezo pressure sensors.

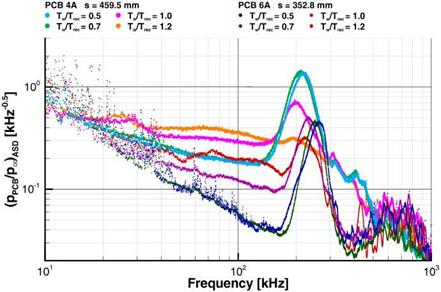
Fig. 10.3 gives pressure spectra found at two locations on the rear segment of the sharp cone. The locations measured from the nose tip are s = 352.8 mm and 459.5 mm.6

Cone-Flow Experiment: Amplification of the Second Instability Mode by Cooling

Fig. 10.3. Influence of the wall temperature Tw on the spatial amplification rates (PCB spectra) of the second instability mode in the boundary layer at a sharp (tn = 0.1 mm) 7° half-angle cone [6]. Shown are the spectra for several ratios Tw /Trec for a = 0° at two locations with distances from the nose tip s = 352.8 mm and 459.5 mm.

The second (Mack) instability modes show amplitudes which in general clearly become larger with lower wall temperatures. This holds for both loca­tions on the cone. (The transition process is completed at s ~ 500 mm for the highest and at s « 600 mm for the lowest wall temperature.) The results— also the other results from [6] not shown here—are in accordance with Mack’s result that surface cooling amplifies the second instability mode, Sub-Section 8.1.4.

These experimental results also corroborate qualitatively Kufner’s the – oretical/numerical results from the year 1995. Qualitatively only, because Mach number and unit Reynolds number were different, the cone was blunt, the ratios Tw/Trec, however, covered a similar range. The frequency ranges of the second modes are of the same order of magnitude. In any case, both the theoretical/numerical and the experimental results show that and how ther­mal surface effects influence instability/transition mechanisms. The thermal state of the surface is an important parameter.

Displacement Thickness at a Highly Cooled Wall

In three-dimensional boundary-layer flow the displacement thickness Ji can become negative [3]. This typically happens if the flow diverges strongly, for instance at attachment lines. Regarding two-dimensional flow one expects intuitively that J1 will always be positive. However, if the wall is highly cooled, J1 may become negative. This effect is illustrated with the example of a rocket-nozzle boundary-layer flow [5]. The flow was computed with an high-temperature real-gas model, turbulent flow was assumed. We consider the situation at a location downstream of the nozzle throat. Table 10.3 gives the boundary-layer edge flow parameters (e) and the wall temperature Tw.

Table 10.3. Parameters of the nozzle-flow case with a highly cooled wall [5].

Me

Ret [1/m]

мє [m/s]

Ге [К]

Pe [kg/m3]

Tw [K]

Boundary-layer state

2.23

8.071-106

3,119.51

2,418.24

0.1881

510

turbulent

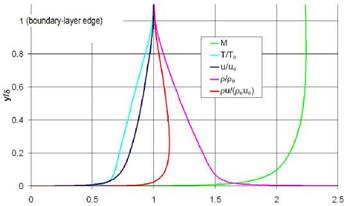
The results in terms of the parameters stream-wise Mach number M, static temperature T, wall-tangential velocity u, density p, and the wall – tangential mass flux pu are given in Fig. 10.2. Except for the Mach number they each were made dimensionless with their boundary-layer edge value.

Displacement Thickness at a Highly Cooled Wall

Fig. 10.2. Rocket-nozzle flow downstream of the nozzle throat [5]. Dimensionless distributions of Mach number M, temperature T/Te, velocity u/ue, density p/pe, and mass-flow pu/(peue) across the boundary layer. The boundary-layer edge values are given in Table 10.3.

The wall to edge temperature ratio is Tw/Te « 0.2. Accordingly the den­sity ratio is pw /pe « 5 (the respective graph in the figure extends outside to the right). The mass flux pu in the boundary layer at maximum is al­most 12 per cent higher than that at the boundary-layer edge. The resulting displacement thickness, eq. (7.108), is negative with Ji = —0.27 m.[173]

Boundary-Layer Thickness at a Heated Wall

The supersonic laminar viscous boundary-layer flow past a flat plate was computed for two different constant wall temperatures [4]. The Navier-Stokes equations were employed, perfect gas was assumed. The flow parameters are given in Table 10.2. Note that the lower wall temperature is below the recov­ery temperature Tr, hence the boundary layer is cooled (heat flux into the wall). At the higher wall temperature the situation is reverted.

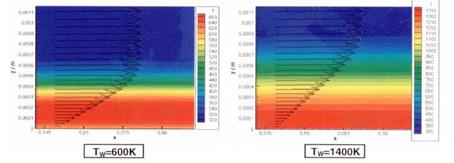
Results of the computations are given in Fig. 10.1. Shown are the tan­gential velocity profiles and the static temperatures, the latter with different color bars.

Table 10.2. Parameters of the perfect-gas flat-plate case with two wall tempera­tures [4].

Moo

R&ref

L [m]

Too [K]

Tr [K]

Tw [K]

Boundary-layer state

4

2.036-107

0.467

300

1,125

600/1,400

laminar

Boundary-Layer Thickness at a Heated Wall

Fig. 10.1. Tangential velocity profiles and static temperature distributions at a flat plate with two different wall temperatures [4]. Note the different color bar scales, z is the coordinate normal to the wall.

We find several effects in the figure:

— According to eq. (10.4), the larger wall temperature (right) leads to a decrease of the average density < p > compared to the case with smaller wall temperature (left).

— If the same mass flow is present, the boundary-layer thickness S as well as the displacement thickness Si are larger in the case of the larger wall temperature. In fact S is two times larger with the hotter wall.

— For the lower wall temperature the velocity profile is full like a Blasius pro­file (left). With dT/dygw < 0 (heating of the boundary layer)—according to the wall compatibility condition—for the higher wall temperature a weak point of inflection is discernable at about z = 0.0001 m (right).

— The velocity gradient du/dzw is smaller for the hotter than for the cooler wall. Although the viscosity pw is increased, the skin friction tw is smaller for the hotter wall.

— Because of the smaller average density in the case of the hotter wall, also the average tangential momentum flux < pu2 > is reduced. If an adverse pressure gradient would be present, the boundary layer would be more at risk to separate. This is corroborated by the presence of the weak point of inflection.

Examples in Foregoing Chapters

In the next sections several examples of viscous thermal surface effects are discussed. Before that is done, examples mentioned and/or discussed in pre­vious chapters are recalled.

— The thermal reversal during low-speed flight after the re-entry of the Space Shuttle Orbiter is mentioned at the end of Section 3.1. Thermal reversal means that the wall has a temperature, which is larger than the recovery temperature belonging to the momentary flight Mach number. The result is that the skin-friction drag is smaller than at a cold wall, which is given in wind-tunnel experiments for the creation of the low-speed aerodynamic data set. This possibly is the reason for the observation during the re-entry first flight of the Orbiter that the lift-to-drag ratio in the low supersonic and subsonic flight phases was larger than predicted. However, because of the thicker boundary layer the pressure (form) drag of the wing will increase [3]. This may change the conclusion.

— The influence of the temperature gradient in the gas at the wall and the wall temperature itself on the point-of-inflection behavior of the tangential flow profile of the boundary layer is discussed in Sub-Section 7.1.5, see also the previous section of this chapter.

— Properties of attached viscous flow as they are influenced by the wall temperature are considered in Section 7.2 with the help of the reference – temperature concept. Some of the results are summarized in the previous section.

— In Section 7.3 results of a numerical study of the flow past the forebody of the lower stage of the TSTO space transportation system SANGER are presented. Different assumptions regarding the gas model (perfect gas, equilibrium real gas) and surface radiation cooling (off: є = 0, effective: є = 0.85) influence the skin friction distribution as shown for the lower symmetry line. The general result is that the hotter the surface, the smaller is the skin friction. The effect is mainly seen for turbulent flow, much less for laminar flow, as summarized in the previous sub-chapter, too.

— The influence of the thermal state on the surface on the stability behavior is discussed in Sub-section 8.1.4. A numerical example shows the influence of the wall temperature—smaller or larger than the recovery temperature— on the amplification rates of the first and second mode in the boundary layer at a blunt cone at M= 8. Another numerical example shows for different free-stream Mach numbers the influence of the wall temperature on the transition location in the boundary-layer flow past a flat plate.

— In Section 9.2 shock/boundary-layer interaction is studied. For the laminar flow past a flat plate/ramp configuration numerical results show the influ­ence of different wall temperatures on the extent of the separation zone around the flat plate/ramp junction. The larger the wall temperature, the larger is the separation zone. The surface pressure distribution is affected accordingly.