Category FLIGHT MECHANICS MODELING and ANALYSIS

SPECIFIC DYNAMIC MANEUVERS FOR DETERMINATION OF DRAG POLARS

In order to determine lift/drag performance of an aircraft from flight data, one can plan to conduct dynamic maneuvers [12,13]. These maneuvers place lesser restric­tions on the pitching motion of an aircraft while conducting the maneuver.

image131

image132

Time (s)

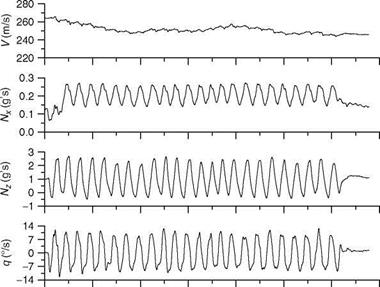
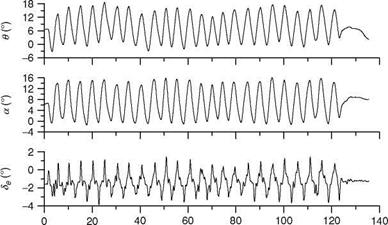
FIGURE 7.8 LAM flight-time histories.

The classical steady-state maneuver is used for drag polar determination using static weight/lift and drag/thrust balance equation:

W = L = дЗСь^т; D = qSCDam; T – D – Wsing = 0

coefficients at the trim AOA. Measurement of the dynamic pressure is also import­ant. The aircraft is thus trimmed at required AOA. The total time consumed for these experiments would be much more than that taken by dynamic maneuvers. Dynamic maneuvers cover a large range of AOA, Mach number, and normal accelerations and still take flight test time of about one fourth of the static/steady-state maneuvers, saving time, effort, and fuel for the flight tests. However, it is required to carry out flight data analysis, and using parameter estimation methods, the drag and lift coefficients are estimated. Then drag coefficients are plotted versus lift coefficients to obtain the drag polars.

Large Amplitude Maneuvers

Large amplitude maneuvers could occur during certain regimes perhaps due to loss of stability, damping, or control effectiveness. Also, it may not be possible to trim a

image120

given airplane at certain AOAs, and hence small amplitude maneuvers are not useful. For such a situation, using large amplitude maneuvers (LAMs) and data partitioning, it is possible to generate aerodynamic derivatives over the AOA range covered by the LAM [11]. The method for analyzing these maneuvers consists of partitioning, i. e., dividing the LAM that covers a large AOA range to several bins or subsets, each of which spans a smaller range of the AOA, and a stepwise modified linear regression (SMLR) method to determine the structure of the aerodynamic model

image122,image123,image124,image125

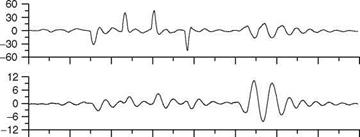
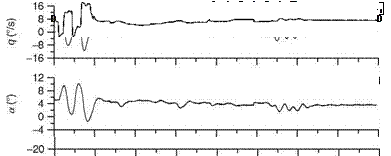
within each bin. LAM data in the longitudinal axis are generated by giving doublets and multistep 3-2-1-1 inputs with different large amplitudes to the pitch stick. The LD characteristics can also be evaluated at high angle of attack by performing longitudinal LAMs; i. e., when large excursions of angle of attack are made and LD maneuver generating command input is given. Typical LAM flight-time histories are shown in Figure 7.8. A parameter estimation case study using LAM data is presented in Chapter 9.

E

I


E


16

8

0

-8

-16

image129


m

image127


image128

Rudder Input Maneuver

Rudder input maneuver is used to estimate yaw derivatives and rudder control effectiveness. Starting from a trimmed level flight, a doublet or 3-2-1-1 command is applied to rudder pedals keeping the thrust constant. The pulse width of the input signal is appropriately chosen to match the predicted roll-roll frequency.

7.6.1.6 DR Maneuver

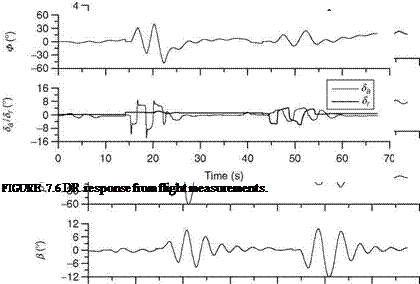
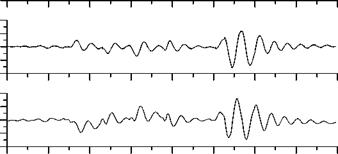
The purpose of the DR maneuver is to excite the DR mode of the test aircraft and determine the LD aerodynamic derivatives. Starting from the level trimmed flight (at the chosen flight condition), an aileron stick command is given first and then a command is given to rudder pedals. The command inputs should be either doublet or 3-2-1-1; the thrust is kept constant. The response should be allowed to settle for 5-10 s and the record should be for about 15-20 s, since two consecutive responses (due to aileron and rudder inputs) should be analyzed, preferably in one go. The maneuver is of a short-period kind and the data generated enable the determination of aileron and rudder effectiveness as well as roll/yaw motion-related aerodynamic derivatives (Lp, Lp, Np, Nr). Typical DR maneuver flight-time histories are shown in Figure 7.6.

7.6.1.7 Steady Heading Sideslip Maneuver

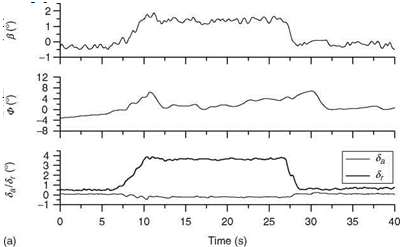
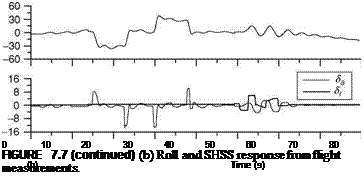
In a steady heading sideslip (SHSS) maneuver, starting from level flight, the rudder pedal is applied and held constant to allow the sideslip angle to build up with minimum variation in speed. As the airplane begins to yaw and enter into a skidding turn, it is banked in the opposite direction by applying aileron deflection to maintain a constant heading. As the rudder pedal is further applied, the aileron deflection is adjusted to keep the heading angle constant; the speed variation is marginal. After completing the sideslip maneuver with one rudder pedal, the aircraft is retrimmed and the procedure repeated with the other rudder pedal. This maneuver, along with the DR, can be used to generate the requisite information to assess the aircraft’s directional and dihedral stability. Typical SHSS maneuver flight-time histories are shown in Figure 7.7.

Aileron Input Roll Maneuver

Aileron input roll maneuver data are used for estimation of roll damping and aileron effectiveness. Starting from a trimmed horizontal level flight, a doublet or 3-2-1-1 input command is applied to the aileron stick. The time width of the input signal is chosen appropriately to excite the aircraft rolling motion dominantly. Roll damping and frequency are also determined. The roll mode time constant could be 0.1-2.5 s. An airplane normally has neutral static stability in roll. The maneuver generates

bank-to-bank motion, which can be used to estimate roll derivatives. The maneuver is initiated with a (short duration) pulse input to aileron in one direction (for about 30° roll) and after a few seconds, the aircraft is brought back to horizontal level position with an input to the aileron in the reverse direction. The process is then repeated in the other direction. At the end of this maneuver, the heading angle should be approximately same as at the beginning. Pure roll-related derivatives Lp, Ld can be estimated from these data.

Specific maneuvers for aerodynamic modeling

In this section many specific maneuvers are described for generating the flight test data that can be further processed in the parameter-estimation methods/SW for determination of the aerodynamic derivatives of the test aircraft.

7.6.1 Small Amplitude Maneuvers

The amplitude of the maneuvers is kept small so that the assumption of linearity is not violated and hence simple linear models can be used for parameter estimation.

7.6.1.1 Longitudinal Short-Period Maneuver

The short-period oscillation is the first one that the test pilot sees/feels after disturb­ing the airplane from its trim with the pitch control. Heavily damped signifies that the oscillation is damped within about two cycles after the completion of initial input. The short-period oscillation must be heavily damped both with controls fixed and free. The typical damping ratio would be 0.3 to 0.9, and the period is 1 to 4 s. The test for longitudinal dynamic stability is performed by a rapid movement of pulse of the control in a nose up and nose down direction at a rate and degree to obtain a short-period response. Dynamic longitudinal stability must be checked at a sufficient number of points in each flight test configuration. In a horizontal level trimmed flight with constant thrust, a doublet or 3-2-1-1 multistep command is applied to the pitch stick. One usually tries to avoid variations in the LD axes. Small corrections in the aileron and rudder positions are allowed if necessary. The time width of the input signal is appropriately selected to excite the short-period mode of the aircraft. The aircraft is trimmed at the required altitude and speed. Then the pitch stick is moved in the manner of the specified input signal (either doublet or 3-2-1-1). The mode is expected to be of 2-3 s duration and the data is recorded for about double the duration to cover the exponentially damped sinusoidal response. One can determine the longitudinal derivatives (Chapters 4 and 9) and also the neutral point of the aircraft from these flight test data (Chapter 9). Subsequently, the frequency and damping ratio of the short-period mode can be determined using MATLAB program. Typical SP maneuver flight-time histories are shown in Figure 7.4.

7.6.1.2 Phugoid Maneuver

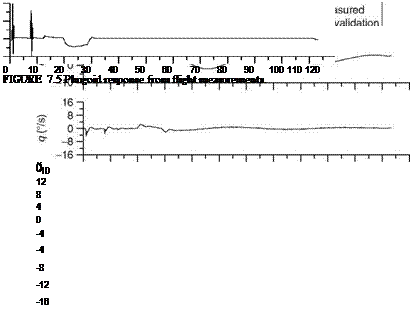
As the mode is usually of 40-60 s duration (it could be even up to 120 s), longer data recording is required. A longer duration (10-15 s) pulse command input is applied to the pitch stick keeping the thrust constant. The aircraft is allowed to go through a minimum of one/two complete cycles (for about 2-3 min) of the phugoid oscilla­tions before retrimming. One can determine the longitudinal phugoid-related (speed) derivatives of the aircraft from these flight test data. Subsequently, the frequency and damping ratio of the phugoid (long period) mode can be determined using the MATLAB program. The phugoid damping ratio would be 0.03 to 0.1. Typical phugoid maneuver flight-time histories are shown in Figure 7.5.

7.6.1.3 Thrust Input Maneuver

The thrust input maneuver is used to determine the effect of a thrust variation on the aircraft motion. Starting from trimmed level flight, a doublet variation in thrust is applied and the flight data recorded.

7.6.1.4 Flaps Input Maneuver

Flaps input maneuver can be used to gather information for estimation of flaps effectiveness derivatives. Data are generated by applying a doublet or 3-2-1-1 input to flaps. Other longitudinal controls and thrust are kept constant. Variations in the LD motion are kept small.

110 –

image113,image114,image115

-И 100­90- 80-| 70-

Time (s)

FIGURE 7.4 Typical short period response in flight.

7.6.1.5 LD Maneuvers

Positive static directional stability is the tendency to recover from a skid with the rudder free. Positive static lateral stability is defined as the tendency to raise the low wing in a sideslip with the aileron controls free. Negative static lateral stability is not permitted unless the divergence is gradual and is easily recognizable and controllable by the pilot. For dynamic LD stability, the oscillation must be positively damped with controls free. It must be controllable with normal skills of use of the primary controls.

image118

Time (s)

INPUT SIGNALS FOR EXCITING MANEUVERS

Specific command inputs are required to conduct certain maneuvers, the data from which are used for parameter estimation or drag polar determination.

7.5.1 Design Consideration for Input Signals

The responses of an aircraft to a pilot’s (or computer’s) command signal are the flight data that along with other mandatory data (mass, inertia, dynamic pressure, etc.) are used in a parameter-estimation procedure to estimate the aerodynamic derivatives. These responses are generated by exciting certain modes of the aircraft. These dynamic modes contain information on the aerodynamic derivatives implicitly. Thus, it is very essential to choose input test signals with good characteristics so that properly excited dynamic responses are available for further analysis. The test input signal must possess certain desirable features [1,7]: (1) it should have sufficient bandwidth to excite the modes of interest, (2) the amplitude and form of the signal should be sufficient to yield good quality maneuvers, (3) the amplitude, bandwidth, and slope of the signal should be bounded so that aircraft motion does not violate the assumption of linearity, and (4) it should be possible for the pilot to realize (or generate) the signal easily. Of course, for difficult signals computer­generated input signals can be used.

Different types of input signals that have certain desirable attributes are [7] (1) a doublet signal excites a band at a higher frequency, the response is not unidirec­tional, and it is easy to generate by a pilot, (2) a 3-2-1-1 signal has a relatively broadband spectrum, can effectively excite over a decade of frequency, and it is also easy for a pilot to generate with some practice, (3) the Schulz input signal is designed by maximizing the trace of Fisher information matrix (FIM, Chapter 9), relatively higher frequencies are missing in it, might give relatively large standard deviations compared to the next two signals, and is not so easy to generate by a pilot, (4) the DUT (Delft University of Technology) input signal is designed by minimizing the trace of estimation error covariance matrix P, is a reasonably good signal, and is not so easy to generate by a pilot, and (5) the Mehra input signal is designed by maximizing the determinant of FIM in frequency domain, is a reasonably good signal, and is not so easy to generate by a pilot. For a given case study the 3-2-1-1, DUT, and Mehra input signals were found to be of similar efficiency [7]. Many of these signals can easily be generated only by a computer or a flight test panel. The subject matter of the design of test signals for parameter estimation is relatively complex and requires considerable mathematical sophistication. Hence, only some important aspects of the design procedures are highlighted here.

In order to design a multistep input signal, which will excite the modes of an aircraft, one can use the Bode diagram approach [7]. This allows one to select the frequencies to be included in the signal based on the identifiability of the derivatives. Let the longitudinal motion be described as

U + gU — Xuu — Xa • a = 0

a q Zuu Za • a Zdede 0

q — Mui — Maa — Mq q — MSe de = 0

The frequency response magnitudes of the terms in the above equations could be plotted as a function of the input signal frequency. Based on this analysis, a derivative is considered identifiable when its term has a magnitude of at least 10% of the largest term’s magnitude. This approach is intuitively appealing. There are other approaches based on (1) minimization of the estimation error variance of the parameters by means of an appropriate choice of input signal characteristics subject to energy constraints, (2) maximization of the trace of the FIM, (3) minimization of the trace of the estimation error covariance matrix, and (4) the determinant of the FIM.

The required input signal should be generated either manually by a pilot or by some automated technique. In the former case, the pilot flying the test aircraft gives a command by practicing it several times to obtain a good quality signal in terms of its form and amplitude. The signal thus generated may not be a perfect one but if it has acquired adequate characteristics then it is acceptable. In essence, it must be able to excite the modes of the aircraft. In order to obtain accurate signal characteristics one can use electronics or computer means; thereby, it may also be possible to automate the generation of the signal. A pregenerated/prerecorded signal can be replayed during the test schedule. While using automatic means for generating and applying the input signal, care should be taken to assure that, in case of any exigency, the pilot is able to take over the control of the vehicle. There should be a mechanism to shut off the automatic application very quickly if so desired and revert to the manual mode of control.

7.5.2 Specific Input Types

Some specific input signals are shown in Figure 7.3. A doublet stick/rudder pedal input signal excites a band at a relatively higher frequency. It is used to excite longitudinal/LD short-period modes. It is applied to the aircraft control surface through pilot’s pitch, roll-stick, and rudder pedals. At the end of the input, the controls are held constant for some time to permit the natural response of the aircraft to be recorded. When applied to ailerons, it excites the rolling motion, which can be analyzed to obtain derivatives for roll damping and aileron control effectiveness. A similar test signal can be used for the rudder surface to determine yaw derivatives and rudder effectiveness. If the natural frequency шп of the mode to be excited is approximately known, then the duration of the time unit At for a doublet can be determined as At ffi 1.5/v„ s.

A 3-2-1-1 type is a series of alternating step inputs with the time duration of the steps satisfying the ratio 3:2:1:1. This input signal has power spread over a wider frequency band than the doublet power spectrum. The aircraft short-period longitu­dinal motion can be produced by applying 3-2-1-1 input to the elevator. The time unit At needs to be selected appropriately to generate sufficient excitation in the aircraft modes of motion.

A step input signal has energy at a relatively lower band of frequencies and is not very suitable for system identification purposes. A longer duration pulse (of 10-15 s) can be applied to the pitch stick/elevator to excite the longitudinal phugoid motion of the aircraft. The responses should be recorded for a sufficient number of cycles before retrimming. From these responses, one can estimate speed-related derivatives and phugoid damping and frequency. The doublet inputs tend to excite only a narrow band of frequencies. The pulse inputs have power at low frequencies and therefore suitable for exciting only low-frequency modes of the system. A combination of various input forms is generally considered the best for proper excitation of the aircraft modes.

QUALITY OF FLIGHT TEST MANEUVERS

It is very important to keep track of the quality of the flight test maneuvers, because the quality of the estimates obtained and any deductions made from using these in analysis programs depend on the quality of maneuvers [1]. The aim should be to maximize the information content in the data. This requires good planning and experiment design. If the maneuvers are conducted to generate the data for parameter estimation, then specific maneuvers are required to be planned. It so happens that the maneuvers conducted for other purposes generally do not provide reliable data for parameter-estimation exercises. For the latter purpose, very careful consideration of many factors is essential: control inputs, signal magnitudes, sampling rates, and signal to noise ratio (SNR). If the information content in the aircraft responses is not adequate, then these data will not provide good estimates of the aerodynamic derivatives. The SNR should be at least 10 for the most important signals required for the analysis. In addition, such data with low SNR are not good to model the plant in general. It is often felt that to obtain good estimates of the control effectiveness derivatives, application of one control input at a time would be a good strategy. Other control inputs can be applied in some sequence. The question of sufficient excitation of the modes is of great importance. As we are interested in studying the dynamic modes of the vehicle, it is important that the modes are excited properly and they become apparent in the time responses. If the modes are not adequately excited and captured in the data, then system identification will be ill-conditioned. One should use a small magnitude for inputs so that the assumption of linearity is maintained for subsequent analysis. This is mainly because aerodynamic derivatives are defined on the assumption of small perturbation theory. The SNR consideration is important for the small amplitude maneuvers. Typical maneuver amplitudes for a fighter class of aircraft would be (peak) alpha = 2°, beta = 1°, roll rate = 30°/s, pitch rate = 10°/s, yaw rate = 5°/s, normal acceleration = 0.25g, and lateral acceleration = 0.1g.

Large amplitude maneuvers will excite nonlinear phenomena/dynamics; how­ever, these might be required for specific reasons, as will be discussed later. Often and almost always repeated maneuvers are needed to obtain consistent estimates of the derivatives. If a few maneuvers are bad then they can be neglected and the overall flight test time is reduced. This would save fuel and test efforts. To that extent the maneuvers should be conducted in calm atmospheric conditions, unless the purpose is to specifically test the aircraft responses in turbulent weather.

The command inputs types, if they are simple, can then be applied manually very easily. If not, then the pilot should practice sufficiently on a real-time flight dynamics simulator or on a computer connected to a joystick. Some input types can be programmed or computerized and applied through a flight test panel. The issue of generating the data for parameter estimation from closed loop responses of an inherently unstable/augmented aircraft is of paramount importance. The generated responses can be often checked on the site, i. e., at the flight test center itself. This will ensure the adequacy of the data for subsequent offline/batch processing analysis. One should also ensure that the data are adequate and of sufficient length (in time) to be suitable for consistency analysis.

LD Data Generation

The purpose of LD data generation is (1) to establish steady sideslip capability, (2) to determine the crosswind landing capability, (3) to determine the rudder and lateral control hinge moment, (4) to determine the rudder effectiveness (C„s^, and (5) to determine the directional stability (Cn ). LD testing involves two or three axes testing. In a level flight with symmetric thrust, the rudder deflection is given with lateral control such that the flight path is straight and there is no change in heading, with sideslip and bank angle, for various rudder angles. The maximum values of the sideslip angles are obtained by performing tests at gross weights and aft CG. The data are used to obtain the relationships between control deflection and various angles: bank angle, sideslip angle, and angle of attack. Maximum values of the rudder deflection and the sideslip angles, wheel deflections, and bank angles are plotted as a function of Mach number and altitude, and the maximum values of the sideslip angles are obtained at heavy weight and aft CG. The yawing moment produced by the rudder can be computed by knowing the yawing moment produced by the asymmetric thrust and using the rudder to reduce the sideslip angle to zero.

Various dynamic characteristics also need to be established: (1) the Dutch roll (DR), (2) spiral stability, and (3) LD rate derivatives. These characteristics are estab­lished by generating the flight test data by using doublet/3-2-1-1 inputs and performing the appropriate maneuvers as discussed in Section 7.6. Then, parameter estimation methods are used to determine the stability and control derivatives of the aircraft.

SPECIFIC FLIGHT TEST DATA GENERATION AND ANALYSIS ASPECTS

Flight test data have the following roles to play [1-3,6]: (1) To substantiate that the aircraft meets certain specific stability and control parameters. (2) To correlate these data with the wind tunnel or analytical data. Based on the flight test data some adjustments can be made; these adjusted wind tunnel (WT) or analytical data can be used to extrapolate the flight data to other regions of the flight envelope where the flight tests are not performed because of the limitation of safety and cost. (3) To adjust and substantiate the mathematical models used in flight simulators, for which the time histories and stability and control derivatives are used for comparison, validation, or upgradation of the math models. (4) To aid the design of a future aircraft. Flight test data generation and analysis aspects are highlighted in the following section [2,3,8].

7.3.1 Longitudinal Axis Data Generation

The stabilizer angle to trim the aircraft exercise is determined to establish trim characteristics, to obtain the effect of configuration or thrust changes on stabilizer trim, and to determine stabilizer effectiveness. The aircraft is trimmed using the stabilizer with zero elevator deflection. The trimmed state is attained when the aircraft can fly hands-off in a steady unaccelerated flight mode. The stabilizer angle required to trim is plotted as a function of lift coefficient for low speeds and Mach number for high speeds for a range of CG configurations and thrust settings. Various desired effects are then discerned from these plots.

For a range of flight conditions and configurations, the aircraft is mistrimmed with the stabilizer and retrimmed with the elevator, keeping the thrust constant and maintaining the unaccelerated flight. The effectiveness of the elevator can be obtained by plotting the elevator-stabilizer curves as a function of CG.

In conducting a maneuvering flight the purpose is (1) to evaluate the handling characteristics such as pullup and wind-up turns (WUTs), (2) to determine pitching moment/lift characteristics, and (3) to determine elevator hinge moments.

The static (speed) stability test is required to determine aircraft’s static stability and to determine the neutral point of the aircraft (Appendix A). The aircraft is trimmed at one speed, and the elevator deflection and stick force required to fly at another speed in a straight flight are measured. Keeping thrust constant the aircraft is flown at all the speeds.

It is important to investigate controllability and handling characteristics of the aircraft and basic lift and pitching moment characteristics in the high angle of attack range.

The primary interest in the stall exercise is the ability to recover from a stalled condition. Some characteristics related to stall conditions are (1) it occurs at the critical AOA, (2) at/after this AOA, the lift coefficient does not increase with an increase in AOA, (3) this special point on the lift curve also corresponds to a point on the power curve, (4) if the lift coefficient is small, the aircraft has to fly at a higher speed to support the weight, (5) the lift coefficient has a maximum and the airspeed a minimum—this minimum airspeed is the stalling speed, (6) normally it is not possible to sustain the flight below the stalling speed, and (7) the drag coefficient is high in the stalled regime and hence it needs a lot of power to maintain the level flight, but with constant power the rate of climb decreases. Mainly there would be an uncommanded and easily recognizable nose down pitch and a roll motion that cannot be readily arrested with normal use of the controls. One can recover from the stall by reducing the angle of attack using normal control by the elevator. The stall
maneuvers are flown with varying entry rates. The effect of thrust level is also studied. The 1g stall speed is the speed below which 1g level flight is impossible. The minimum speed is the lowest measured speed during the stall maneuver. The stall entry rate is defined as the slope of the line between 1.1 * minimum speed and the minimum speed. During the closing phase of the stall maneuver, the control may be moved forward to maintain a constant deceleration rate and to reduce the large pitch angle changes.

It is well known that ground effect, which results from a change in the flow field in the presence of the ground, can significantly affect the takeoff and landing characteristics of the aircraft. The effect of ground proximity on the stability and control of the aircraft should be evaluated as it has operational implications and also is very important for validation of flight simulators [4,5]. This is because a large part of the pilot training in the simulator is related to approach and landing tasks. The simulator models should be checked properly in these flight phases. The aircraft is flown along the runway at progressively lower heights for a range of speeds. The height is measured with radar altimeter and the ILS is used for an approach. The autopilot is disengaged before entering the ground effect, and the aircraft behavior is observed in the ground effect with hands off the controls. The aircraft is trimmed for the approach and when it enters the ground effect the body angle is kept constant using the elevator control until the touchdown. The data from the ground effect and the reference data from the out-of-ground effect are compared and the increment in elevator deflection is determined. Then, the change in the pitching moment due to the ground effect is computed. This change is caused by a change in the angle of attack, a change in the Cm , and a change in thrust to keep speed constant. Based on this analysis, the update of the simulator models can be made if needed.

The tests for establishing the capability of the elevator to lift the nose wheel off the ground during the takeoff phase of the flight are also made. With the forward CG, the stabilizer is set at the recommended position and the elevator is fully pulled up some time before the rotation is expected. The rotation speed is determined when the body angle starts increasing, i. e., the pitch rate is positive. The liftoff point is determined when the main gear lifts off the ground.

The dynamic characteristics of the aircraft are assessed by performing the short – period and phugoid maneuvers and generating the data by giving doublet or 3-2-1-1 input commands to the pitch stick, as discussed in Section 7.6 (Figure 7.3). The SP mode is critical since its period can approach the pilot’s reaction time. To determine

Подпись: At

image112

3At At

Подпись: At2At At

FIGURE 7.3 Specific input types: doublet, 3-2-1-1, and pulse. (At is the unit step width in seconds.)
the stability and control derivatives of the aircraft, the data from these flight test maneuvers are processed in parameter-estimation SW (Chapter 9).

Other Maneuvers

Longitudinal maneuvering implies changing the altitude of the aircraft and changing the direction (flight path angle) and magnitude (airspeed) of the velocity vector. Pitch altitude variation is achieved by deflecting the (aerodynamic) control surface on the horizontal tail of the aircraft. The magnitude change in the velocity is affected by operating the thrust level of the engines and a small change in the pitching motion. The direction of the velocity vector is changed by a variation in the lift vector through altitude variation. Lateral maneuvering is affected by rolling the aircraft about its longitudinal axis by deflecting ailerons or elevons as the case may be (e. g., for a delta wing aircraft the elevators and ailerons are on the rare ends of the wing and are called elevons). The differential movements of end-elevons give rise to a rolling moment about the pitch axis of the aircraft.

Aircraft’s maneuverability is defined as the ability of an aircraft to change the speed and flight (-path) direction. A highly maneuverable aircraft can accelerate or slow down (SD) very quickly. However, a quick maneuver with a short radius would induce high loads on the wings, referred to as ‘‘g-force.’’

In equilibrium condition, the thrust is equal to the drag force, so that the aircraft is stabilized in level flight with a constant speed. As per Newton’s laws, the aircraft continues to fly with constant speed, unless there is some additional force of disturbance. Now, if the throttle is advanced to obtain full power from the engine, the thrust exceeds the drag force, and this excess force accelerates the aircraft because force = mass x acceleration. The aircraft will speed up due to accelerating force and stabilize; when the excess thrust becomes zero, the aircraft reaches its maximum speed. The importance of excess thrust is that it can be used either to accelerate the aircraft to a higher speed or to enter a climb at a constant speed or a combination of both (Exercises 7.9 and 7.10). However, with an increase in speed, if the pilot does not want the aircraft to climb, then he or she has to lower the elevator (so the inclined/upward force acting on the elevator generates a nose down moment of the aircraft) by pushing the stick forward.