Category Flight Vehicle Aerodynamics

Aerodynamic Force Analysis

This chapter will examine aerodynamic forces acting on a body, and how they are related to the properties of the flow-field. A major goal is to rigorously relate the lift, drag, and sideforce components to the flow-field on a closed bounding surface which is either on the body surface itself (near-field force), or arbitrarily far from the body (far-field force).

Another major goal is to simplify the far-field forces using suitable simplifications and idealizations of the flow-field, in particular the trailing vortex wake. This will produce expressions for the lift, drag, and sideforce which involve the trailing vortex wake alone. It will also allow the decomposition of the drag force into profile-drag and induced-drag constituents, and thus enable the optimization of aerodynamic configurations for minimum induced drag.

5.1 Near-Field Forces

5.1.1 Force definitions

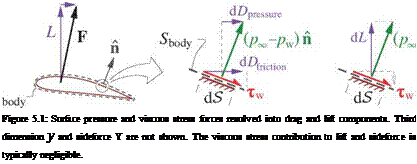
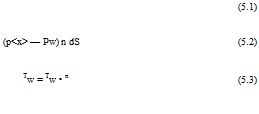
The near-field aerodynamic force F on a body is the total force that the fluid exerts on its surface Sbody, as shown in Figure 5.1. This can be decomposed into pressure normal forces and viscous stress forces,

Подпись: (5.1) (p<x> — Pw) n dS (5.2) Tw = Tw • n (5.3) Подпись:F

F

F pressure Ffriction

where pw, Tw are the pressure and viscous stress vector acting on area element dS, with unit normal n. Replacing — pw with pTO—pw in the second pressure integral is allowed because the uniform pressure pTO does not exert a net force on a body. This follows from the identity◦ n dS = 0, valid for any volume.

Choosing the x-axis to be aligned with the freestream, V = X, the streamwise drag force component is

then D — F • X, which has pressure and friction contributions, as shown in Figure 5.1.

D=

F • X — Dpressure + Dfriction

(5.4)

Dpressure =

(p<x> — Pw) n • X dS

(5.5)

Dfriction =

(Я Tw • X dS

(5.6)

W t_*.

Подпись: Figure 5.1: Surface pressure and viscous stress forces resolved into drag and lift components. Third dimension y and sideforce Y are not shown. The viscous stress contribution to lift and sideforce is typically negligible.

Подпись: D

The transverse-horizontal and transverse-vertical components are the sideforce Y and the lift L.

Y = F ■ y ~ (pTO – pw) n ■ y dS

(5.7)

L = F ■ z ~ U (pTO – pw) П ■ z dS

(5.8)

The viscous stress contributions to Y, L will be neglected in the subsequent discussion, since at high Reynolds numbers they are typically negligible compared to the pressure contributions.

Transitional separation bubbles

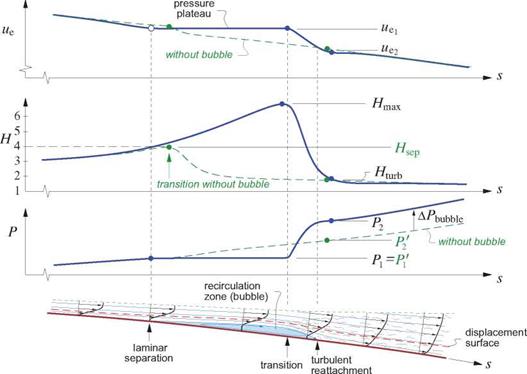
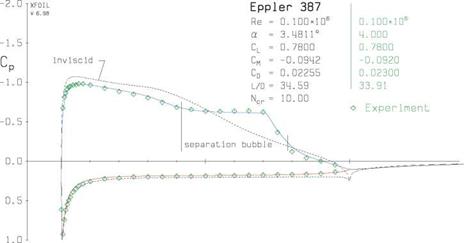
In a sufficiently clean flow and at a sufficiently low Reynolds number, natural transition will occur after laminar separation takes place. Past transition, the now-turbulent separated shear layer is able to reattach, forming a transitional separation bubble (also called a laminar separation bubble), originally investigated by Tani [40] and Gaster [41]. An example of such a flow is shown in Figure 4.34, in which a separation bubble is revealed by the pressure plateau over its laminar portion, followed by a rapid pressure rise over the turbulent portion after transition. The plateau is a consequence of the nearly-still fluid inside the laminar part of the bubble being unable to sustain any significant pressure gradients. In contrast, the strong turbulent mixing in the turbulent portion can support the strong adverse pressure gradient.

Figure 4.35 diagrams the overall separation bubble flow, together with its associated edge velocity ue(s), shape parameter H(s), and momentum defect P(s) distributions. The steep velocity decrease from uei to ue2 over the turbulent portion results in an associated steep momentum defect increase from Pi to P2. Since skin friction is largely negligible in a separation bubble, these changes are related by the wake form of the

Transitional separation bubbles

Transitional separation bubbles

Figure 4.34: XFOIL [5] pressure distributions on Eppler 387 airfoil at Re = 100 000 reveal a transitional separation bubble on the upper surface. Experimental data is from McGhee at al [42].

von Karman momentum equation (4.116).

P2 ~ Pi ^ ^ (4.127)

Ue2

where i? avg — 5(Pmax + Pturb) is an average shape parameter over the velocity change interval. Large Hmax values in the bubble will therefore increase Havg and increase the downstream defect P2.

The smallest-possible downstream defect, denoted by P2 in Figure 4.35, is obtained when transition occurs close to laminar separation so that the bubble does not form and Havg stays very low at its turbulent value. The difference

APbubbte = P2 – P2 (4.128)

can be considered to be “bubble drag,” or the drag penalty of the bubble being present.

The excess APbubbie from large Hmax values persists into the far wake and implies a corresponding increase in the overall profile drag D’, referred to as bubble drag. This is the mechanism responsible for the inordinate drag increases experienced by most airfoils which are operated well below their intended Reynolds numbers, which results in strong separation bubble formation.

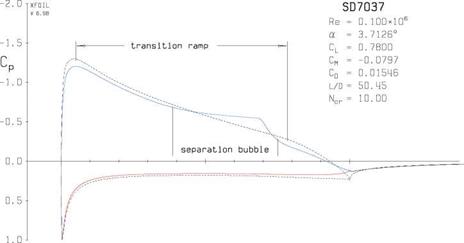
Reducing separation bubble loss APbubbie is one of the major design goals for airfoils at low Reynolds numbers, below 250000 or so. A specific objective is to make Hmax as small as possible and also uei/ue2 as close to unity as possible, while still maintaining the transition point at the ideal location. This is achieved via a suitable transition ramp, which is a region of weak adverse pressure gradient in the inviscid velocity ueiNV (s) ahead and over the bubble, which encourages instabilities but is too weak to produce early laminar separation. Once separation does occur, the weak inviscid adverse pressure gradient also gives a modest H(s) growth in the bubble, so Hmax at transition is modest as well. Furthermore, the longer weak adverse gradient reduces the velocity uei at transition, so that the velocity ratio uei /ue2 is smaller as well. Both effects are seen to decrease the downstream defect P2 in equation (4.127).

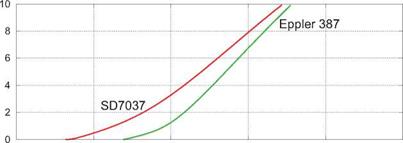
Figure 4.36 shows the SD7037 airfoil with features a transition ramp starting at 5% chord. The result is a 32% drag reduction compared to the Eppler 387 airfoil in Figure 4.34 which has a shorter and steeper

Transitional separation bubbles

Figure 4.35: Transitional separation bubble is produced when laminar separation is followed by transition and subsequent reattachment. The excess momentum defect increase APbubbie due to a large Hmax is a bubble drag penalty.

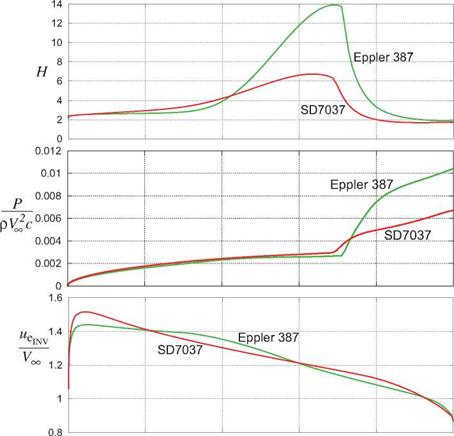
transition ramp starting at 35% chord. The relevant boundary layer parameter distributions for the two airfoils are compared in Figure 4.37. The Hmax value is seen to be smaller for the SD7037. Comparing the Cp(x) distributions between Figures 4.34 and 4.36 reveals that the SD7037 has a noticeably smaller Cp jump between transition and reattachment, so its uei/ue2 ratio is smaller as well.

Transitional separation bubbles

Transitional separation bubbles

Figure 4.36: XFOIL [5] pressure distributions on SD7037 airfoil at Re = 100 000, which features a long transition ramp (weak adverse pressure gradient) starting at x/c ~ 0.05 to reduce bubble loss.

A long bubble ramp requires a reduction in the overall airfoil thickness, which influences the structural merit (maximum spar thickness) and other properties such as cm and off-design performance, making the overall airfoil design problem quite complex. These various design considerations are discussed in more detail in the low Reynolds number airfoil design studies by Drela [43], Liebeck [44], and Selig [45]. Control of separation bubbles using intentional boundary layer trips is discussed by Gopalarathnam et al [46].

Transitional separation bubbles

Transitional separation bubbles

0 0.2 0.4 , 0.6 0.8 1

x/c

Figure 4.37: Upper surface inviscid edge velocity distributions and resulting shape parameter and TS-wave envelope distributions for SD7037 and Eppler387 airfoils. Long and shallow transition ramp in the ue(x) distribution of the SD7037 airfoil produces a smaller maximum H value and a smaller ue decrease over the bubble. The result is a much smaller rise in the momentum defect P past transition at x/c ~ 0.7 for the SD7037 compared to the Eppler387. The SD7037 has 32% less drag as a consequence.
Influence of freestream Reynolds number

Подпись: e(s) where Вею Подпись: /0.45г/ s c Подпись: 0.664 c Подпись: s/c Be ю Подпись: (4.124) (4.125)

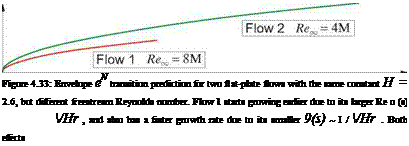
It’s useful to examine the effect of freestream Reynolds number on the transition location as indicated by relation (4.123). Laminar boundary layer theory indicates that the momentum thickness (or any other integral thickness) scales as 9 ~ I / /lie. For example, Thwaites method for a constant //,. = V. gives

Подпись: Re о Подпись: ue9 v Подпись: 0.664 Подпись: (Blasius flow) (4.126)
Influence of freestream Reynolds number

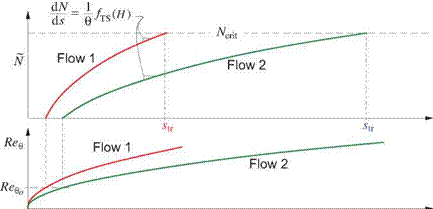
and c is a global reference length such as the chord. Therefore, the N-factor growth rate scales as /Hr via the 1/9 factor which multiplies fTS in (4.121). In addition, the local momentum-thickness Reynolds number in this case is

Influence of freestream Reynolds number Influence of freestream Reynolds number

which affects where the growth begins via the Be$o(H) threshold function. The effects are illustrated in Figure 4.33 for two Blasius flows with different freestream Reynolds numbers. As Reincreases, N(s) starts growing sooner because the larger Re о reaches Re oo (2.6) sooner, and also grows faster because of the smaller 9(s). Both effects contribute to moving transition upstream with increasing Re.

Подпись:s

TS-wave natural transition prediction

Many types of exponentially-growing instabilities can precipitate natural transition. The most common types in 2D-like flows are called Tollmien-Schlichting (TS) waves, which are sinusoidally-oscillating pressure and velocity perturbations within the boundary layer (see Schlichting [12] and Cebeci and Bradshaw [20]). The TS wave perturbations initially have very small amplitudes near the leading edge, usually orders of magni­tude smaller than ue. For unstable waves these amplitudes grow exponentially downstream to levels suffi­cient to trigger transition, roughly a few percent of ue. The ratio of the local to initial TS wave amplitudes is defined as eN, where the exponent N(s) is the so-called “N-factor” which quantifies the instability growth. In the “envelope eN” transition prediction method, the N-factor is computed by an accumulating integral over the upstream surface, much like the P(s) and K(s) defects are accumulated as indicated in Figure 4.8.

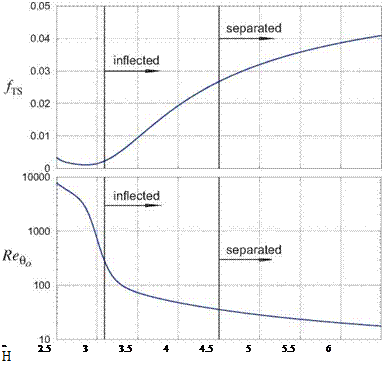
The empirical functions fTS(H) and Rego(H) which determine the IN(s) growth are shown in Figure 4.31. Curve fits are provided by Drela [6]. Transition is assumed to occur at the s location where the N(s) variable reaches a specified critical value Ncrit, which is a measure of the ambient noise or disturbance level.

1.12.4 Influence of shape parameter

For self-similar (power-law) flows, the TS growth rate functions can be used to explicitly determine the Reg value at the transition location, and also the corresponding Rex value.

( — ) = Be. gtr(H, Ncl, t) = Reg0{H) + ^—————- (4.122)

V v Ar dN/dReg (H)

(t2),, ^ = (*««.- t)2 wm)

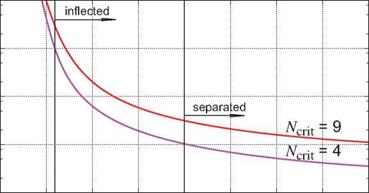
Figure 4.32 shows this Rextr versus the H value of the self-similar flow, for two typical Ncrit values. Note the dramatic sensitivity of the transition location on the shape parameter H. Between the Blasius and incipient-separation flows, H = 2.6 and 4.0, the transition distance is reduced by roughly a factor of 100.

The transition location also depends on the specified parameter Ncrit, which is a measure of the initial TS wave amplitude, or in effect the ambient disturbance level together with some degree of receptivity. Since the initial disturbances must be amplified by a factor of eNcrit to precipitate transition, a large Ncrit value corresponds to a clean flow, and vice versa. Ncrit = 11 or 12 is a typical value in a very clean flow like a sailplane in flight, Ncrit = 9 is appropriate for the flow in a very quiet wind tunnel, while Ncrit = 4 corresponds to a fairly turbulent environment such as in a noisy wind tunnel. Note that e9 ~ 8100 and e12 ~ 163 000, so enormous amplifications are required for TS waves to trigger transition in clean flows.

Подпись: 2 2.5 3 3.5 4 4.5 5 5.5 6 H

1e+07

Подпись: Figure 4.31: TS-wave growth rate fTS = в dN/ds and threshold Reeo for start of growth, versus shape parameter H.Подпись: 1e+06 ^*tr 100000 TS-wave natural transition prediction10000 1000

2 2.5 3 3.5 4 4.5 5 5.5 6

H

Figure 4.32: Transition Reynolds number versus shape parameter H for self-similar flows, as pre­dicted by the envelope eN method for two Ncrjt values. Transition Reynolds number for incipient- separation flow (H = 4.0) is about 100 times smaller than for Blasius flow (H = 2.6).

Transition

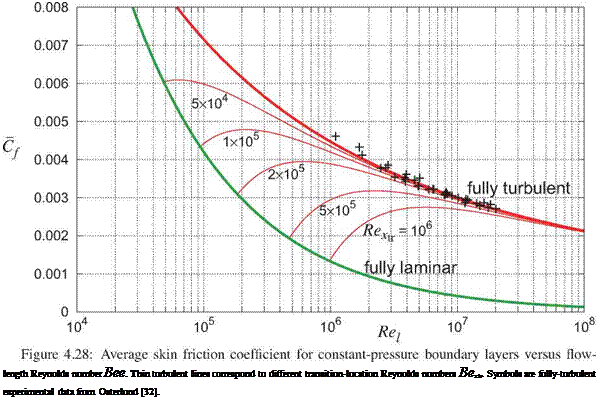
The average skin friction chart in Figure 4.28 indicates that the transition location has considerable influ­ence on the profile drag of an airfoil or body, and often affects maximum lift as well. For boundary layer calculation purposes, the transition point is where a switch is made from a laminar to a turbulent calculation method. It is therefore necessary to determine the transition point in terms of laminar boundary layer quan­tities and other relevant parameters. Since transition prediction is a large field, only a few key results can be given here. See Reed et al [35] for an overview.

1.12.3 Transition types

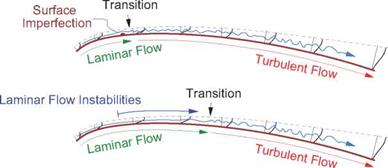
Transition is in most cases initiated by some sort of unsteady external freestream disturbances, or by surface vibration which oscillates the entire flow. How the outside disturbances enter the boundary layer is known as the receptivity problem (see Saric et al [36]). The subsequent mechanisms which make these initial disturbances trigger transition can be grouped into three broad types, shown in Figure 4.30.

TransitionForced Transition

Подпись: Freestream Turbulence, Noise

Подпись: Transition Ї
Подпись: Bypass Transition
Подпись: v_arfi'nar

Natural Transition

Figure 4.30: Main types of transition. [3] [4] [5]

sufficiently strong to enter the boundary layer almost everywhere. Examples are flows found inside turbomachinery. Chaotic turbulent flow in a boundary layer on a turbomachine blade airfoil will begin where the local Reynolds number Reg becomes sufficiently large to allow the turbulence to be sustained. This minimum value is in the range Reg > 150 … 250, depending on the local shape parameter H. The method of Abu-Ghannam and Shaw [39] has been popular for predicting bypass transition, especially in turbomachinery flow applications.

Boundary layer calculation methods

The next most reliable method of profile drag prediction is to actually perform the boundary layer calcula­tions to obtain the far-downstream or KTO. However, this can run into difficulties if a simple classical boundary layer calculation is used, since the ue(s) distribution from a potential solution typically has a very
steep adverse pressure gradient immediately ahead of the trailing edge stagnation point. Consequently the classical boundary layer calculation will fail there due to the Goldstein separation singularity, as discussed in Section 4.12.1. The fully-coupled viscous/inviscid XFOIL and MSES methods avoid these pitfalls by allowing ue(s) to adjust in response to the viscous displacement, which removes the Goldstein singularity.

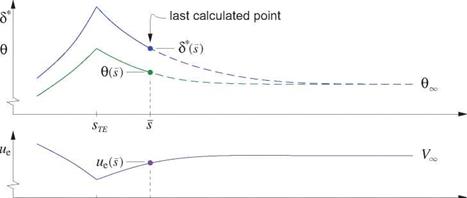
The boundary layer calculation can be stopped at the trailing edge, or continued into the wake if ue(s) is known along the wake. This raises the practical problem of how to determine or dTO from d(s) at the last calculated point X, which may be either at the trailing edge or at the end of a wake of finite length. A suitable method is to use the von Karman equation (4.28) which in the wake simplifies as follows.

– ГТТ, O’ 1 dt;e d ds 1 + ’ ue ds

d(ln d) = —(H + 2) d(ln ue) (in wake) (4.116)

This can be approximately integrated from the last known location s = s to far downstream s if we assume an average value of Havg over this interval. Since H ^ 1 far downstream in an incompressible wake, a reasonable approximation is

tfavg ^ (4.117)

Boundary layer calculation methods Boundary layer calculation methods Boundary layer calculation methods Подпись: (4.118)

so that equation (4.116) then explicitly gives dTO in terms of the known quantities at s.

The relations are diagrammed in Figure 4.29. Equation (4.118) is known as the Squire-Young formula [34], and was originally developed for cases where ss is at the trailing edge, so that the extrapolation is over the entire wake. However, it can be used if s is some distance downstream in the wake, and in fact it then becomes more accurate because the H ~ Havg assumption then gets better.

Подпись: STEПодпись: sПодпись:Boundary layer calculation methodss

The Squire-Young formula is also useful in experiments, where it can be used to extrapolate a measured wake momentum defect near the airfoil to downstream infinity, so that the actual profile drag can be determined from the measurements. This is described in Section 10.4.2.

Local-friction and local-dissipation methods

To determine the physical basis of the form factor, we can compare the wetted-area drag formula (4.110) with the exact profile drag formula (4.40) based on the integral momentum equation.

Sref CDp = Swet Cf Kf (4.111)

SrefCbp = JJ^CfdSwet + Jj6*^dSwet + jj8* ё^аке (4.112)

Подпись: Sref CDp = Cf Local-friction and local-dissipation methods Подпись: (4.113)

Evidently the form factor Kf accounts for the larger local dynamic pressures via the ratio qe/qTO inside the first friction integral in (4.112), and also accounts for the remaining two surface and wake integrals which represent roughly the pressure drag. Clearly, Kf represents fairly complex flow physics, and consequently has been resistant to being reliably estimated from only potential-flow quantities via first principles. For example, one might attempt including a local dynamic pressure in the wetted area integral

but this will significantly under-predict the drag for most bodies of finite thickness.

Подпись: Sref CDP Local-friction and local-dissipation methods Подпись: + Local-friction and local-dissipation methods Подпись: (4.114)

Sato [13] has made some progress in simple profile drag estimation by employing the profile drag formula as related to the kinetic energy equation (4.49), which can be written as follows.

Noting that the dissipation coefficient cv is very insensitive to pressure gradients (much less so than Cf), we can interpret Kf as a measure of the average peu)i/pTO V3 ratio over the surface and the wake. This leads to a fairly reliable profile drag estimation formula

#

3

-^%dSwet (4.115)

which has the same form as (4.113), but with a local peu^ weighting rather than peu^. This still has the great simplicity of requiring only potential-flow velocities to be integrated over the surface. The ratio between cv and Cf, and the additional contribution of the wake dissipation, have all been lumped into the Cf factor, by the requirement that the formula give the correct result for the flat plate. Additional refinements can be made by splitting the integral between the laminar and turbulent portions as appropriate.

Sato [13] has shown that the profile drag predictions of formula (4.115) are reliable to within a few per­cent for flows which do not have trailing edge separation. He has also introduced modifications for wall roughness, and also for compressibility which gives good results up to weakly transonic flow.

Profile Drag Prediction

The prediction of profile drag Dp can be performed using a number of different approaches. These are presented in the subsequent sections in order of increasing accuracy and also increasing cost and complexity.

1.12.2 Wetted-area methods

The so-called wetted-area methods are based on the drag of a zero-thickness flat plate with a constant freestream edge velocity, ue — V^. In this case there is no pressure drag, so that the profile drag consists entirely of friction drag which can be conveniently given in terms of an average skin friction coefficient Cf based on the freestream dynamic pressure qto.

Dp —

Tw dS — QTO Swet Cf

(flat plate)

(4.102)

=

1 T/2

2

(4.103)

Cf (Beg) =

1 fe

– J^ Cf(x) da:

(4.104)

Here, £ is the streamwise length of the boundary layer flow, which also defines the streamwise-length Reynolds number Beg. The wetted area Swet is defined as the surface area in contact with the moving fluid, which for the flat plate is twice the planform area. The average skin friction coefficient is obtained

Profile Drag Prediction

These Cf functions are shown in Figure 4.28. The added transition-location term in (4.107) is based on the formulation of Schlichting [12], and depends on the transition-length Reynolds number Bextr.

For bodies other than flat plates, the profile drag is assumed to be given by

Dp

— Qto Swet Cf Kf

(4.109)

Dv

Swet –

or

Dp а Я f

to ret

= – w^CfKf

Sret

(4.110)

where Kf > 1 is an empirical form factor which depends on the shape of the body, and possibly also on the angle of attack and Mach number. Hoerner [33] gives extensive data for form factor values for a variety of 2D and 3D body shapes.

The main shortcoming of the wetted-area profile drag estimate (4.109) is that it’s not really predictive, but is in effect a means of experimental drag interpolation or extrapolation via the assumption that the form factor Kf does not change much over the range of body shapes being considered. If modifications in the
body shape change Kf in some unknown way which is not accounted for, then the resulting profile drag predictions for the modified body shapes will be inaccurate. In other situations where novel or unusual body shapes are being examined and drag data is not available, then the necessary Kf values must be guessed and the resulting drag estimates become uncertain.

Viscous/inviscid coupling

The solution failure at separation is traceable to the neglect of the viscous displacement mechanism. In brief, there is one unique value of due/ds which is admissible by the boundary layer at the separation point, so this value cannot be imposed via the input ue(s). The problem is eliminated if the displacement effect is incorporated into the potential flow problem, which is termed viscous/inviscid coupling. The boundary layer flow can now influence the potential flow’s ue(s) distribution, and can thus enforce the requirement of the unique due/ds value at the separation point.

A practical consequence of incorporating a viscous displacement model into a potential flow calculation is that now the potential and the boundary layer flow problems are two-way coupled, as diagrammed in

Figure 4.27. Specifically, the potential and boundary layer problems now depend on each other and cannot be solved in the simple sequential manner of the classical case diagrammed in Figure 4.26.

Viscous / Inviscid Flow Problem for ф(Г), e(s), 8*(s)…

wall BC

p дф/bn = dm/ds

і V—————— 1

Boundary layer equations m ODEs in e(s), 8*(s), Ue = дф/ds

Подпись: Potential flow equations дф R>s У2ф = 0 —!

A possible solution approach is to iterate between the potential and boundary layer equations, as suggested by the dotted arrows in Figure 4.27, which is known as direct viscous/inviscid iteration. This is not satis­factory since it tends to be unstable, as analyzed by Wigton and Holt [29]. The boundary layer problem will also fail outright if separation is encountered. Other iteration schemes have been proposed, such as the one by Veldman [30] and LeBalleur [23], with various degrees of success. The most reliable approach has been to solve the inviscid and viscous equations simultaneously by the Newton method. The XFOIL [5] and MSES [6] codes are two 2D implementations of this approach. Example results have been shown in Figures 3.6, 3.7, 4.9, 4.10. An example of simultaneously-coupled 2D viscous and 3D inviscid methods is the TRANAIR code, as reported by Bieterman et al [31].

Figure 4.27: Two-way coupling between potential-flow equations and boundary layer equations occurs if a displacement model is incorporated into the potential flow problem. The direct vis – cous/inviscid iteration suggested by the dotted arrows will fail if separation is present. A simulta­neous solution of all the equations is most effective at avoiding this solution failure.

Coupling of Potential Flow and Boundary Layers

1.12.1 Classical solution

The classical boundary layer problem is schematically shown in Figure 4.26. An inviscid (potential) flow problem is first solved with the displacement effect ignored. This then provides the edge velocity ue(s) distribution which is the input to one of the boundary layer solution methods presented in this chapter. The outputs are the various viscous variables of interest, 6(s), S*(s), Cf (s), etc.

Coupling of Potential Flow and Boundary Layers

Figure 4.26: One-way coupling from the potential flow problem to the classical boundary layer problem. The boundary layer solution fails if separation is encountered.

Although conceptually simple, this solution approach has two shortcomings:

1. The potential flow solution ignores the viscous displacement effect. Hence it cannot predict the grad­ual loss of lift as stall is approached, which is illustrated in Figure 3.8. Also, if the displacement effects are large, then the specified ue(s) is inaccurate and the resulting boundary layer solution and predicted profile drag are suspect.

2. If the specified ue(s) leads to separation, the boundary layer solution will fail at that point, and sub­sequent downstream integration is impossible. This behavior was already observed for self-similar laminar flows, which have no solution for a < -0.0904 which is the incipient-separation case. For a general (not power-law) flow, there is also no solution at the first streamwise location where sep­aration is encountered. This occurs with finite-difference and two-equation integral methods, and is known as the Goldstein separation singularity [28]. The consequence is that the boundary layer solu­tion cannot proceed downstream into the separated flow region. Ironically, the simpler one-equation methods do not have this singularity, essentially because their physics modeling is too inadequate to represent it. This is not really an advantage, since they become wildly inaccurate or problematic in other ways once separation is indicated. For example, if A < -0.09 in Thwaites’s method, which roughly indicates separation, its closure functions become undefined.