Category Helicopter Test and Evaluation

Test methodology

An ideal frequency sweep comprises a continuous, constant-amplitude sinusoidal control input at progressively increasing frequency. The characteristics of a good

image133

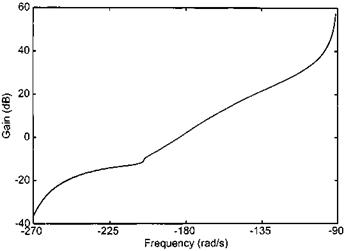
Fig. 5.22 Presenting frequency response data: Nichols chart.

image134

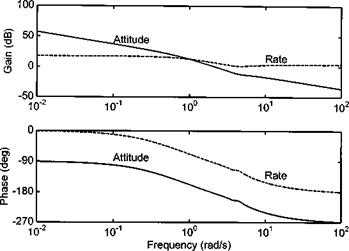
Fig. 5.23 Frequency response of attitude from angular rate test data.

frequency sweep, and the techniques that should be employed to achieve them, are detailed below.

5.6.2.1 Amplitude

Ideally the frequency sweep should be made using a constant amplitude control movement. It is very easy for the pilot to inadvertently increase input amplitude as frequency increases. This is often due to the greater forces that are required to overcome viscous damping effects in the control linkage. Increased amplitude at high frequency should be avoided as it may cause structural damage to the airframe. The use of two hands on the cyclic helps as do high bandwidth, fast-acting control position indicators. A mechanical device similar to a ‘two-way control fixture’ may also be used but there is a risk of squaring off the input peaks (with consequent corruption of the frequency spectrum) if the control is allowed to actually touch the fixture.

Frequency response characteristics

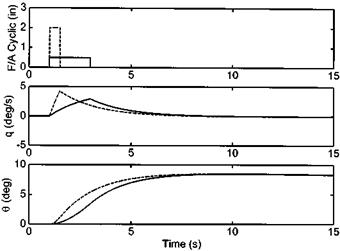
Before describing frequency domain testing methodology, it is necessary to discuss the conceptual background to the subject. When required to control a rotorcraft using single discrete inputs experienced pilots can compensate for attitude and rate delay by making a larger input initially (‘boosting’) and by ‘backing-off’ early or leading. The boost over-drives the aircraft response by generating a higher acceleration (although this will be limited by the control power available) and the lead allows the aircraft to settle at the desired attitude by removing the over-large input before its full effect can be realized, see Fig. 5.19. The dotted line shows the response of a typical helicopter to a large amplitude/short duration pulse and compares it to a more gentle input of lower magnitude but lower duration. Notice that in both cases the attitude change obtained is the same but the application of ‘lead’ has resulted in the target attitude being obtained some 5 seconds sooner. However when performing high-gain flying tasks, such as target-tracking, precision hovering or deck-landings the pilot will often

image130

Fig. 5.19 Quickening the response by over-driving the control input.

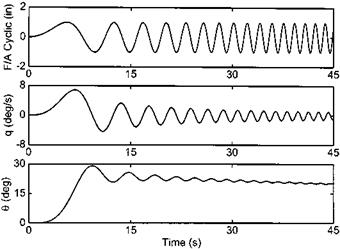
need to make continual small inputs to keep the aircraft on the desired flight path. In these situations, he may not be able to compensate adequately for excessive time delay since in trying to boost and lead he may find himself ‘out-of-phase’ with the aircraft. Consider the pitch response of a typical helicopter resulting from a constant amplitude frequency sweep, Fig. 5.20. After the initial gross attitude change (t > 10 s) note that as the input frequency is increased two effects are seen: the output (pitch rate or pitch attitude) changes in magnitude and it lags further behind the input. The qualities of gain and phase and their variation with input frequency are fundamental in shaping pilot opinion for high-gain handling tasks. Although presenting these trends in the

image131

Fig. 5.20 Time history of a frequency response test.

image132

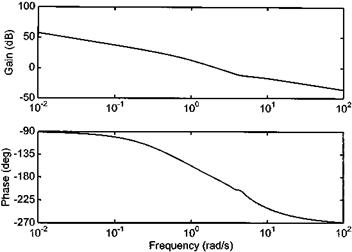
Fig. 5.21 Presenting frequency response data: Bode plot.

form of time histories makes it easier to visualize them, this form of presentation is not conducive to detailed analysis or specification compliance testing.

Two methods of presenting frequency response information are commonly used: the Bode plot and the Nichols chart. These diagrams, originally developed for use in filter and other electronic component design, have found a place in handling qualities testing as the importance of frequency response characteristics has been realized. Nowadays they are not only convenient means of documenting these characteristics but are also used for detailing handling quality specifications [5.2 and 5.6]. The Bode plot consists of two charts with input frequency as the independent variable and either gain (ratio of output to input) or phase lag as the dependent variable, see Fig. 5.21. The Nichols chart presents both gain and phase information simultaneously, Fig. 5.22. Both formats result from a spectral analysis of time histories similar to those shown earlier.

It is important to consider what constitutes the most appropriate output for both spectral analysis and requirements specification. When the pilot moves the pitch/roll inceptor he will normally be targeting an attitude change and therefore the most obvious output for analysis would seem to be attitude. Indeed as shall be seen later attitude bandwidth is an important specification parameter. Experience has shown, however, that for good quality results it is necessary to use attitude rate in the spectral analysis process since there is usually a better spread of energy across the tested frequency range. After processing, it is a simple matter to reduce the gain by 20 dB/ decade and add the extra 90° phase lag associated with generating attitude from the integral of rate, see Fig. 5.23. This is usually a perfectly valid process provided the attitude excursions are not too large.

FREQUENCY DOMAIN METHODS FOR CONTROL RESPONSE ASSESSMENT

When the handling qualities research that formed the background to the LHX programme and led to ADS-33E [5.2] was conducted the traditional methods of quantifying control response were found deficient. It became clear that the frequency response of the helicopter was of greater importance, for certain flying tasks, than its response in the time domain. Indeed it was found that pilots flying rotorcraft with vastly different step response characteristics (natural frequency and relative damping) but identical frequency response characteristics would give similar handling quality rating for tasks that required frequent small control inputs. More precisely Hoh [5.5]

Table 5.2 Large amplitude response requirements.

Attitude command

Rate response types

response types

Achievable angular rates (deg/s)

Achievable angle (deg)

Level 1

Levels 2 & 3

Level 1

Levels 2 & 3

Agility category MTE

Pitch Roll

Yaw

Pitch

Roll

Yaw

Pitch Roll

Pitch

Roll

Limited agility Hover Landing Slope landing

+ 6 +21

+ 9.5

+3

+ 15

+5

+ 15 +15

+ 7

+ 10

Moderate agility Hovering turn Pirouette

+ 20

Vertical manoeuvre Depart/abort Lateral reposition

+ 13 +50

+ 22

+6

+ 21

+9.5

-30 +60

+ 13

+ 30

Aggressive agility Vertical remask Acceleration-deceleration

+ 20

Sidestep

Target acquisition and tracking Turn to target

+ 30 +50

+ 60

+ 13

+ 50

+ 22

+ 30 + 60

-30

+ 30

found, when conducting simulated deck-landing tasks, that pilot opinion remained unchanged for configurations with relative damping between 0.5 and 1.3. Later analysis showed that the common factor in all the configurations tested was the similarity in bandwidth or the range of input frequencies useable by the pilot.

Manoeuvre quickness

Before discussing how manoeuvre quickness is assessed it is perhaps worth reviewing the meaning of this relatively new handling quality parameter. Padfield reported [5.4] that efforts to resolve task portrait information with pilot commentary on handling

image122

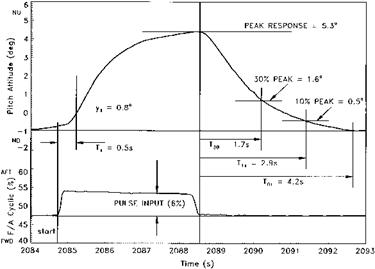
Fig. 5.13 Pulse response test data.

qualities led to a realization that there was a range of control strategies for which neither bandwidth specifications (see the section on frequency analysis, Section 5.6) nor large amplitude specifications (see Section 5.5.4) were suitable. Either the input frequencies were too low or the task did not demand the use of the maximum angular rates available.

When developing the new parameter, that eventually became known as manoeuvre (or attitude) quickness, it was felt that it needed to correctly reflect the varying degrees of aggression with which the pilot could perform a specified flying task. During extensive trials, in both ground based and airborne simulators, it was noted that when pilots were asked to perform a manoeuvre requiring a discrete flight path or position change, such as a lateral side-step for example, each attitude change could be associated with a particular peak angular rate, see Fig. 5.14.

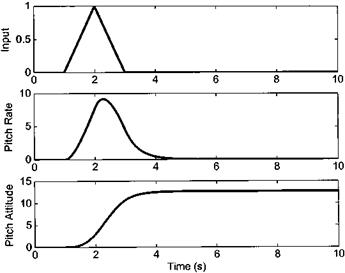
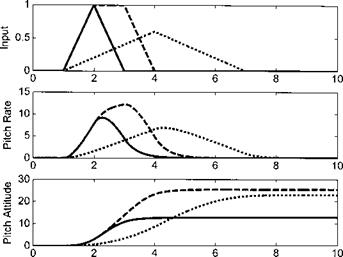
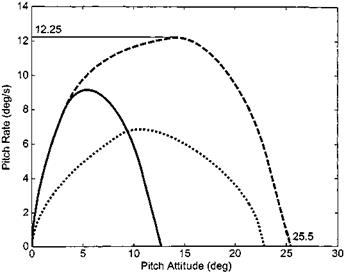
When pilots were asked to fly the manoeuvres more aggressively, or with more attack, it was found that the attitude changes were achieved with larger angular rates by the use of larger control inputs held for shorter periods of time. Referring to Fig. 5.15, note that two of the inputs portrayed result in broadly similar attitude changes: in both cases the helicopter attitude has been changed by approximately 25°. One trace shows the result of a 3-second pulse involving full control deflection whereas the other trace results from a 6-second pulse to 50% control travel. Clearly the first input is more aggressive than the second and this is characterized by a peak angular rate that is approximately twice as great. If a phase portrait is constructed for the manoeuvre, see Fig. 5.16, the difference in aggression is evidenced by the area under the curve (the greater the area, the higher the task aggression).

In developing manoeuvre quickness it was decided to use a parameter akin to frequency so that it would fit with the bandwidth criteria developed for control tasks requiring much smaller control inputs. In this way a more coherent scheme of handling qualities specification was achieved. The frequency parameter was obtained by dividing

image123

Fig. 5.14 Trace of a discrete attitude change.

image124

Time (s)

Fig. 5.15 Trace of attitudes changes with differing aggression.

the magnitude of discrete attitude changes into the peak rate achieved during those changes.

In practice the assessment of the manoeuvre quickness characteristics of a helicopter is similar to pulse response testing although it is more common to analyze the effects of a series of control inputs rather than a single one. Typically the time history is obtained whilst executing a multi-axis task that requires the pilot to make inputs of

image125

Fig. 5.16 Phase portraits of attitude changes.

image126

image127

image128

Fig. 5.17 Acceleration/deceleration test data.

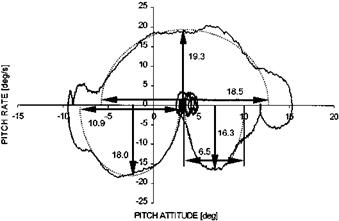
varying sizes at varying rates. Examples include flying a slalom course, executing an accel-decel (see Fig. 5.17) or NOE flight. Time histories of appropriate control, attitude and angular rate are then analyzed (as in Fig. 5.18). Discrete attitude changes and the peak rate generated during such changes can be identified and processed to produce

image129

Fig. 5.18 Generating manoeuvre quickness data.

values of manoeuvre or attitude quickness. Acquiring data suitable for specification compliance will involve incremental increases in the aggression with which the manoeuvres are flown. Typical aggression metrics are time taken to fly the course or maximum attitudes used during the manoeuvres. If the aircraft is capable of generating manoeuvre quickness in excess of that specified for a particular role or range of flight tasks it will be deemed to have Level 1 handling qualities.

5.5.4 Large amplitude manoeuvres

Large amplitude manoeuvre testing is required by ADS-33E [5.2] and involves exploring the maximum capabilities of the rotorcraft. In Table 5.2, example specifica­tion requirements are listed. It is evident that to generate the required angular rates or attitude changes large inputs will need to be made by the pilot. Full control deflections, more typical of fixed wing flying, may be required, therefore it is obvious that such testing will have to be approached incrementally using an appropriately instrumented airframe.

Pulse inputs

Unlike step response testing, the pulse input is specifically mentioned in the Ministry of Defence Standard 00-970 [5.1]. It is quoted as a suitable test technique for evaluating the transient response characteristics of rotorcraft whose handling qualities are affected by the incorporation of sophisticated stability and control augmentation systems. Although the assessment of augmented rotorcraft is the subject of a later chapter in this book it is pertinent to include pulse inputs here. Since the pulse input has the advantage of returning the control inceptor to its trimmed position any ensuing response will be dictated by both the underlying stability characteristics of the helicopter and the action of any automatic control system. In practice the input will be similar to the release-to-trim technique described earlier although since the magni­tude of the peak response is a specification compliance parameter a control fixture is often used and the test approached in the same incremental manner as step response testing.

The desired response to a pulse input is specified using a set of quantitative data equivalent to the control response parameters introduced above. These include the peak response, the time required for the flight parameter to make a first pass through the datum (T01), the time for a second pass in the sense of the original disturbance (T02) and the time to return to datum (TF). The rate of return to datum, the size of any overshoots and the tolerance of datum re-capture are all specified using fractions of the peak response. Thus (T30) and (T11) are the times taken for disturbance to reduce to 30% and 10% of the peak response. For responses that are oscillatory, unlike the dead-beat response portrayed, the magnitudes of the first and second overshoots (x1 and x2) are typically set at 15% and 10% respectively for Level 1 handling qualities and the tolerance for datum capture (xF) at 10%. The initial part of the pulse, or ‘boxcar’, input is also a means of assessing the control response of the helicopter. Therefore the rate of onset of the pilot-induced ‘disturbance’ is also specified. This is achieved by requiring that the response (y1) exceed a certain percentage of the peak response within a given time of the input being made (T1). Figure 5.13 shows an example time history of a pulse input and subsequent dead-beat response.

Step response

The step input is a popular method of determining the control response characteristics of a helicopter. It involves trimming the rotorcraft in to the hover or in straight and level flight at a given airspeed and then making a pure step input using the appropriate control inceptor. In forward flight, pitch and roll inputs are made, whereas in the hover due to the differing response characteristics it is possible to make yaw inputs as well. Test data can be gathered in a rudimentary fashion using manual techniques although it is commonplace to use either on-board automatic data recording or telemetry as the primary data source. With this in mind, the test technique has evolved to one that maintains flight safety by using manually recorded data, regardless of the on-board or telemetry system adopted, to ensure an incremental increase in the severity of the aircraft manoeuvre. This method also allows factoring of pilot opinion on the difficulty of recovery into the choice of the next increment to test.

Since most unaugmented helicopters will achieve steady rates within two seconds of the input being made it is usual to hold it for the count of two and then initiate recovery. In this way the recovery action becomes part of the test and the pilot will automatically restore the aircraft to the trim condition at the end of the count unless, of course, a self-declared limit is likely to be transgressed beforehand. Control response testing using step inputs can be conducted in a low-risk, incremental manner provided a set routine is performed The routine adopted at ETPS, shown in Table 5.1, is an example of the recommended methodology. Whatever the precise routine adopted, test teams must treat changes to the direction of input with great care. There is always the possibility that having made several aft inputs the pilot will have so conditioned himself that he pulls the control inceptor aft even though the next test point requires a movement forward!

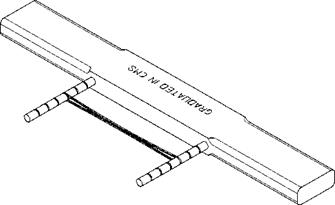
A control fixture, see Fig. 5.9, is a common means of ensuring that a step input of a pre-determined size is made. The fixture provides a rigid surface against which the control inceptor may be held thereby enabling pure step inputs. The requirements of flight safety normally require that the fixture be held in place manually by a flight test observer situated at the co-pilot station. Consequently this test method can only be used on helicopters fitted with dual controls. Alternatives to the fixture include injecting discrete control inputs via the automatic flight control system. Care is taken to avoid off-axis inputs (the introduction of lateral cyclic during longitudinal control

Table 5.1 Control response testing.

Non-handling pilot or observer

Handling pilot

Trim aircraft to required flight condition ‘On condition’

Sets fixture for next input size ‘ The next input will be 1 cm aft’ Appropriately orientates fixture and shows fixture to pilot

Glances at fixture ‘ Confirmed’

Positions fixture next to control inceptor

‘In position’

‘Stand by for a 1cm aft input on the count of three, are you ready’

Checks that fixture is still in place and correctly orientated ‘Ready’

Glances across the cockpit to ensure that fixture is correctly orientated

Notes actual input size and whether input held against fixture

‘1001, 1002, 1003 – moves inceptor – 1004, 1005, recovering’

Notes attitude at 1004 and 1005

Plots attitude at 1 and 2 seconds against input size on ‘how-goes-it’ chart, chooses next input size

Restores aircraft to required flight condition and reads back attitudes

image119

Fig. 5.9 A control fixture.

response testing for example). Using only the hand or fingers to make the input rather than moving the whole arm can facilitate this. The control is held rigidly against the fixture until the desired results have been achieved or recovery is necessary. A build­up technique is employed using progressively larger inputs so that the testing can be terminated early should any untoward trends develop. Control cross-coupling may be evaluated by observing the response in other axes. The use of telemetry or a near real-

image120

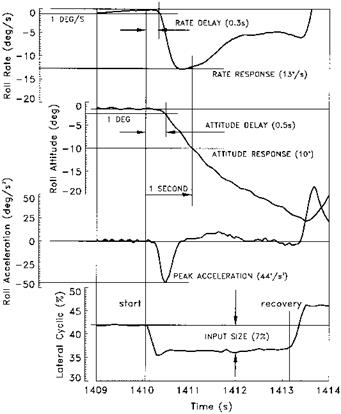
Fig. 5.10 Definition of control response parameters.

time display of input shape is often used so that a poor input shape can be recognized quickly and the test condition repeated immediately.

The control response characteristics of a rotorcraft are characterized using a standard set of control response parameters, see Fig. 5.10. These parameters are based on the assumption that the helicopter has a first-order rate response to control inputs. The attitude and rate responses are, respectively, the aircraft attitude and angular rate achieved one second after the input. The attitude and rate delay quantify the time taken for the helicopter to change attitude by one degree and generate an angular rate of one degree per second. The steady-state rate and peak angular acceleration are self­explanatory. A useful parameter for comparing the control response of different helicopters is the control sensitivity, which is the maximum angular acceleration achieved for a standard input size (1 cm or 1 inch).

Figure 5.10 highlights a typical problem in estimating steady-state angular rates. Due to the effect of sideslip it is unusual for rotorcraft to acquire a steady roll rate. Since the magnitude of the steady-state rate is only used in comparison with the rate response to judge the crispness of the control response, this phenomenum does not usually present the test team with much of a problem. In the figure it is clear that the aircraft reaches a peak rate within one second. This peak rate approximates to the
steady rate that would have been acquired if the helicopter truly behaved as a first – order system. Therefore the steady rate and rate response can be stated as being equal and the control response characterized as ‘crisp’.

Having gathered a set of traces and analyzed them in the manner shown in Fig. 5.10 it is possible to construct a set of summary charts to portray the control response characteristics. There are two categories of derived plots that are used to summarize control response data. One is the variation of control response parameters with airspeed: any or all of the control response parameters (rate response, attitude response, control sensitivity, steady-state rate) may be plotted against airspeed for a given input size. Alternatively the variation of control response parameters with input size for a given flight condition may be presented, see Fig. 5.11. In each case the pilot would expect some progression in response. For example, at a given speed a larger input should yield a larger, ideally proportional, response, whereas the pilot would expect a given input size to yield a larger response at a higher speed. An abundance of quantitative data can be taken from response time histories. In discussing control response it is important that the parameters chosen and presented support the pilot’s qualitative opinion. Parameters that define the ‘amount’ of the control response are

0 1 Input (cm)


Step response

Fig. 5.11 Control response test data.

the rate response, the attitude response, and the steady-state pitch rate. Quantities which can be used in discussing the quality of the response or ‘how’ it got to the observed steady-state rate are the delay time, the initial angular acceleration, the time to steady state, and the inflection time.

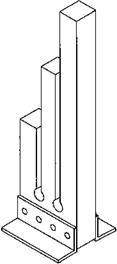
When conducting manual step response testing there are several flight safety points to consider. Ideally visual confirmation of the input size (fixture setting) and input direction should be made before commencing the cadence count. Although this is easy to accomplish in a side-by-side cockpit, the test team will need to consider carefully how this might be achieved in a rotorcraft with a tandem cockpit configuration. Modern attack helicopters tend to have the cockpit stations optimized for pilot and co-pilot/gunner. This usually involves differences to the control inceptors in terms of location, force-feel and possibly gearing (the AH-1 Cobra is a good example). Such differences require careful consideration when establishing the procedure for in-flight testing. In addition to using an in-flight plot or ‘how-goes-it’ chart to track the approach to a limiting parameter, other visual indicators can be used. Large cyclic control deflections will typically reduce the clearance between the main rotor tip-path plane and the fuselage. An appropriately located set of ‘chicken-sticks’, see Fig. 5.12, which are designed to break if struck by a rotor blade, can warn of impending mishap. Ideally such devices will be located within the pilot’s field of view so that he can confirm easily if the clearance has reduced to hazardous dimensions. Should this not be possible then the sticks are modified to include an electric circuit that will illuminate a suitable warning lamp in the cockpit if they are broken. The development of small proximity sensors of suitable accuracy has enabled a more sophisticated approach giving a greater range of information and warning.

Step response testing may require the employment of large inputs that could lead to aircraft damage if performed without due care. The following additional precautions are typical of those adopted to minimize this risk:

image121

Fig. 5.12 ‘ Chicken-sticks’.

• Awareness of the effects of manoeuvre instability during aft inputs that may lead to an unexpected ‘dig-in’ and possible overstress of the airframe or rotor system.

• Careful monitoring of the approach to limitations and the use of an appropriate ‘how-goes-it’ chart.

• Anticipation of possible series actuator saturation and a consequent sudden increase in aircraft response when testing augmented aircraft.

• Careful briefing and practise to ensure that the entire crew is aware of the control input size, direction and recovery action.

Adverse yaw/proverse yaw/heading delay

Cyclic-only turns are also conducted to determine the adverse yaw or proverse yaw characteristics, whether any heading delay is apparent and whether the aircraft possesses the capability to perform co-ordinated turns with no pilot input on the pedals. The technique consists of TO1C-C initiated from a ball-centred or zero-sideslip wings-level attitude accomplished with lateral cyclic displacements of various rates consistent with the role of the aircraft. Collective remains fixed and airspeed is maintained with longitudinal cyclic. The heading, the sideslip and the yaw rate response to the control input are noted. A roll out of the turn onto a predefined heading at role-relatable roll rates is often attempted to qualitatively evaluate the ability of the pilot to select a desired heading within narrow tolerances.

5.5 TIME DOMAIN METHODS FOR CONTROL RESPONSE TESTING

The purpose of control testing in the time domain is to evaluate the dynamic modes of the aircraft using inputs that although generated in a very stylized manner represent in some way the control strategies commonly used by pilots. Typical inputs include steps and pulses. Since these inputs have been used for many years as means to determine the control response characteristics of rotorcraft, specific handling quality specification requirements exist which are based on these test methods. More recently as a result of the handling qualities research conducted during the LHX programme (the forerunner of the RAH-66 Comanche) the concept of manoeuvre quickness has been introduced [5.3]. Since testing to gather quickness data is an extension of the pulse input technique [5.4], it is discussed below.

Lateral/directional oscillation

Lateral/directional oscillation (Dutch roll) characteristics are documented by first accurately trimming the rotorcraft in level flight at the desired airspeed and altitude. A lateral/directional oscillation is then excited by using any of the following methods: a release from a SHSS; a lateral cyclic, yaw pedal or collective pulse input; a lateral cyclic step input; or a lateral cyclic or yaw pedal doublet. The release from a SHSS is accomplished by returning all controls to trim simultaneously with rapid ramp control inputs. The control pulse and doublet inputs are typically conducted using a 2-3 cm displacement with a period of 1 second for cyclic inputs and 2 seconds for yaw pedal inputs. All controls remain fixed following the control input and the open loop response of the aircraft is documented.

5.4.2 Spiral stability

Подпись: tr Lateral/directional oscillation Lateral/directional oscillation

It has already been shown that spiral stability is dependent on the sign of the expression (LvNr — LrNv), positive being stable. Now consideration of the equations of motion for TO1Cs, both pedal and cyclic, yields:

For a turn to starboard, r is positive and N0tr and Lv are both negative. The sign of 9tr depends on the sign of (LvNr — LrNv): when the bracketed expression is negative, 9tr is positive. This implies that the control deflection and the yaw rate are in opposite directions since positive 9tr implies left pedal. Alternatively, if (LvNr — LrNv) is positive, 9tr will be negative, implying that the control deflection and yaw rate will be in the same direction (to the right). Also, inspection of the equations indicates that, as Nv is positive and LAi is negative, if (LvNr — LrNv) is positive, cyclic deflection and yaw rate are in the same direction Thus, the control deflection required to maintain a steady turn on one control can be used as a direct indication of the helicopter’s spiral stability: if the pedal or cyclic has to be deflected into the turn (right pedal/cyclic for right turn), the aircraft is spirally stable; alternatively if the control has to be deflected out of the turn, the helicopter is spirally unstable. It is worth noticing that, although the derivatives vary with speed, altitude and configuration, Lr is usually small, so (LvNr — LrNv) is often positive and helicopters are usually spirally stable at modest angles of bank.

The spiral stability test is usually conducted by flying a TO1C-C as these are generally easier to perform than TO1C-P Longitudinal inputs are used to hold airspeed constant throughout the test. When the helicopter is stabilized at the desired bank angle, the cyclic is smoothly returned to the level flight trim value and a time history of the ensuing bank angle is recorded. During testing, inputs are made in a manner that minimizes excitation of the lateral/directional oscillation. It is normally of interest to evaluate an IFR bank angle (20°) and also to try and find the angle at which spiral stability becomes neutral or even negative.

Specification requirements

Natural frequency and relative damping requirements for the longitudinal long-term mode vary with pilot attentiveness. As might be expected a more heavily damped mode is required if the pilot’s attention is divided between the flying task and other

image118

Fig. 5.8 Dynamic stability requirements (ADS-33).

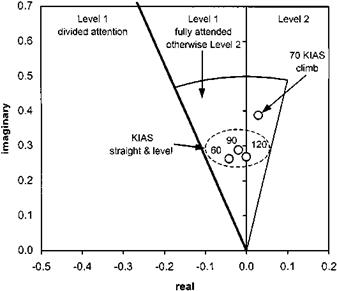
duties. Figure 5.8 compares longitudinal long-term mode data from a light singled – engined helicopter with the requirements of ADS-33E [5.2]. Notice that if the pilot is fully engaged in attitude and flight path control (definition of full-attention) the aircraft has Level 1 handling qualities (as defined in Section 5.7.1). However, as soon as his attention is divided the low level of relative damping confirms Level 2 handling qualities. Ministry of Defence Standards take a different approach by assuming that the pilot will either be actively monitoring the performance of an AFCS or flying under autopilot control whilst more fully involved in ancillary duties. In each case a minimum acceptable time is specified before the pitch attitude can vary by more than 1 degree.

Methods of excitation

Having trimmed the aircraft as accurately as possible in the desired flight condition, the long-term response is excited using one of the methods detailed below. The magnitude of any artificial excitation should be chosen to give a response which is representative of that occurring naturally. Excessive excitation may lead to an unrepresentative response because the pilot may often have to intervene before the motion has developed. As a general rule, the smallest excitation which produces a significant oscillatory response or a divergent aperiodic response is used.

(1) Natural turbulence. The effect of imperfect trim conditions or natural turbulence may be sufficient to excite an aperiodic or lightly damped oscillatory response. Such initiation of the long-term response is desirable in that there can be no doubt that the excitation method is representative. However, these responses are usually contaminated by subsequent atmospheric disturbance before the motion is complete and it may be impossible to extract meaningful quantitative data. Nevertheless, natural turbulence does provide the opportunity to qualitatively evaluate the difficulty of suppressing the long-term response under representative conditions.

(2) Release to trim. If there is a benign response to natural turbulence then verification of such a desirable aircraft characteristic is usually made using artificial excitation. Equally a pilot generated disturbance may be required if the level of turbulence is insufficient to generate a meaningful response from the aircraft. Often the best method is to accelerate or decelerate from the trim airspeed and then to smoothly release the controls back to their trim positions. The controls may then be left free (but monitored) until recovery action, or the suppression of an off-axis response, becomes necessary. A speed increment of 5-15 knots is used for this method.

(3) Pulses. Longitudinal cyclic or collective pulses may also be employed to verify any lightly damped or aperiodic long-term response obtained from natural turbulence. Unless of extreme magnitude and direction (that is virtually a release to trim), pulses typically provide insufficient excitation to initiate a long-term response which is well damped, especially in forward flight.