Category Management and Minimisation of Uncertainties and Errors in Numerical Aerodynamics

. Equidistant Reduction Method

The TAU deformation module also contains this method to reduce the number of base points. It tries to select the base points Xs spatial-evenly distributed from the point set Xinp. This is managed by iteratively finding the right minimal distance dmin to possible neighboring base points, to get as close as possible to the maximal number of desired base points ns, max. Neighbors with a distances less than dmin are rejected during this process. Due to performance issues, it is using an octree data structure to find the neighbors closer than dmin to a specified base point. Figure 4 sketches one iteration step of the algorithm.

The result is having evenly distributed base points. But choosing the base points like this does not take into account the deformation vectors Axinpii or interpolation errors.

Base Point Reduction Methods

The number of base points ns has a major influence on the performance of the radial basis function interpolation algorithm. The needed (direct) matrix inversion depends on the third power of ns and the interpolation of the grid points depends linearly on the base point number. If the tool is used for the coupling of a structural finite elements (FEM) grid to a computational fluid dynamics grid, the number of input base points will be equal to the number of surface grid nodes of the FEM-grid. The common number of surface nodes of these grids is way too large to use them all for the RBF grid deformation and still having satisfactory runtime results. So the reduction of the base points is indispensable for the mesh deformation module.

The reduction of the base points is not the only way to increase the efficiency of radial basis function interpolation methods. Other possibilities are, for example, multilevel approaches combined with base point reduction [9] or partition of unity approaches like in [12]. The multilevel approach uses a base point set hierarchy to start the interpolation at a coarse level and then refining it progressively. The partition of unity approach breaks the large problem down to several small ones by partitioning the base points into neighbor sets.

A useful attribute of the radial basis function interpolation approach is that no connectivity information of the input base points is needed. To conserve this char­acteristic the reduction algorithms do not use connectivity information as well.

Fig. 4

Wall Distance Module

The mesh deformation module presented in section 2 uses the distance of the grid points to the closest group boundary for the weighting of groups and for the blend­ing of deformations. The wall distances control the influence of different boundary groups on the deformation of a specific volume grid node.

There are different approaches for the computation of wall distances, for example based on partial differential equations, as seen in [11], based on a clever merging of the boundary points [13], or just a naive brute force algorithm, which compares each boundary node with every volume mesh node. The presented method, which was adopted from DLR’s TAU preprocessor, uses another algorithm. In TAU the wall distance is used for the application of certain turbulence models. The method is, like the mesh deformation module, embedded into an independent module for the simulation environment FlowSimulator.

The algorithm uses an advancing frontier approach. Every grid node n gets an additional parameter xnear [n], which saves the coordinates of the currently nearest boundary node. Then in every iteration step, each node compares the distance to its xnear-entry with the xnear values of its neighboring nodes and where required updates the xnear-value with a better value from a neighbor. Since the boundary nodes have the correct solution directly at the beginning, the solution for xnear for each node moves into the field node by node.

This so-called advancing front algorithm makes it possible that for certain (struc­tured) grids it would take only a few iteration steps to advance the correct solution for xnear into the interior of the grid.

Multivariate Interpolation Using Radial Basis Functions

The radial basis functions approach is a well-established interpolation method for gridded and scattered data, whereas the most natural context for function approxim­ation is given for scattered data [5, p. 99], [4, p. 4]. In the field of computational fluid dynamics (CFD) it is often used for coupling CFD-grids to finite element structure grids.

The input data in d dimensions consist of data locations xi, merged into the data­set

X = {X1,X2,…,Xn}e Rd, (1)

and the corresponding function values

fi = f(Xi) e R, i = 1,…,n. (2)

The data locations xi are called centers or "base points".

The goal is to interpolate the function values between the base points by an ap- proximant s : Rd ^ R to satisfy the condition

s|x = f x. (3)

Подпись: I|X||2 Подпись: (4)
Multivariate Interpolation Using Radial Basis Functions

In this specific case s is a linear combination of shifted radially symmetric basis functions ф. Radially symmetric means that the value of ф(-) depends only on the distance of the argument to the origin, hence it is often written ф (11 ■ 11). The distance norm is usually the Euclidean norm (with d = 3)

з (x) has the general form

3(x) = ^агф (Ух-x;||). (5)

i=1

Setting s(xi) equal to fi for all i n} leads to the linear system

Ay = b (6)

Подпись: A = (ф (IIxJ - xk ||))( J,k) = 1,..,n > Подпись: У =(ai )i=1, n> Подпись: b = (fi)i=1, Подпись: n Подпись: (7)

with

A unique interpolant is usually (for most ф) guaranteed, if the base points are all distinct and there are at least two of them [3, p. 6]. An example for a radial basis function could be ф (||x||) = ||x||2log ||x||, which is called "thinplate spline".

An important attribute of this interpolation method is the possibility to expand the approach of equation (5) by adding a polynomial to the definition without losing the uniqueness of the coefficients. For function values f, which show a polynomial character, the appended polynomial improves the interpolation quality. The only restriction is that the polynomial must have a degree m > 1 and is non-zero at all base points. This leads to:

n

Подпись: (8)s (x) = ф(||x – x!)+ p(x).

i=1

The coefficients can be computed by solving

n

s (x) = £a^(||x – x*||) + p(x)= fi (9a)

i=1

0 = ^atq (xi) V q: deg(q) < deg(p) (9b)

i=1

The extra equation (9b) takes up the extra degrees of freedom given by the poly­nomial coefficients, to allow a unique interpolant. The uniqueness can be guaran­teed, if ф is "conditionally positive definite". It is referred to [5, p. 101] for more details to the theory of this topic.

Again, the requirements on X are not very strong. For a linear polynomial, X must only contain four base points, which do not lie on a plane. Furthermore, if the function values fi at the base points were generated by a linear function, they would be reproduced exactly by the linear polynomial. [4, p. 5]

In the following the dimension is set to d = 3 in this document. Since x = (xx, xy, xz), the polynomial is linear and can be written as

So equations (9) can be abstracted to matrix notations

Hy = b, (11)

Multivariate Interpolation Using Radial Basis Functions Multivariate Interpolation Using Radial Basis Functions Подпись: (12) (13) (14) (15) (16)

with

Solving (11) provides in b the coefficients to use (8) for the interpolation of arbitrary points. The matrix H will be called "interpolation matrix" below, although it is only used to calculate the interpolation coefficients.

The module presented is not independent of cell connectivity, since wall dis­tances of the nodes to certain boundary groups are used. The algorithm to com­pute the wall distances relies on connectivity information to determine neighboring nodes. But, it is important to note that the base points xsi, i = 1,ns do not need any connectivity information.

Solutions for the indicated performance factor "interpolation matrix size", which directly depends on the number of used input deformation vectors, will be shown in section 4. That section contains different methods to reduce the number of base points and deformation vectors.

The basic interpolation functions of the module are taken from DLR’s flow solver TAU. They have been applied successfully at DLR and Airbus to many test cases.

2.1 Algorithm

The interpolation algorithm is based on a group-weighting and a deformation­blending approach.

A group-weighting approach is used to allow the independent movement of dif­ferent model parts/boundaries in the grid. Otherwise the deformations of different boundaries could influence each other and unintentional surface deformation would be the result. Separating the interpolation by group protects the shape of the different bodies. Therefore, the interpolation matrix Hg of each group g has to be computed

and applied to the grid nodes separately. Finally, the deformation result for each grid point is calculated by a weighted average of each group-deformation result.

The deformation-blending approach supports the protection of boundary layer cells and the usage of radial basis functions ф(||х||) with limits ф(||х||) ^ ™ for ||x|| ^ «>. These radial basis functions, which increase with increasing distance to the base point of a deforming body, need to be restricted farther away from the sur­face of this body. Otherwise local deformations would influence the whole mesh. Additionally, the added polynomial of the interpolation approach (8) would deform the whole volume mesh as well. Consequently, this approach that is implemented to recover linear deformations exactly, cannot be used without the blending of deform­ation values.

Hence, the notations are expanded by an elevated group index g for ng groups. As input data there are ng base points xg i e R3 for each group g merged into the datasets

Xsg ={ 4, 2 4, ng} for g = І.–> ng. (17)

The function values that are going to be interpolated, are the deformation vectors

Подпись: Axg, i = Ax (4, iAXg;X

Axff e R3 for i = ng, g = 1,..,ng, (18)

AXg’ZJ

Подпись: x^ . new,i Подпись: xg,i+Axg,i for i Подпись: 1,..., ng, g = 1,.., ng. Подпись: (19)

which could be used to compute the displaced coordinates xgew i of the base points:

But the aim of the deformation module is to update the mesh nodes and not the base points.

A difference to the function values fi in equation (2) to the function values Axg i is their dimension. Section 2.1.1 only deals with one-dimensional function values while in this case the function values are three-dimensional. Therefore each coordin­ate of the mesh nodes has to be interpolated separately. It is advantageous that the interpolation matrix Hg in (11) has to be computed only once for each boundary group instead of computing it for each dimension separately, since the matrix de­pends only on the base points xsg and the chosen radial basis function ф. So the interpolation matrices Hg for each group can be stated as:

Подпись: (20)Hg = H (Xg, ф).

For each dimension k e {x, y, z} the interpolation coefficients ag, k = ( ag’j g

i=1,..,ng

and eg, k = Шп., verting equation (11):

Multivariate Interpolation Using Radial Basis Functions

i=1,..,4

Подпись: dxvi Подпись: {dK,i Лх1{ d^ ^ Подпись: (22)

The actual interpolation algorithm calculates the deformations of the grid nodes

Multivariate Interpolation Using Radial Basis Functions Multivariate Interpolation Using Radial Basis Functions Подпись: ,g Подпись: 1,..,ng (23) (24) (25) (26)

for the volume mesh grid nodes xv, i by using the distance dg to the nearest surface of group g. For every coordinate k e {x, y,z} the governing equations are:

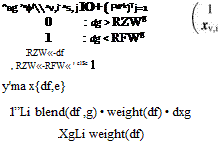
Two new functions have been introduced: the blending function blend( ) and the weighting function weight( -). The weighting function averages the individual group deformations. Because its limit for ds —r 0 is infinity, it needs a cut-off value I / v7£ for numerical reasons.
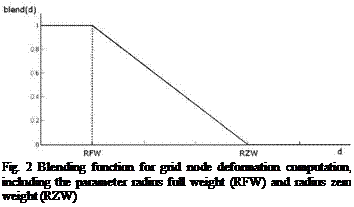
Подпись: Fig. 2 Blending function for grid node deformation computation, including the parameter radius full weight (RFW) and radius zero weight (RZW)
The blending function is sketched in figure 2. With its group-parameters RZWg (Radius Zero Weight) and RFWg (Radius Full Weight) it is controlling the deform­ation of the grid nodes. If a grid node is close to a boundary of group g with a distance less than RFWg, it will move approximately like the boundary. This func­tionality can be used to conserve the sensitive boundary layer part of a grid. Farther away from the boundary with a distance dg > RZWg the deformation is zero.

Multivariate Interpolation Using Radial Basis Functions

(a) Overall view (b) Zoom view

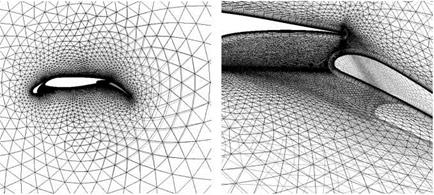
Fig. 3 2d test case, wing including flap and slat. Each of the 3 parts is an independent deform­ation group and only the flap has input values unequal to zero (undeformed: black, deformed: grey)

An example for independently deforming groups can be seen in figure 3. It shows that the surface mesh of the rigid main wing body is not affected by the deformation of the nearby moving flap. The radius zero weight can be recognized in figure 3(a), too.

The algorithm is also described shortly in [6]. This paper also provides test cases showing the usefulness of the presented group-weighting approach and the quality conserving capability of the methodology.

Several different boundary type dependent algorithms have been developed to simplify the usage of standard cases often applied to CFD meshes for aircrafts:

• Standard Boundary Type. This is handled as described above. Deformation vec­tors have to be provided for this surface type.

• No-Normal-Movement Boundary Type. All surface points on this boundary are allowed to slide on the surface. The movement in surface normal direction is suppressed. It’s used for example for symmetry planes.

• Far-field Boundary Type. Here the deformation is set to zero.

• Attached Group Boundary Type. This treatment conserves the shape of an at­tached device, e. g. an engine mounted on a deforming wing.

Radial Basis Functions in Mesh Deformation

Deformation methods based on RBF-interpolation are independent of the volume mesh and flow solver type, because the algorithm is working on completely arbit­rary clouds of points without using any connectivity information. Additionally, for the mesh updates of consecutive optimization steps or an unsteady aeroelastic sim­ulation, only a matrix-vector multiplication is necessary for each mesh node. The computationally most expensive part is to compute the interpolation matrix for this multiplication. It can be calculated once in the beginning of the entire simulation and remains unchanged, since it only depends on the base points, but not on the deform­ation vectors. Consequently, the method can be perfectly parallelized (using MPI and partitioned grids), because each process has to apply the interpolation matrix only to its own grid nodes. But it is also clear that the dimension of the interpolation matrix highly influences the overall speed of the algorithm.

CFD Mesh Deformation Module

The deformation module "FSDeformation" has been developed for the simulation environment FlowSimulator [1]. It is based on an implementation of the mesh – deformation module presented in [6] using the radial basis function (RBF) inter­polation approach. This approach is extended by the feature of specifying groups of different boundaries with separate interpolation functions and a blending func­tion, which restricts the deformation to a specified zone around these boundaries. Both features are controlled by the distances d of the mesh nodes to the group target boundaries. The distances are calculated by the wall distance module (section 3).

More details about the deformation module, for example concerning parallel per­formance and interpolation quality, can be found in [10].

Improved Mesh Deformation

Holger Barnewitz and Bernd Stickan

Abstract. An improved, robust, error reducing CFD-mesh deformation module for the parallel simulation environment FlowSimulator is presented. The mesh deform­ation method is based on radial basis function interpolation for the surface – and volume- mesh nodes combined with a group-weighting and displacement-blending approach. Since the latter weighting and blending approaches are based on given wall distances to the group surfaces, another module for the wall distance compu­tation is introduced. Due to performance reasons, the number of input data loca­tions (base points) used for the radial basis function interpolation must be limited. Therefore, methods have been developed to reduce the number of base points while keeping the interpolation error as low as possible. Furthermore, the modules have been parallelized for usage in multi-node high performance computing clusters. Fi­nally, the capability of a multidisciplinary, parallel application is demonstrated in FlowSimulator with reduced errors and uncertainties.

1 Introduction

Airbus strategy to essentially move much more towards simulation makes it indis­pensable to know about any uncertainties and deficiencies in the predictive capabil­ities used for aerodynamic development. Knowing about error bands, their quantity and having in hand some means to manage and minimize their influence on the predicted results could tremendously help in the development process, reliable op­timization of the product, shortening of development time and cost.

Holger Barnewitz • Bernd Stickan AIRBUS Operations GmbH,

Airbus-Allee 1, D-28199 Bremen

e-mail: {holger. barnewitz, bernd. b.stickan}@airbus. com

B. Eisfeld et al. (Eds.): Management & Minimisation of Uncert. & Errors, NNFM 122, pp. 219-243. DOI: 10.1007/978-3-642-36185-2_9 © Springer-Verlag Berlin Heidelberg 2013

Improved Mesh DeformationThe MUNA project is an essential brick within the Airbus strategy of flight phy – sics/aerodynamics focusing on providing adequate tools for numerical qualification of aerodynamic design during concept phase. Respectively qualified CFD is expec­ted to form the single basis for judgement of aerodynamic status before entering concentrated high level wind tunnel testing – to be ready for next new aircraft de­velopment. In addition, MUNA is contributing to support aerodynamic data process change towards "more simulation, less testing".
The contribution described in the following sections focuses on CFD mesh de­formation used in the context of numerical aerodynamic shape optimization and shape design including static wing deformation. Major topics are:

• New mesh deformation module "FSDeformation" with advanced methods and integration into FlowSimulator [1]

• Geometry parametrization with a link between CAD (CATIA V5) and mesh deformation

• Use of mesh deformation for aerodynamic shape optimization

• Application of mesh deformation in a CFD/CSM coupled iterative process

• Combining shape design and CFD/CSM coupling in a multi-disciplinary optim­ization

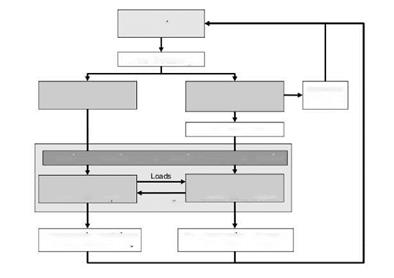
A typical multi-disciplinary optimization (MDO) process chain for shape optimiza­tion of a wing including the static deformation is shown in Fig. 1. An essential brick is the mesh deformation tool which is applied to:

1. reflect the changed shape design generated by a parametric CAD model,

2.

Подпись: Optimiser

deform the wing according to aerodynamic (and other) forces.

Подпись: Mesh Generation or Deformation Подпись: Beam Stick Generator Подпись: Structure Weights

New Geometry

Improved Mesh Deformation

New Beam Model

Fig. 1 Multi-disciplinary optimization chain for wing shape and structure weight

The advantage of using mesh deformation for unstructured grids is manifold:

• It avoids the problem of numerical noise for the calculated aerodynamic coeffi­cients which might occur if new meshes are created for slightly changed geomet­ries. This "noise" is caused by the change of mesh topology. Mesh deformation conserves the topology and small geometry variations produce small mesh de­formations in a continuous way.

• A so-called restart capability of the flow solver allows to start from a flow solu­tion calculated beforehand to save computing time.

• Usually, deformation of an unstructured CFD mesh is faster than re-generating a new mesh, and thus also saves computing time.

Mesh deformation plays a key role in aerodynamic shape optimization, since any adjustment of the model geometry has an impact on the 3D CFD-mesh. Because CFD-simulations usually rely on spatial discretization based on volume-meshes, these have to be updated if a CAD surface changes its location or its shape. The costs for the generation of new meshes should be as low as possible but should also produce usable grids even for large local changes in the model geometry. There are several possible ways to update the mesh, e. g. the complete re-meshing of the complete grid or the deformation of an existing grid.

For unstructured meshes, re-meshing would certainly change the topology of the mesh. Since the discretization in 3D space is generally not dense enough to pro­duce a mesh-independent flow solution, the newly generated mesh would produce a slightly different flow field not caused by the geometry change. This leads, espe­cially in the case of shape optimization, to noise in the aerodynamic coefficients, which often significantly disturbs the shape optimizer. Furthermore, the computa­tional cost for re-meshing of unstructured grids is very high. Hence, mesh deforma­tion is an essential tool in this area of computational fluid dynamics:

• the topology of the mesh remains unchanged and

• small geometry variations correspond to small changes of the numerically de­termined aerodynamic flow field.

Coupled Simulations

In order to assess the influence of the projection method on the actual coupled solu­tion, steady aeroelastic simulations were performed with the ACM in conjunction with the flow solvers FLOWer and TAU. Two different configurations were used. The scaled HIRENASD wing with the structural shell model depicted in Fig. 9 is representative for a real-world transport aircraft wing. The flow conditions were chosen according to a test case defined in the project MEGADESIGN [20] for the optimisation of an aircraft cruise configuration. The flight speed is Ma = 0.82 at standard atmospheric conditions in 11 km altitude. These amount to a Reynolds number of Re = 43.2 x 10⁶ and a loading factor of q/E = 0.144 x 10~6. This value is the ratio of the free-stream dynamic pressure and Young’s modulus of the struc­ture and is a dimensionless number that characterises aeroelastic coupling effects. The second test configuration employed is the HIRENASD wing in its original size and the beam structural model displayed in Fig. 11 representing the structure of the actual wind tunnel model. Results are shown here for the conditions of the experimental polar 250 [4]: Ma = 0.80, Re = 23.5 x 10⁶ and q/E = 0.48 x 10~6. In both test cases, the dummy fuselage was not taken into consideration. Identical CFD meshes were scaled to match both configurations. The block-structured mesh for FLOWer is the volume mesh from which the already-presented wetted surface with 31245 points was extracted and has about 2.8 million points. The hybrid – unstructured mesh for TAU has 12.6 million points and a wetted surface with 188983 points. Only results obtained with the FIE and MLS methods are compared.

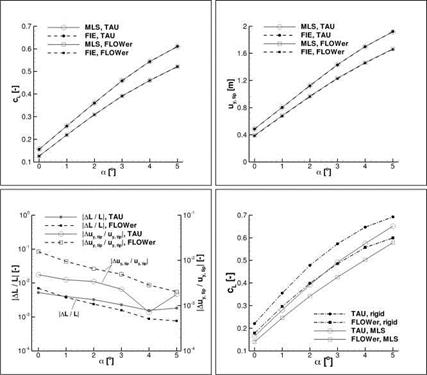
In Fig. 14, the results for the transport aircraft wing configuration are presented. With the MLS method, quadratic interpolation functions were used with nFB = 2 and NM = 67. In the top diagrams, the lift coefficients and the flap-wise bending deflections at the wing tip are plotted over the angle of attack. For both magnitudes the same observation can be made: The projection methods deliver very similar dis­tributions with the same flow solver, but between the results of FLOWer and TAU there is a difference of around 15%. In the bottom left diagram the relative errors in lift and deflection are given. The influence of the projection method is singled out; the deviations between the flow solvers are not shown. The relative error in the tip deflection Auy tip/uy tip| is greater than the values obtained in the previous tests (see Fig. 12). During actual coupled simulations the differences between the projection methods affect the structural load distribution as well as the shape of the deformed

Coupled Simulations

Fig. 14 Results of aeroelastic simulations for the scaled HIRENASD wing and the IFL structural shell model at Ma = 0.82, Re = 43.2 x 10⁶, q/E = 0.144 x 10—6 and 0° < a < 5°. Computations were carried out with FLOWer and TAU coupled with the ACM. FIE and MLS were used as projection methods. In all examples the LEA k — о turbulence model and a central differences discretisation in space were applied. top left: Lift polars. top right: Flap – wise tip bending deflections. bottom left: Relative errors in lift coefficients and in bending deflections between the projection methods. The comparisons are only carried out between the distributions obtained with the same flow solver. bottom right: Lift polars disregarding aeroelastic deformation superimposed on those obtained with MLS. In a departure from the previously shown results, these were obtained with the scaled HIRENASD wing with dummy fuselage.

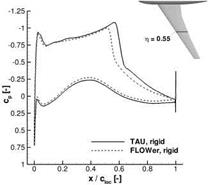
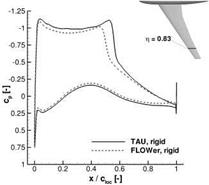
wetted surface and then feed back to the aerodynamic load distribution of the next coupling iteration. The deviations are still inside engineering limits, though, ranging between one per cent and one per mil. In the bottom right diagram, the lift distribu­tions obtained by "pure” CFD disregarding aeroelastic deformations are addition­ally provided. Already here the differences are apparent between the flow solvers (These results were obtained for the scaled HIRENASD wing with dummy fuselage, hence the lift coefficients considering aeroelastic deformation are slightly higher than in the top left diagram). In Fig. 15, local pressure distributions at the spanwise
positions n = 0-55 and n = 0-83 are picked out for an angle of attack of a = 3°. In the undeformed configuration TAU predicts a shock position further downstream than FLOWer by about 5% of the local chord length. The higher structural bend­ing moment must then lead to an aeroelastic equilibrium configuration with larger deformations. The differences between the flow solvers are thus aggravated by the aeroelastic coupling. This test case is entirely generic and there are no experimental data that would allow an evaluation of these differences.

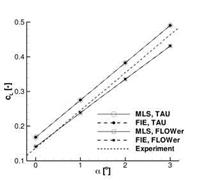
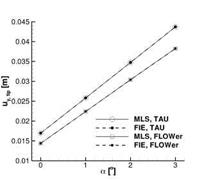
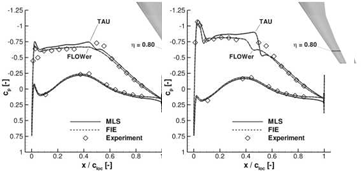
An extensive experimental data base is available for the HIRENASD configura­tion. Here the same tendencies as with the previous configuration are to be observed, as can be gleaned from Fig. 16. The deformation distributions and the lift polars also coincide well for the projection methods, but there are significant differences between the results of the flow solvers. Measured lift coefficients are superimposed with the simulation results, but do not give a clear direction. Fig. 17 contains cal­culated and measured pressure distributions for the two highest angles of attack a = 2° and a = 3° at the spanwise stations n = 0-32, n = 0.59 and n = 0-80. The local pressure coefficients by the MLS method and by the FIE method with identical flow solvers coincide excellently, but significant differences between the flow solv­ers persist. The higher global lift coefficients achieved with TAU are reflected in the higher suction plateaus and shock positions further downstream. For the current test case, predictions with TAU appear in better agreement with the experiments than the FLOWer results, at least at the inboard sections. At n = 0.80 neither solver cor­rectly captures the gradient at the downstream end of the plateau and its height is overestimated using TAU. Admittedly, the presented simulations do not capture the aerodynamic influence of the dummy fuselage on the flow field about the wing.

Coupled Simulations Coupled Simulations

The differences between the results of FLOWer and TAU are presumably caused by the flow meshes or the numerical parameters used at CATS, and are not related to

Fig. 15 Pressure distributions obtained with FLOWer and TAU without consideration of aeroelastic deformation at two spanwise stations of the scaled HIRENASD wing with dummy fuselage. Inflow conditions are Ma = 0.82, Re = 43.2 x 10⁶ and a = 3°.

Coupled Simulations Coupled Simulations

Fig. 16 Results of aeroelastic simulations for the HIRENASD wing with a structural beam model at Ma = 0.80, Re = 23.5 x 10⁶, q/E = 0.48 x 10_6 and 0° < a < 3°. left: Lift polars. right: Flap-wise tip bending deflections.

the aeroelastic coupling. Further efforts to narrow down the cause of the differences remain to be made, but are outside the scope of the current paper.

5 Conclusion

In this paper, the spatial coupling methods for reduced structural models in the ACM were examined. The existing method for the projection of loads and deformations between the wetted surface and the structure based on FIE was outlined together with the interpolation schemes additionally required for beam models. The altern­ative methods MLS and GSB and their implementation in the ACM were explained in detail. For the individual steps of the spatial coupling procedure potential error sources were identified. Several test configurations of increasing complexity were used to investigate the importance of the mesh resolutions of the wetted surface and of the structure on the structural load distribution and the resulting deformation field. Only for thin-walled structural models, a significant influence was detected. It manifests itself as local "bumps” on the structure and, after deformation projection, also on the wetted surface. The projection parameters of the FIE, MLS and GSB methods were investigated; their effect on the shape of the deformed wetted sur­face was determined with two variants of the HIRENASD configuration with and without dummy fuselage and a structural beam model. With the FIE method, only localised effects were apparent in the vicinity of kinks of the beam axis and intersec­tions between assemblies. Here, additional interpolation schemes assure a smooth and contiguous deformed wetted surface. Otherwise, FIE does not rely on interpol­ation parameters. With MLS and GSB, interpolations are not acting locally, but the projection as a whole is cast as a spatial interpolation problem. (Yet in practice, local interpolations cannot be foregone completely, as without projection results are

Подпись: a = 2.0C

Coupled Simulations

a = 3.0°

Fig. 17 Measured and computed chordwise pressure distributions for the HIRENASD wing with a structural beam model at Ma = 0.80, Re = 23.5 x 10⁶ and q/E = 0.48 x 10_6.

unsatisfactory in intersection regions between assemblies.) The MLS method ex­hibited a low overall dependency on the choice of projection parameters. With the GSB method, the shape of the deformed wetted surface was significantly influenced by the position and number of interpolation support points. By means of coupled simulations with the ACM, and either FLOWer or TAU as flow solvers, the practical
applicability of the MLS method was shown. The differences between the lift po- lars, deformation distributions and local pressure distributions obtained with MLS and with FIE and identical flow solvers were small. However, in the results achieved with identical projection methods but different flow solvers, significant differences were apparent. These were linked to the flow solvers, respective the input data used, and not to the aeroelastic coupling procedure. Ongoing work on the spatial coupling in the ACM concerns the extension of the FIE method for volume and shell elements to configurations comprising multiple assemblies.

Acknowledgements. Computing resources were provided by the RWTH Aachen University Center for Computing and Communication and supported by the German Research Founda­tion under GSC 111 (AICES).

Comparison of the Projection Methods

The projection methods FIE, GSB and MLS were applied to similar configurations and at least a tentative comparison of their relative merits is possible. The projec­tion mechanism of the FIE method is completely in line with beam theory in regions

Table 1 Memory consumption and execution time of the ACM with the available projection methods. Runs were carried out on a single 3.0 GHz Intel Xeon processor. The memory requirements include the storage of the system matrices and the solver workspace.

Configuration

HIRENASD wing with 31245 surface points, beam model with 653 structural elements

Scaled HIRENASD wing with 31245 surface points, shell model with 9352 structural ele­ments

Projection method

FIE

MLS

GSB

FIE

MLS

Duration of first coupling iteration [s]

3.40

3.47

258.84

204.88

86.29

Duration of subsequent coupling iterations [s]

0.06

0.05

1.45

0.86

0.80

Peak total memory requirement [MByte]

38.8

135.0

1617.6

1727.1

1740.3

where the beam axis is straight and does not have intersections. For the investigated test configuration, this region is the outboard part of the wing. In the vicinity of the beam kink the choice of the projection parameters Діть and dljmit has a moderate in­fluence on the local shape of the deformed wetted surface. Correct or optimal values for either are hard to ascertain, and the default values are the results of experience. Approximate values for the width of the intersection region aljmit can be determ­ined by common sense, but the choice has a more profound effect on the shape of the wetted surface. While not shown here, fundamentally the same behaviour re­garding alimit can be expected for the MLS method. This method has the advantage that the number of support points n$ and the radius of the additional support points rFB can be varied over a large range with only marginal effects on the shape of the deformed wetted surface, independently of the polynomial order of the interpola­tion function. Compared to the FIE results the deformation distributions are slightly smeared during projection. Further differences to the FIE results are visible in the vicinity of kinks where the FIE method does not present a valid absolute reference either. Finally, the GSB method exhibits the strongest dependency on the choice of projection parameters. A high polynomial order of the global contribution to the in­terpolation function is beneficial, as it should already represent the deformation field as well as possible. The local RBF contributions have to make up for the difference between the supplied deformation distribution and its global approximation, so that the placement and number of supports bear a special importance.

From the user perspective, any projection method should not only be robust and deliver accurate results, but also have low computational resource requirements. The FIE method needs the least memory because in the implementation used in the ACM it does not store the projection matrix explicitly. The MLS method does so, but the resulting matrix is sparse. Discounting additional entries due to inter­polation in intersection regions, the number of non-zero entries is nCFD x N$ = nCFD x NM x (nFB +1). With the GSB method though, the projection matrix is dense and the number of non-zero entries is the product of nCFD and the total number of support points. It is also the method associated with the greatest numerical effort. In Table 1, typical run-times and peak total memory requirements are summarised for the test cases treated in Chapters 4.1.3 and 4.2. With the shell model, the memory requirements are dominated by the structural system and preconditioning matrices. The overhead for the explicit storage of the projection matrix of the MLS method is not significant, as opposed to the beam model test case.