Category MECHANICS. OF FLIGHT

Lift, drag and pitching moment of an aerofoil

Now the ultimate object of the aerofoil is to obtain the lift necessary to keep the aeroplane in the air; in order to obtain this lift it must be propelled through the air at a definite velocity and it must be set at a definite angle of attack to the flow of air past it. We have already discovered that we cannot obtain a purely vertical force on the aerofoil; in other words, we can only obtain lift at the expense of a certain amount of drag. The latter is a necessary evil, and it must be reduced to the minimum so as to reduce the power required to pull the aerofoil through the air, or alternatively to increase the velocity which we can obtain from a given engine power. Our next task, therefore, is to investigate how much lift and how much drag we shall obtain from different shaped aerofoils at various angles of attack and at various velocities. The task is one of appalling magnitude; there is no limit to the number of aerofoil shapes which we might test, and in spite of thousands of experiments carried out in wind tunnels and by full-scale tests in the air, it is still impossible to say that we have discovered the best-shaped aero­foil for any particular purpose. However, modern theoretical methods make it possible to predict the behaviour of aerofoil sections. Such methods can even be used to design aerofoils to give specified characteristics.

In wind-tunnel work it is the usual practice to measure lift and drag separ­ately, rather than to measure the total resultant force and then split it up into two components. The aerofoil is set at various angles of attack to the airflow, and the lift, drag and pitching moment are measured on a balance.

The results of the experiments show that within certain limitations the lift, drag and pitching moment of an aerofoil depend on –

(a) The shape of the aerofoil.

(b) The plan area of the aerofoil.

(c) The square of the velocity.

(d) The density of the air.

Notice the similarity of these conclusions to those obtained when measuring drag, and in all cases there are similar limitations to the conclusions arrived at.

The reader should notice that whereas when measuring drag we considered the frontal area of the body concerned, on aerofoils we take the plan area. This is more convenient because the main force with which we are concerned, i. e. the lift, is at right angles to the direction of motion and very nearly at right angles to the aerofoils themselves, and therefore this force will depend on the plan area rather than the front elevation. The actual plan area will alter as the angle of attack is changed and therefore it is more convenient to refer results to the maximum plan area (the area projected on the plane of the chord), so that the area will remain constant whatever the angle of attack may be. Now we use the symbol S, for the plan area of a wing, to replace the frontal areas, which we used when considering drag alone in the previous chapter.

In so far as the above conclusions are true, we can express them as formulae in the forms –

Lift =

cL-

IpV2.

S or CL. q

. S

Drag =

Co-

1 ру1 ‘

, S or CD. q

. s

Pitching moment =

CM

• IpV2

• Sc or CM.

q. Sc

Since the pitching moment is a moment, i. e. a force X distance, and since IpV2. S represents a force, it is necessary to introduce a length into the equa­tion – this is in the form of the chord, c, measured in metres.

The pitching moment is positive when it tends to push the nose upwards, negative when the nose tends to go downwards.

The symbols CL, CD and CM are called the lift coefficient, drag coefficient and pitching moment coefficient of the aerofoil respectively; they depend on the shape of the aerofoil, and they alter with changes in the angle of attack. The air density is represented by p in kilograms per cubic metre, S is the plan area of the wing in square metres, У is the air speed, in metres per second, c the chord of the aerofoil in metres; the method of writing the formulae in terms of IpV2, or q, has already been explained in Chapter 2.

Aerofoil characteristics

The easiest way of setting out the results of experiments on aerofoil sections is to draw curves showing how –

(a) the lift coefficient,

(b) the drag coefficient,

(c) the ratio of lift to drag, and

(d) the position of the centre of pressure, or the pitching moment coefficient,

alter as the angle of attack is increased over the ordinary angles of flight.

Typical graphs are shown in Figs 3.13, 3.15, 3.16 and 3.17. These do not refer to any particular aerofoil; they are intended merely to show the type of curves obtained for an ordinary general purpose aerofoil.

In Appendix 1 at the end of the book, tables are given showing the values of CL, CD, L/D, position of the centre of pressure, and CM, for a few well – known aerofoil sections. The reader is advised to plot the graphs for these sections, and to compare them with one another (see example Nos. 98 to 101 in Appendix 3). In this way the reader will understand much more clearly the arguments followed in the remaining portion of this chapter.

It is much more satisfactory to plot the coefficients of lift, drag and pitching moment rather than the total lift, drag and pitching moment, because the coef­ficients are practically independent of the air density, the scale of the aerofoil and the velocity used in the experiment, whereas the total lift, drag and moment depend on the actual conditions at the time of the experiment. In other words, suppose we take a particular aerofoil section and test it on dif­ferent scales at different velocities in various wind tunnels throughout the world, and also full-scale in actual flight, we should in each case obtain the same curves showing how the coefficients change with angle of attack.

It must be admitted that, in practice, the curves obtained from these various experiments do not exactly coincide; this is because the theories which have led us to adopt the formula lift = CL. ypV2 . S are not exactly true for very much the same reasons as those we mentioned when dealing with drag – for instance, scale effect and the interference of wind-tunnel walls. As a result of the large number of experiments which have been performed, it is possible to make allowances for these errors and so obtain good accuracy whatever the conditions of the experiment.

Now let us look at the curves to see what they mean, for a graph which is properly understood can convey a great deal of information in a compact and practical form.

Movement of centre of pressure

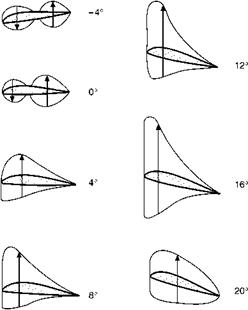
Pressure plotting experiments also show that as the angle of attack is altered the distribution of pressure over the aerofoil changes considerably, and in con­sequence there will be a movement of the centre of pressure. The position of the centre of pressure is usually defined as being a certain proportion of the chord from the leading edge. Figure 3.11 illustrates typical pressure distri­bution over an aerofoil at varying angles of attack. In these diagrams only the lift component of the total pressure has been plotted – the drag component has hardly any effect on the position of the centre of pressure. It will be noticed that at a negative angle, and even at 0°, the pressure on the upper surface near the leading edge is increased above normal, and that on the lower surface is decreased; this causes the loop in the pressure diagram, which means that this portion of the aerofoil is being pushed downwards, while the rear portion is being pushed upwards, so that the whole aerofoil tends to turn over nose first.

Movement of centre of pressure

So, even at the angle of zero lift, when the upward and downward forces are equal, there is a nose-down pitching movement on the aerofoil; as will be seen later this is a matter of considerable significance. Putting it another way,

Подпись:How the lift distribution changes with angle of attack

at these negative angles the centre of pressure is a long way back – the only place where we could put one force which would have the same moment or turning effect as the distributed pressure would be a long way behind the trailing edge, in fact at zero lift it could not provide a pitching moment at all unless it were an infinite distance back – which is absurd. Perhaps a more sen­sible way of putting it is to say that there is a couple acting on the aerofoil, and a couple has no resultant and has the same moment about any point (see Chapter 1).

As the angle of attack is increased up to 16°, the centre of pressure gradu­ally moves forward until it is less than one-third of the chord from the leading edge; above this angle it begins to move backwards again.

Now during flight, for reasons we shall see later, the angle of attack is usually between 2° and 8° and is very rarely below 0° or above 16°. So, for the ordinary angles of flight, as the angle of attack of the aerofoil is increased, the centre of pressure tends to move forward.

Lift a pencil at its centre of gravity and it will lie horizontal; move the pos­ition at which you lift it forwards towards the point and the rear end of the pencil will drop: this is because the centre of lift has moved forwards as com­pared with the centre of gravity. Therefore if the aerofoil is in balance or ‘trimmed’ at one angle of attack, so that the resultant force passes through the centre of gravity, then the forward movement of the centre of pressure on the aerofoil as the angle of attack is increased will tend to drop still more the trailing edge of the aerofoil; in other words, the angle of attack will increase even more, and this will in turn cause the centre of pressure to move farther forward, and so on. This is called instability, and it is one of the problems of flight.

If we were to take the wing off a model aeroplane and try to make it glide without any fuselage or tail, we would find that it would either turn over nose first or its nose would go up in the air and it would turn over on to its back. This is because the wing is unstable, and although we might be able to weight it so that it would start on its glide correctly, it would very soon meet some disturbance in the air which would cause it to turn over one way or the other.

Curiously enough, in the case of a flat plate, an increase of the angle of attack over the same angles causes the centre of pressure to move backwards; this tends to dip the nose of the plate back again to its original position, and so makes the flat plate stable. For this reason it is possible to take a flat piece of stiff paper or cardboard, and, after properly weighting it, to make it glide across the room. If it meets a disturbance the centre of pressure moves in such a way as to correct it. Note that the flat piece of paper will only glide if it is weighted so that the centre of gravity is roughly one-third of the chord back from the leading edge. If it is not weighted the centre of pressure will always be in front of the centre of gravity, and this will cause the piece of paper to revolve rapidly.

The unstable movement of the centre of pressure is a disadvantage of the ordinary curved aerofoil, and in a later chapter we shall consider the steps which are taken to counteract it. Attempts have been made to devise aerofoil

Movement of centre of pressure

Fig 3.12 Reflex curve near trailing edge shapes which have not got this unpleasant characteristic, and it has been found possible to design an aerofoil in which the centre of pressure remains practi­cally stationary over the angles of attack used in ordinary flight. The chief feature in such aerofoils is that the under-surface is convex, and that there is sometimes a reflex curvature towards the trailing edge (see Fig. 3.12); nearly all modern aerofoil sections have in fact got convex camber on the lower surface. Unfortunately, attempts to improve the stability of the aerofoil may often tend to spoil other important characteristics.

Total resultant force on an aerofoil

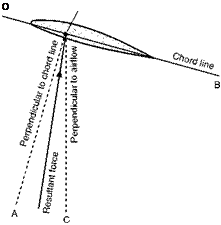
If we add up the distributed forces due to pressure over an aerofoil, and replace it by the total resultant force acting at the centre of pressure, we find that this force is not at right angles to the chord line nor at right angles to the flight direction. Near the tips of swept wings it can sometimes be inclined forward relative to the latter line due to rather complicated three dimensional effects, but over most of the wing, and on average, it must always be inclined backwards, otherwise we would have a forwards component, or negative drag, and hence perpetual motion.

Although the force must on average be inclined backwards relative to the flight direction as in Fig. 3.10 it can often be inclined forwards relative to the chord line normal. Figure 3.10 illustrates the situation. You will see from this figure that there can be a component of the force that is trying to bend the

Подпись: О

Total resultant force on an aerofoil

Direction of airflow

Fig 3.10 Inclination of resultant force
wings forward. This may come as a surprise, because you might have expected that the wings would always be bent rearwards.

Centre of pressure

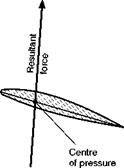
The second thing that we learn from the pressure distribution diagram – namely, that both decreases and increases of pressure are greatest near the leading edge of the aerofoil – means that if all the distributed forces due to pressure were replaced by a single resultant force, this single force would act less than halfway back along the chord. The position on the chord at which this resultant force acts is called the centre of pressure (Fig. 3.9). The idea of a centre of pressure is very similar to that of a centre of gravity of a body whose weight is unevenly distributed, and it should therefore present no diffi­culty to the student who understands ordinary mechanics.

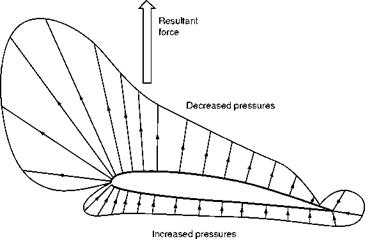
To sum up, we may say that we have a decreased pressure above the aero­foil and an increased pressure below, that the decrease of pressure above is greater than the increase below, and that in both cases the effect is greatest near the leading edge (Fig. 3.8).

All this is important when we consider the structure of the wing; for instance, we shall realise that the top surface or ‘skin’ must be held down on to the ribs, while the bottom skin will simply be pressed up against them.

Fig 3.9 Centre of pressure

Pressure distribution

Figure 3.8 shows the pressure distribution, obtained in this manner, over an aero­foil at an angle of attack of 4°. Two points are particularly noticeable, namely –

1. The decrease in pressure on the upper surface is greater than the increase on the lower surface.

Pressure distribution Pressure distribution

Part plan view of aerofoil

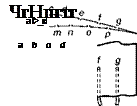
Fig 3.7 Pressure plotting

2. The pressure is not evenly distributed, both the decreased pressure on the upper surface and the increased pressure on the lower surface being most marked over the front portion of the aerofoil.

Both these discoveries are of extreme importance.

The first shows that, although both surfaces contribute, it is the upper surface, by means of its decreased pressure, which provides the greater part of the lift; at some angles as much as four-fifths.

Pressure distribution

The student is at first startled by this fact, as this seems contrary to common sense; but, as so often happens, having learnt the truth, he is inclined to exag­gerate it, and to refer to the area above the aerofoil as a ‘partial vacuum’ or even a ‘vacuum’. Although, by a slight stretch of imagination, we might allow the term ‘partial vacuum’, the term ‘vacuum’ is hopelessly misleading. We find that the greatest height to which water in a manometer is sucked up when air

Fig 3.8 Pressure distribution over an aerofoil

flows over an ordinary aerofoil at the ordinary speeds of flight is about 120 to 150 mm; now, if there were a ‘vacuum’ over the top surface, the water would be sucked up about 10 m, i. e. 10 000 mm. Or, looking at it another way, suppose that there were a ‘vacuum’ over the top surface of an aerofoil and that the pressure underneath was increased from 100 kN/m2 to 120 kN/m2, then we would have an average upward pressure on the aerofoil of 120 kN/m2. The actual average lift obtained from an aeroplane wing is from about 1/2 up to 5 kN/m2. Take a piece of cardboard of about 100 cm2, or l/10th of a square metre, and place a weight of 100 N on it; lift this up and it will give you some idea of the average lift provided by one-tenth of a square metre of aeroplane wing, and the type of load that has to be carried by the skin. You will not want to repeat the experiment with more than 10 000 N on the cardboard!

The reason why the pressure distribution diagram of Fig. 3.8 has not been completed round the leading edge is because the changes of pressure are very sudden in this region and cannot conveniently be represented on a diagram. The increased pressure on the underside continues until we reach a point head – on into the wind where the air is brought to rest and the increase of pressure is 1/2 pV2, or q, as recorded on a pitot tube. The point at which this happens is called the stagnation point, and its position round the leading edge varies slightly as the angle of attack of the aerofoil is changed but is always just behind the nose on the underside of positive angles of attack. After the stag­nation point there is a very sudden drop to zero, followed by an equally sudden change to the decreased pressure of the upper surface, and rather sur­prisingly on the nose.

Pressure plotting

As the angle of attack is altered the lift and drag change very rapidly, and experiments show that this is due to changes in the distribution of pressure over the aerofoil. These experiments are carried out by the method known as ‘pressure plotting’ (Fig. 3.7), in which a number of small holes in the aerofoil surface (a, b, c, d, etc.) are connected to a number of glass manometer tubes (a, b, c, d, etc.) containing water or other liquid and connected to a common reservoir. Where there is a suction on the aerofoil the liquid in the correspon­ding tubes is sucked up; where there is an increased pressure the liquid is depressed. This is really several U-tube manometers connected to a common reservoir (p. 60). Such experiments have been made both on models in wind tunnels and on aeroplanes in flight, and the results are most interesting and instructive.

The reader is advised to work through Example No. 94 in Appendix 3. In this example the results of an actual experiment are given, together with a full explanation of how to interpret the results. In order to follow through to the end of this example it is necessary to have a knowledge of the lift formula given later in this chapter, but the actual ‘pressure plotting’ can be done without this. Multiple manometers provide a good visual indication of the form of a pressure distribution and are frequently used for teaching. If results are to be recorded, it is more convenient to use pressure transducers coupled to a computer (p. 61).

Line of zero lift

Now an aerofoil may provide lift even when it is inclined at a slightly negative angle to the airflow. And one may well ask, how can an aerofoil inclined at a negative angle produce lift? The idea seems absurd, but the explanation of the riddle is simply that the aerofoil is not really inclined at a negative angle. Our curious chord may be at a negative angle, but the curved surfaces of the aero­foil are inclined at various angles, positive and negative, the net effect being that of a slightly positive angle, which produces lift.

If we tilt the nose of the aerofoil downwards until it produces no lift, it will be in an exactly similar position to that of a flat plate placed edgewise to the airflow and producing no lift, and if we now draw a straight line through the aerofoil parallel to the airflow (Fig. 3.6, overleaf) it will be the inclination of this line which settles whether the aerofoil provides lift or not.

Such a line is called the line of zero lift or neutral lift line, and would in some senses be a better definition of the chord line, but it can only be found by wind tunnel experiments for each aerofoil, and, even when it has been found, it is awkward from the point of view of practical measurements.

Nor is it of much significance in practical flight, except perhaps in a dive when the angle of attack may approach the no lift condition.

Note that for an aerofoil of symmetrical shape zero lift corresponds to zero angle of attack.

Direction

Подпись: Line of zero liftLine of zero liftof

airflow

Fig 3.6 Line of zero lift

Chord line and angle of attack

It has already been mentioned that the angle of inclination to the airflow is of great importance. On a curved aerofoil it is not particularly easy to define this angle, since we must first decide on some straight line in the aerofoil section from which we can ensure the angle to the direction of the airflow. Unfortunately, owing to the large variety of shapes used as aerofoil sections it is not easy to define this chord line to suit all aerofoils. Nearly all modern aero­foils have a convex under-surface; and the chord must be specially defined, although it is usually taken as the line joining the leading edge to the trailing edge. This is the centre in the particular case of symmetrical aerofoils.

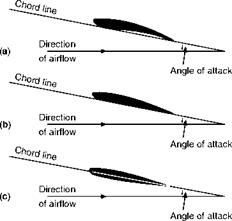
We call the angle between the chord of the aerofoil and the direction of the airflow the angle of attack (Fig. 3.5).

This angle is often known as the angle of incidence; that term was avoided in early editions of this book because it was apt to be confused with the riggers’ angle of incidence, i. e. the angle between the chord of the aerofoil and some fixed datum line in the aeroplane. Now that aircraft are no longer ‘rigged’ (in the old sense) there is no objection to the term angle of incidence; but by the same token there is no objection either to angle of attack – many pilots and others have become accustomed to it; it is almost universally used in America, and so we shall continue to use it in this edition.

[Note. If we wish to be precise we must be careful in the definition of the term ‘angle of attack’, because, as has already been noticed, the direction of the airflow is changed by the presence of the aerofoil itself, so that the direc­tion of the airflow which actually passes over the surface of the aerofoil is not the same as that of the airflow at a considerable distance from the aerofoil. We shall consider the direction of the airflow to be that of the air stream at such a distance that it is undisturbed by the presence of the aerofoil.]

Chord line and angle of attack

Fig. 3.5 Chord line and angle of attack

(a) Aerofoil with concave undersurface.

(b) Aerofoil with flat undersurface.

(c) Aerofoil with convex undersurface.

Aerofoils – subsonic speeds

So far we have only considered the resistance, or drag, of bodies passing through the air. In the design of aeroplanes it is our aim to reduce such resist­ance to a minimum. We now come to the equally important problem of how to generate a force to lift or support the weight of an aircraft.

In the conventional aeroplane this is provided by wings, or aerofoils, which are inclined at a small angle to the direction of motion, the necessary forward motion being provided by the thrust of a rotating airscrew, or by some type of jet or rocket propulsion. These aerofoils are usually slightly curved, but in the original attempts to obtain flight on this system flat surfaces were sometimes used.

Lifting surfaces

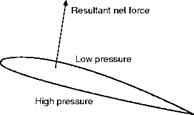
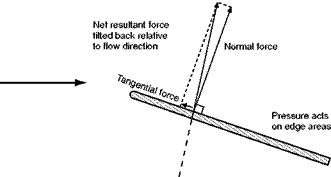
If air flows past an aerofoil, a flat plate or indeed almost any shape that is inclined to the direction of flow, we find that the pressure of air on the top surface is reduced while that underneath is increased (Fig. 3.1, overleaf). This difference in pressure results in a net force on the plate trying to push it both upwards and backwards. In the case of a simple flat plate, you might imagine that the net force would act at right angles to the plate. This is not so, because there is also a tangential force caused by the different pressures that act on the small leading and trailing edge face areas. This tangential force, though small, is by no means negligible. Rather surprisingly, the pressure at the leading edge is normally very low, and at small angles of inclination, the tangential force will act in the direction shown in Fig. 3.2 (overleaf). The reasons for the low pressure at the leading edge will be shown later. Note, that although the tan­gential force may be directed towards the front of the plate, the resultant of the tangential and normal forces must always be tilted back relative to the local flow direction.

Direction of airflow

Aerofoils - subsonic speeds

Подпись: Direction of airflow Aerofoils - subsonic speeds

Fig 3.1 Resultant force on an aerofoil due to pressure difference

Fig 3.2 Forces due to pressure differences in a flat plate

Lift and drag

The resultant or net force on the lifting surface may be conveniently split into two components relative to the airflow direction as follows –

1. The component at right angles to the direction of the airflow, called LIFT (Fig. 3.3).

2. The component parallel to the direction of the airflow, called DRAG (Fig. 3.3)

The use of the term ‘lift’ is apt to be misleading, for under certain conditions of flight, such as a vertical nose dive, it may act horizontally, and cases may even arise where it acts vertically downwards.

Airflow and pressure over aerofoil

It was soon discovered that a much greater lift, especially when compared with the drag, could be produced by using a curved surface instead of a flat one,

Aerofoils - subsonic speeds

Fig 3.3 Lift and drags shown for the case of a descending aircraft

and thus the modem aerofoil was evolved. The curved surface had the additional advantage that it provided a certain amount of thickness, which was necessary for structural strength.

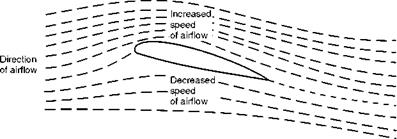
Experiments have shown that air flows over an aerofoil (Fig. 3.4) much more smoothly than over a flat plate.

In Fig. 3.4, which shows the flow of air over a typical aerofoil, the following results should be noticed –

1. There is a slight upflow before reaching the aerofoil.

2. There is a downflow after passing the aerofoil. This downflow should not be confused with the downwash produced by the trailing vortices as described later.

3. The air does not strike the aerofoil cleanly on the nose, but actually divides at a point just behind it on the underside.

4. The streamlines are closer together above the aerofoil where the pressure is decreased.

This last fact is at first puzzling, because, as in the venturi tube, it may lead us to think that the air above the aerofoil is compressed, and that therefore we should expect an increased pressure. The explanation is that the air over the

Aerofoils - subsonic speeds

Fig 3.4 Airflow over an aerofoil inclined at a small angle top surface acts as though it were passing through a kind of bottleneck, similar to a venturi tube, and that therefore its velocity must increase at the narrower portions, i. e. at the highest points of the curved aerofoil.

The increase in kinetic energy due to the increase in velocity is accompanied by a corresponding decrease in static pressure. This is, in fact, an excellent example of Bernoulli’s Theorem.

Another way of looking at it is to consider the curvature of the streamlines. In order that any particular particle of air may be deflected on this curved path, a force must act upon it towards the centre of the curve, so it follows that the pressure on the outside of the particle must be greater than that on the inside; in other words, the pressure decreases as we move down towards the top surface of the aerofoil. This point of view is interesting because it empha­sises the importance of curving the streamlines.

Other experimental methods

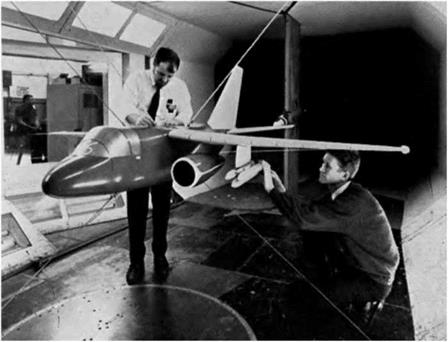
Provided these three limitations are fully realised, and due allowances made for them, wind tunnel results can provide us with some very useful experi­mental data (Fig. 2G).

In addition to wind tunnel tests, experiments may be performed in the fol­lowing ways

1. By experiments in water instead of air.

2. By experiments in actual flight.

Computational fluid dynamics (CFD)

Nowadays computers provide a powerful tool for the investigation of the flow around an aircraft or its components. The equations that describe the mechanics of the airflow (the Navier-Stokes equations) were known well

Other experimental methods

Fig 2G Model in wind tunnel

(By courtesy of the Lockheed Aircraft Corporation, USA) Model being prepared for flutter tests in wind tunnel

before the first flight. However, nobody could solve them, except for a few trivial cases. Even with the advent of computers, capable of performing mil­lions of calculations per second, it is not possible to solve the exact equations but they can be solved approximately. With this powerful tool you might think that there is now no need for wind tunnels. However, there are problems. Data from wind tunnels have to be used in CFD to model turbulence and CFD is not very good at accurately predicting flows where there are large turbulent areas, such as at stall. Predicting flows is therefore still something of a black art. Tunnel results are prone to scale effects, which are difficult to interpret and CFD also has its problems (as does flight testing – it is hard, for example, to sort out effects due to the engine from those due to the airframe). Tike most things, there is no substitute for experience and ever more sophisticated ways are being developed to use the power of CFD and wind tunnel testing and flight testing to complement each other.

In the next chapter we look at how we use an aerofoil to produce the more desirable aerodynamic force, lift. Before reading this see if you can answer the following questions. If you can do so you have probably understood most of this chapter and you may proceed with confidence, but you should also try the numerical questions in Appendix 3.

Can you answer these?

11. What is the meaning of (a) subsonic, and (b) supersonic speeds?

12. What does the symbol ‘q’ stand for?

For solutions see Appendix 5.

For numerical questions on air and airflow see Appendix 3.