Category Principles of Helicopter Aerodynamics Second Edition

Model Rotor Similarity Parameters

The effects of Reynolds number and Mach number becomes particularly important when studying the performance of subscaled rotors, and especially when attempting to use these results to predict the performance of the full-scale rotor. See Section 6.8 for a summary, but the problems are discussed in considerable detail by Philippe (1990). The dimensions of most wind tunnels do not permit the testing of model rotors much above 1 /4-scale. There are, however, some special wind tunnels that permit the testing of larger rotor models. For example, the DNW tunnel in the Netherlands has a 32 x 32 ft (9.75 x 9.75 m) section where 40% subscale rotor models may be tested. In another large wind tunnel at NASA Ames Research Center, which has both 40 x 80 ft (12.2 x 24.4 m) and 80 x 120 ft (24.4 x 36.6 m) working sections, full-scale rotors may be tested.

For a rotor in forward flight, the speed similarity parameter is the advance ratio ii = Too/QR. Normally, the advance ratio is fairly easy to simulate in a wind tunnel environment by a suitable choice of rotor tip speed and V^. To simulate the aerodynamic effects, the Reynolds numbers and Mach numbers on the model rotor must be as close as possible to the full-scale values. In practice, this is not easy to achieve. For example, consider the attainment of full-scale tip Mach numbers on a 1/5-scale rotor. If the rotational frequency of the full-scale rotor is S3, then for Mach number scaling the rotational frequency of the model must be 5S3. Yet, the Reynolds numbers for the model will still be a factor of 1/5 those on the full-scale rotor. Thus, the model rotor may operate with Reynolds numbers that are in the sensitive regime, that is, in Reynolds number regimes where the aerodynamic characteristics of the blade sections show a higher sensitivity to Reynolds number. The inability of model rotors to achieve tip Reynolds numbers above 106 is a serious factor when trying to extrapolate airloads and rotor performance measurements to full-scale.

Table 7.1. Relative Scaling Parameters for a 1/5-Scale Rotor in Air and Freon

Scaling factors

Air

Freon-12

Mach number

1.0

1.0

Lock number

1.0

1.0

Advance ratio

1.0

1.0

Froude number

5.0

1.0

Reynolds number

0.2

0.53

Time

0.2

0.446

Angular velocity

5.0

2.24

Linear velocity

1.0

0.448

Force

0.04

0.0334

Moment

0.008

0.00667

Power

0.04

0.01419

Mass

0.008

0.0334

Some of the problems in matching Reynolds numbers and Mach numbers on models have been overcome by changing the test gas from air to Freon. However, the use of Freon as a test medium is expensive and can be used only in very specialized wind tunnels. Freon will allow full-scale tip Mach numbers to be achieved with a rotational frequency of 2Q with a 1/5-scale rotor. Furthermore, the properties of Freon allow the Reynolds numbers to be as high as 0.53 those of full-scale. The general scaling parameters for a 1/5-scale model in air and Freon are summarized in Table 7.1, which is from Philippe (1990).

Mach Number

The ratio of the speed of the flow to that of the speed of sound is called the Mach number and can be interpreted physically as a ratio of inertia forces in the fluid to forces resulting from compressibility. The speed of sound is the speed at which pressure disturbances are propagated through the air and is given by a = ffyRT where у — 1.4 is the ratio of specific heats for air, R is the gas constant, and T is absolute temperature. The speed of sound is approximately 1,117 ft s_1 (340 m s-1) at sea level on a standard day – see Section 5.2. When an airfoil travels at low speeds relative to the speed of sound, pressure disturbances travel at relatively high speeds in all directions. This causes the flow approaching the airfoil to change its velocity and pressure very gradually. The now, therefore, can be considered incompressible. Notice that for an truly incompressible flow a = oo, so that M = 0. When the airfoil travels at higher speeds relative to the speed of sound, disturbances cannot travel as far from the airfoil in a given time. This means that the flow approaching the airfoil undergoes more sudden changes. Under these conditions there are measurable changes to the characteristics of the airfoil, such as increased lift coefficient and a movement of the aerodynamic center. If the airfoil approaches and exceeds sonic speeds, then disturbances cannot be propagated upstream and discontinuous changes in the flow properties take place at the airfoil. Under these conditions there are large nonlinear changes in the airfoil characteristics.

(a) Moo reaches critical Mach number (b) M«, just greater than л/

Mach Number

Mach Number

Mach Number

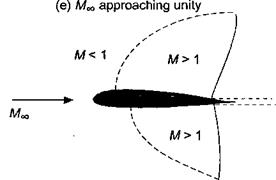
Figure 7.9 Development of supersonic flow pockets on an airfoil for increasing free-stream Mach number, (a) = critical Mach number, M*. (b) > M* with developing shock

wave, (c) Shock wave develops on lower surface, (d) Lower surface shock wave moves quickly toward trailing edge, (e) MTO approaching unity.

When the air flows past an airfoil, the local velocity at the surface outside the boundary layer may be greater or less than the free-stream velocity. The highest velocities occur near the leading edge and over the upper surface of the airfoil. If the free-stream velocity is low enough, the flow velocity remains subsonic everywhere. Such flows are relatively easy to analyze because the governing equations are linear. At higher free-stream velocities, however, the acceleration of the flow will eventually cause regions of supersonic flow. This is a mixed or transonic flow, which although predominantly subsonic, has an embedded supersonic pocket, as illustrated by Fig. 7.9. This problem is much more difficult to analyze because of the nonlinear nature of the equations governing the flow.

The value of the free-stream Mach number, Moo, where the flow first becomes locally sonic (M = 1) is called the critical Mach number, M*. The value of M* will also depend on the AoA of the airfoil. Further increases in Moo cause the extent of the supersonic region to grow, and the region becomes terminated by a shock wave that is initially almost perpendicular to the airfoil surface. Across the shock wave there is a rapid increase in pressure and also an entropy chalnge whereby energy is converted to heat resulting in

a form of profile drag known as wave drag. The interaction of the shock wave and the boundary layer results in an increase in skin friction drag. Moreover, the high adverse pressure gradients found in the vicinity of the shock wave make boundary layer thickening inevitable and this will be accompanied by an increase in profile drag.

With increasing Mach number (or AoA) the shock wave will strengthen, move aft, and become more oblique to the airfoil surface. At some point, depending on the AoA and airfoil shape, the flow on the lower surface also becomes supersonic, resulting in a second supersonic pocket and terminating shock wave. With further increases in M^, the lower surface shock wave moves quickly toward the trailing edge; this is followed by the rapid aft movement of the upper surface shock wave. If at any point during this process the shock wave becomes sufficiently strong, then the high adverse pressure gradients will cause the boundary layer to separate causing a loss of lift and an increase in drag known as shock induced stall. Liepman (1946) and Pearcy (1955) give good fundamental discussions on shock wave/boundary layer interactions.

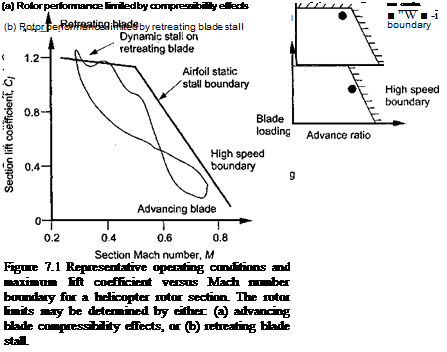
In Fig. 7.1 it has already been shown that rotor airfoils operate in a relatively diverse aerodynamic regime during each revolution of the rotor, ranging from low subsonic speeds at the root of the blade to transonic flow conditions at the blade tips. Compressibility effects can manifest before sonic speed is reached locally on the airfoil. Even when the free-stream Mach number is quite low, say about 0.3 on the retreating blade, the high angles of attack found under dynamic (unsteady) conditions mean that a supercritical (locally supersonic) flow region can exist near the leading edge of the airfoil. Consequently, compressibility issues need tc be addressed very carefully to ensure that the selected airfoil sections will perform satisfactorily under the actual flight conditions found on a helicopter rotor.

Concept of the Boundary Layer

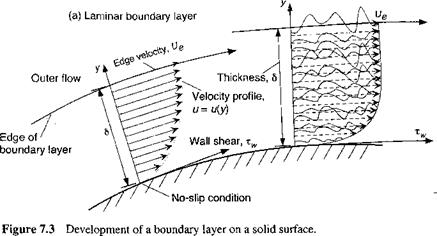
At low angles of attack, the effects of viscosity are confined to a thin region near the surface of the airfoil known as the boundary layer. Historically, the concept of the boundary layer was first proposed by Prandtl (1928) in his seminal work on the subject. Real fluids do not slip at a solid boundary and there will be no relative motion between the fluid and the surface of the airfoil. Therefore, there is a region close to the airfoil where the velocity rises from zero at the surface to the external flow velocity, Ue. This boundary layer region is generally very thin, being a small fraction of the airfoil chord. The concept is illustrated in Fig. 7.3. On an airfoil operated at higher Reynolds numbers the boundary layer will generally vary from practically zero thickness near the leading edge to a few percentages of the chord at the trailing edge. At lower Reynolds numbers the boundary layer can be much thicker, which will result also in the airfoil having a higher a profile drag.

Boundary layers are found to be of two main types: laminar or turbulent. A third type can be considered to be transitional, although this is not a steady boundary layer flow and is difficult to characterize. A comparison of the profile shapes of a laminar and turbulent boundary layer is also shown in Fig. 7.3. The parameter 5 is the boundary layer thickness, which is defined as the value of у for which 99% of the external flow velocity is recovered (i. e., и = 0.99Ue). The flow in a laminar boundary layer is smooth and free of any mix­ing of fluid between successive layers, whereas the flow in a turbulent boundary layer is characterized by significant mixing between layers of the fluid. This produces a momen­tum transfer through the boundary layer, and so the distribution of velocity in a turbulent boundary layer is characterized by larger velocities closer to the airfoil surface. Also, for the same reasons, a turbulent boundary layer has a greater thickness compared with a laminar boundary layer that develops under the same pressure gradient. See Schlichting (1979) and Young (1989).

Viscous stresses are produced whenever there is relative motion between adjacent fluid elements, and these stresses produce a resistance that tends to retard the motion of the fluid. The viscous shear stress, t, is related to the absolute viscosity, /x, by Newton’s formula

where du/dy is the rate at which the flow velocity increases perpendicular to the airfoil surface. (Note that the partial derivative is used in this equation because и can vary not only with у but also in other directions.) Thus, as implied by the shape of the boundary layer velocity profile in Fig. 7.3, the shear stress, rw, produced on the surface of an airfoil will be greater with a turbulent boundary layer than for a laminar one because

Ґ du

(7J)

The development of a laminar boundary layer in a zero pressure gradient flow can be computed exactly. This result was first obtained by Blasius (1908), with an improved solution by Kuo (1953). In Blasius’s solution the local skin friction coefficient, Cf, on one side of a flat-plate is

cf = = 0.664 Re~° (7.8)

1 inV2

2 r oo

where Rex is the Reynolds number based on the distance from the leading edge of the plate. The net shear stress drag coefficient of the plate will be

2 rc

Cd = – / cf dx = 1.328 Re~0 5, (7.9)

c Jo

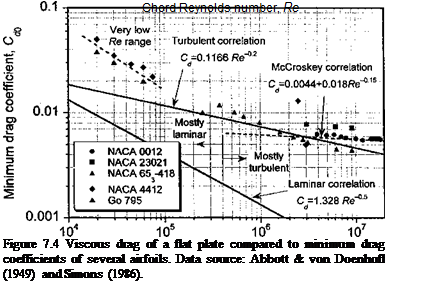
where c is the chord of the plate. This result is plotted in Fig. 7.4; however, very few airfoils follow the Blasius result because at Reynolds numbers above about 5 x 10⁵ the boundary layer usually becomes turbulent even at low angles of attack. The reason for this is that at Reynolds numbers above a certain minimum value, natural flow disturbances (although often caused premature! у by surface roughness) can cause a transition from a laminar to a turbulent boundary layer. Helicopter airfoils will typically exhibit laminar flow only over a few percentages of the chord. For a fully developed turbulent boundary layer on a flat-plate, the skin friction coefficient Cf on one side of the plate is found to be close to

Concept of the Boundary Layer

cf =0.0583 Re~0 2, (7.10)

so that

2 Cc

Cd = – Cfdx = 0.1166 Re~0-2. (7.11)

c Jo

The validity of the latter expression is limited to a Re range between 105 and 109. Below Re = 5 x 10⁵ the boundary layer can normally be assumed to be laminar unless artificially tripped. The drag of a flat-plate with a fully turbulent boundary layer is also plotted in Fig. 7.4 and is compared to the measured minimum drag coefficients of several airfoils. The results suggest that the turbulent flat-plate solution is a good approximation to the viscous (shear) drag on airfoils over the practical range of Reynolds numbers to be found on helicopters, that is, above about 106. In this case it will be sufficient to assume that

Подпись: w — CdKfConcept of the Boundary Layer(7.12)

where Re ref is the reference Reynolds number for which a reference value of drag C^ref is known. The empirical equation (Eq. 6.20) suggested by McCroskey (1977) offers an improved correlation for airfoils with fully developed turbulent boundary layers at the higher Reynolds numbers. At very low Reynolds numbers, say below 105, the laminar boundary layer separates more readily and the profile drag of typical airfoils are much larger that either laminar or turbulent boundary layer theory would suggest. Airfoil behavior in this Reynolds number regime is important for many classes of micro air vehicles (see Section 6.14). In this case, changing the scaling coefficient from 0.2 to 0.4 in Eq. 7.12 is good approximation based on the results shown in Fig. 7.4 at very low Re.

Подпись: ► Free stream flow
Подпись: —  П Transition
Подпись: Laminar boundary layer Подпись: Turbulent boundary layer

Leading edge Trailing edge

Concept of the Boundary Layer

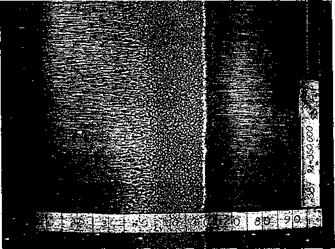
Figure 7.5 Surface flow visualization on a airfoil at low AoA showing the transition from a laminar to turbulent boundary layer. Eppler 387 airfoil, Re = 350,000, a = 2°. (Photo courtesy of Michael Sellig.)

point

Note also that a turbulent boundary layer will be thicker than a laminar one. If 8 is defined as the value where и = 0.99Ue then for a laminar boundary layer

Подпись: (7.13)Подпись: (7.14)8 ~ 5.2* Re-° and for a turbulent boundary layer 8 ~ 0.37* Re~0-2.

Therefore, in addition to a higher viscous shear on the airfoil surface the presence of a

Подпись: lUlUUiVUV UV/li

Concept of the Boundary Layer

tnrKnlpnt КлппЛііп/ Ь/рг will rpcnlt in я orpQfpr u/яігр mnmpntnm Hpfirit япН я ЫоЬрг

………………………………………………………………………………. ij TTXXX 1VOM1V ХХЖ W 4«V***W*W^*« V^WXX-W’XV UUS* V* overall profile drag compared to an airfoil with a fully laminar boundary layer.

The significance of the two boundary layer states on an airfoil at low AoA and relatively low Reynolds number is illustrated in Fig. 7.5. The flow was visualized by means of the surface oil flow technique (see also Fig. 7.31). For these conditions the forward 60% of the airfoil has a laminar boundary layer. The low surface shear stress here allows the oil to accumulate, especially near mid-chord, where the boundary layer approaches the point of separation. After laminar separation occurs, the flow will temporarily leave the airfoil surface but undergo a transition process and immediately reattach again as a turbulent boundary layer. This can leave a small region of recirculating separated flow that is known as a laminar separation bubble, as shown schematically in Fig. 7.6. The presence of laminar separation bubbles can also be observed by a small constant pressure region in the measurement of the chordwise pressure distribution near the leading edge of the airfoil. With surface oil flow visualization, the bubble is evidenced by an accumulation of oil – see Fig. 7.5 and later in Fig. 7.30. The formation of laminar separation bubbles is common for the types of airfoils and Reynolds numbers found on helicopter rotors. Further details on laminar separation bubbles are given by Ward (1963), Horton (1967), and Liebeck (1992).

Concept of the Boundary Layer Подпись: (*-component of momentum), Подпись: (7.15) (7.16)

It is found that the developing boundary layer on an airfoil is sensitive to the pressure gradient. In the boundary layer, a simplified form of the Navier-Stokes equations applies – see Section 14.2.1. In this case the equations are written in a classic form as

Concept of the Boundary Layer

Figure 7.7 Development of the boundary layer in a simple external pressure gradient.

—— = 0 (pressure gradient normal to surface). (7.17)

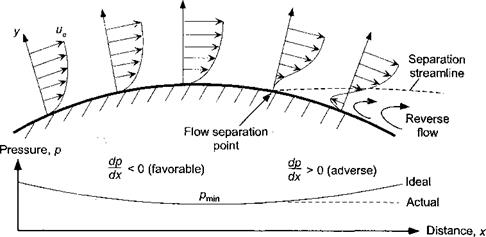
The pressure gradient is denoted by dp/dx along the surface. When the gradient is positive or adverse, that is, one in which dp/dx > 0, the pressure force is in the direction that tries to decelerate the flow. The resulting force on the fluid is particularly strong near the surface of the airfoil where the velocity is low; therefore du/dy near у = 0 becomes smaller the longer the adverse pressure gradient persists. This effect is shown in Fig. 7.7. At some distance downstream a point is reached where rw -» 0 and the direction of the flow reverses near the surface. This point is called the flow separation point, because the flow breaks away and leaves the surface, altering the entire disposition of the flow. Under these conditions, the concept of the boundary layer breaks down and a recirculating flow (wake) is left downstream of the separation point; downstream of separation the effects of viscosity influence an extensive region of the flow. Flow separation is one of the least well understood and poorly modeled phenomena in fluid mechanics, even under steady 2-D conditions. In unsteady (external) flows, the onset of flow separation is more complicated and there can be significant regions of flow reversal within the boundary layer even in the absence of separation – see McCroskey (1977). On rotating blades there are additional centrifugal and Coriolis acceleration terms acting on the 3-D boundary layer, which can affect stall behavior – see Section 13.12.2.

Turbulent boundary layers are much less susceptible to separation than laminar boundary layers because of the higher mixing and interlayer momentum transfer of the fluid. At higher Reynolds numbers, the pressure rise required to separate a turbulent boundary layer may be an order of magnitude iarger than that required to separate a laminar boundary layer. On rotor airfoils, which tend to have relatively sharp leading edges and peak suction pressures close to the leading edge, a steep adverse pressure gradient is found over most of the chord, and a laminar boundary layer can only exist for a very short distance from the stagnation point (typically, 2-15% chord). At low angles of attack, the turbulent boundary layer will generally extend all the way to the trailing edge of the airfoil. At higher angles of attack, the increasing intensity of the adverse pressure gradients will ultimately cause the turbulent boundary layer to begin to separate – see Thwaites (1960). Many rotor airfoils stall by the process of progressive turbulent trailing edge flow separation, whereby the separation

Подпись: LaminarПодпись: separation Turbulent / bubble separation Concept of the Boundary LayerShear

layer

Concept of the Boundary Layer
Подпись: Turbulent wake

7

Shear

layer

Figure 7.8 Development of trailing edge flow separation on an airfoil.

point starts at the trailing edge and moves forward on the chord with increasing AoA. This process is shown schematically in Fig. 7.8. When the airfoil forces and moments are plotted versus AoA, the onset of progressive trailing edge flow separation has a deleterious effect on the airfoil performance compared to that obtained with fully attached flow (see Section 7.9).

Reynolds Number and Mach Number Effects

Подпись: F JpVooC Too pV*c* F * H ' a Подпись: = / (Re, M). Подпись: (7.1)

Two of the most well known parameters used in aerodynamics are the Reynolds number and the Mach number. For an airfoil, its size is described by a characteristic length based on the chord, c. When the airfoil is moving through a fluid of viscosity д, density p, and sonic velocity a, and with a speed Voo at some relative orientation to the flow, then the method of dimensional analysis shows that the force on the airfoil, F, can be written in functional form as

The combinations pV^c/p, and Voo la are called the Reynolds number (denoted by Re) and Mach number (denoted by M), respectively. Unfortunately, these parameters have both independent and interdependent influences, which complicates the understanding of the problem of finding their effects on the aerodynamic force.

7.3.1 Reynolds Number

The physical significance of the Reynolds number is that it represents the ratio of the inertial forces to the viscous forces in the fluid. This can be seen by writing the Reynolds number as

pVooC pVoociVooc) pV^c2 Inertial force

Ke = ——– = —————– = —————– = —————— . (/.Z)

M Ц’іУооС) At(Voo/c)c2 Viscous force

On the numerator, pV^c2 has units of force and so it represents an inertial force. The coefficient of viscosity, д, is the shear force per unit area per unit velocity gradient. The denominator, therefore, is a viscous force. For an ideal fluid, the Reynolds number is effectively infinite. However, when viscous forces are dominant, the Reynolds number is small in value. For helicopters the range of Reynolds numbers encountered by the rotor is significant, and Reynolds number effects on its aerodynamics are significant.

Подпись: ..

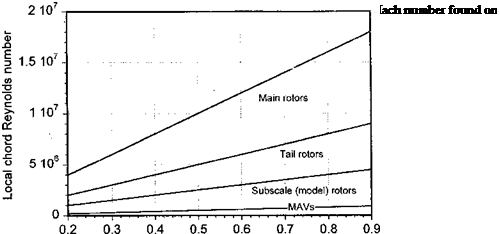
The aerodynamic characteristics of rotor airfoils must be assessed at their actual opera­tional Reynolds numbers and Mach numbers. Figure 7.2 illustrates the operational Reynolds number and Mach number ranges typical of helicopter rotors, both at full scale and model (sub) scale. The maximum lift coefficient, C/max, can be used as one indicator of the sig­nificance of viscous effects. At the low end of the practical Reynolds number range for rotors (i. e., for chord Reynolds numbers in the range 105 < Re < 106), most airfoils have

Advancing

Подпись:

Reynolds Number and Mach Number Effects

blade

relatively low values of C;max. This is because the viscous forces are more dominant, the boundary layer is thicker, and the flow will separate more readily from the airfoil surface, all other factors being equal. In the range Re — lx 106 to 3 x 10⁶ the greatest changes in C/max generally occur. For Re > 4 x 10⁶ any changes in C/max are found to be more gradual. Clearly, Fig. 7.2 shows that subscale rotor models and tail rotors will fall into the range where the airfoil characteristics can be sensitive to Reynolds number. In particular, for subscale rotors the chord Reynolds numbers on the retreating blade are typically below 106 and, therefore, are more susceptible to viscous effects. This is important when assessing the performance characteristics obtained from subscale rotor tests and extrapolating the results to estimate full-scale rotor performance. Notice that the blade Reynolds numbers found on rotating-wing types of micro air vehicles (see Section 6.14) will fall well below those of even the smallest helicopter rotors, and are generally well below 105.

Reynolds Number and Mach Number Effects Reynolds Number and Mach Number Effects

It will be apparent that on the rotor blade the Reynolds number and Mach number are related by the velocity, V. For example, the Reynolds number can be written in terms of the Mach number as

This means that for a typical helicopter, with a main rotor blade chord of between 0.5 ft and 1.5 ft (0.15 m to 0.46 m), on the advancing blade at a point where the Mach number is 0.7 the Reynolds number will be as high as 0.81-2.44 x 10⁷, and on the retreating blade at a point where the Mach number is 0.3 the Reynolds number will be only as low as 0.35-1.05 x 10⁷.

(b) Turbulent boundary layer

Reynolds Number and Mach Number Effects

Helicopter Rotor Airfoil Requirements

A representative variation in the operating lift coefficient, Q, versus incident Mach number, M, for a section near the tip of a helicopter rotor blade in forward flight is illustrated in Fig. 7.1. Two flight conditions are shown. Superimposed on each figure is the approximate static stall boundary for a first-generation airfoil, such as the NACA 0012. One condition is where the rotor operational limits are determined by advancing blade compressibility effects. The other condition is where the rotor limits are determined by retreating blade stall. Notice that in either case the advancing blade operates at low AoA but at high subsonic or transonic conditions, whereas the retreating blade operates at low Mach numbers and high lift coefficients. Overall, it will be seen that this airfoil section operates throughout at a condition close to the boundary where flow separation may occur. Because the onset of flow separation may ultimately limit rotor performance, there has been a great deal of emphasis in rotor design on maximizing the lifting capability of rotor airfoil sections to

Helicopter Rotor Airfoil Requirements

simultaneously alleviate both compressibility effects and retreating blade stall. The rotor design point, therefore, must recognize the influence of both effects as limiting factors, as well as allow sufficient margin from the stall/compressibiiity boundary for perturbations in AoA and Mach number associated with maneuvering flight and turbulent air.

The general requirements for a good helicopter rotor airfoil are as follows: [24] [25]

4.

Подпись: 3. A good lift-to-drag ratio over a wide range of Mach number. This will give the rotor a low profile power consumption and the helicopter a low autorotative rate of descent.

A low pitching moment. This will help minimize blade torsion moments, minimize vibrations, and keep control loads to reasonable values.

In airfoil design, it turns out that many of these requirements are conflicting in that they cannot all be simultaneously achieved with the use of a single airfoil shape. However, much can be done to maximize one or more of the airfoil performance attributes without drastically compromising another. To do this, however, requires an understanding of the key (and interrelated) effects of factors such as airfoil shape, AoA, Reynolds number, and Mach number on the aerodynamic performance.

Aerodynamics of Rotor Airfoils

It [the Gottingen-429] is a reasonably efficient airfoil, although others give greater lift and a great many different curves [airfoil shapes] are used for designing airplanes. But, the important advantage of this particular type is that its center of lift or pressure is approximately the same at all angles which it may assume in flight. This is not true of other types of airfoil, so that center of pressure travel is a factor to be reckoned with in using them.

Juan de la Cierva (1931; in reference to the twisting moment produced on autogiro blades by a cambered airfoil.)

Подпись: 7.1Introduction

The goal of this chapter is to review the aerodynamics of airfoils and to discuss their potential impact on helicopter rotor performance. An improved understanding and predictive capability of rotor airfoil characteristics will always lead to an improved analysis capability of existing rotor designs and may ultimately lead to new rotors optimized for greater performance in both hover and forward flight. The selection of airfoil sections for

* о **Vk Г» jA 1 ffl />lllf Л fivA/1 n 1 ІМЛЛЛП ПЛ г» tlrtf ГЧ/М

іиілла id mwit’ uuuv^uu Lixau іш a илл^и-wing anvian іл/tau^ uiv^J uui jpunu

designs; that is, the AoA and Mach number vary continuously at all blade elements on the rotor and one airfoil section cannot meet all the various aerodynamic requirements.

On early helicopters, little attention was paid to the selection of airfoil section because there were just too many other technical problems to solve. Although the NACA had developed some special helicopter airfoils in the late 1940s, it was not until the middle of the 1960s that airfoil sections specifically tailored to meet the special requirements of helicopters became more widely used by manufacturers. Since then, the major helicopter manufacturers and research organizations have developed various families of improved airfoil profiles for use on helicopter rotors. Each airfoil profile within the family will have specific aerodynamic and geometric attributes optimized for different radial positions on the blade. The construction of a blade with multiple airfoil sections along its length is made easier today, mainly because of computer aided design and composite materials manufacturing technology, which makes the design and production costs comparable to one with a single airfoil.

UiofAriPollt/ ilia Koof оігРліІс ога лКіоіпа/^ ЛглппЬ or» m/nlnfiлпor7 пглласс ії;Ьага Клііі

X НОШІІ^ШІ jу Uiv UWOl UiJLJLV/AAO ШЧ/ V/UlUlli^U UJULV/l*gjLl Ш1 vrviuuv/iuu j ^/IVWOO) TVUV1V L/UU1

theory and experiment go hand in hand to meet specific operating requirements. The tools to help design airfoils that have specific aerodynamic characteristics have been available since the 1920s. The development of the thin-airfoil theory by Munk (1922, 1924) and Glauert (1947) led to an understanding of how camber affected the chordwise pressure loading. This allowed the effects of camber to be isolated from thickness, but the effects combined as required by linear superposition. The problem of defining the airfoil pressure distribution for an airfoil of arbitrary shape was tackled semi-analytically by Theodorsen & Garrick (1932). The design of practical airfoil shapes was further aided by methods representing airfoil thickness, such as the conformal transformation method developed by

Prandtl & Tiejens (1934). This made it possible to compute pressure distributions and lift characteristics, at least for some specially shaped “Joukowski” airfoils. The detailed aerodynamic properties of Joukowski airfoils were studied in the late 1920s at Gottingen, Germany and by the NACA. – see Schrenk (1927) and von Mises (1959). Abbott et al. (1945) developed a numerical method to predict chordwise pressure distributions and airfoil characteristics based on an extension of thin-airfoil theory, where the increment in loading distribution associated with camber could be combined with the loading from thickness and angle of attack (AoA).

By the 1960s, surface singularity or “panel methods” coupled with boundary layer dis­placement corrections were available for airfoil design – see Section 14.7 for details. Much of the pioneering work with panel methods was done by Rubbert (1964) and by Hess & Smith (1967). Inverse panel methods allowed airfoils to be designed meet specific aero­dynamic requirements. Kennedy & Marsden (1978) were one of the first to develop such methods. Generally, the airfoil designs were optimized for maximum lift. Eppler & Somers (1980) discuss an alternative method for inverse airfoil design using conformal mapping with boundary layer corrections. Hicks & McCroskey (1980) discuss the numerical op­timization of a helicopter airfoil, with experimental validation. The advent of numerical methods for transonic airfoil design also meant that for the first time helicopter airfoil shapes could be more carefully designed to meet advancing blade requirements. Sloof et al. (1975) and Narramore & Yen (1982, 1997) discuss transonic airfoil design methods for helicopter rotors.

While most airfoil designs have been conducted for 2-D flows, the complicated flow near the tip of a helicopter blade demands 3-D prediction methods as well. Caradonna and colleagues (1972, 1976, 1978) were major contributors to 2-D and 3-D transonic flow prediction methods for helicopter blades using finite-difference methods. The advent of finite-difference solvers for the Euler and Navier-Stokes equations has led to increasing sophistication in airfoil design tools – see, for example, McCroskey & Baeder (1985), Malone et al. (1989), Bezard (1992), and Narramore (1994). However, the extreme operating conditions and often highly unsteady flow environment found on helicopters means that rotor airfoils must still be tested in a wind tunnel to fully and accurately assess their aerodynamic performance, mainly because modern computational methods have not yet matured to a level where turbulent flow separation and stall effects can be predicted with acceptable accuracy.

Chapter Review

This chapter has reviewed many of the aerodynamic issues important in the design of the modern helicopter. It has been noted that there are several trade-offs in the basic sizing and overall optimization methodology of helicopter main rotors. The final design is always a compromise to meet the needs of a particular set of customer or mission requirements. The use of improved airfoil sections and advanced tip shapes generally helps to improve overall rotor performance, allowing higher figures of merit and better cruise efficiency. The computational tools for rotor design are now at a high level of maturity, although significant empiricism must generally still be relied on.

The aerodynamics of the helicopter fuselage and empennage are complicated in them­selves, mainly because of the extensive regions of separated flow that can exist. This is complicated further by the aerodynamic interactions that exist between the main rotor and the fuselage, a subject considered in detail in Chapter 11. Predictions of airframe drag is still beyond the state of the art, but can be reliably estimated through component testing of the fuselage and rotor in the wind tunnel and verified by flight testing experience. Besides the main rotor and the airframe, the design of the empennage and tail rotor are key elements in the successful design of the helicopter. Because of the various aerodynamic interactions and the trade-offs in weight and stability, the sizing and positioning of the horizontal sta­bilizer on the tail has proven to be one of the most difficult challenges facing helicopter designers. The special issues associated with tail rotors have been shown to be extremely important to the design of the modem helicopter. The tail rotor operates in a complicated flow environment, with its operation being affected strongly by the main rotor wake, an issue also discussed in Chapter 11. Many other factors need to be considered to ensure that the tail rotor operates effectively as an anti-torque and directional control device over the full operational flight envelope of the helicopter. Other anti-torque devices such as the fenestron and NOTAR have proved viable alternatives to the conventional tail rotor.

Some concepts for compounds and “high-speed” helicopters have been reviewed. While many ideas have been put forth over the past fifty years, there are no high-speed rotorcraft other than tilt-rotors currently flying. The aerodynamic and aeroelastic problems of high­speed helicopters have proved difficult to solve cost effectively. However, with the advent of new technologies such as smart structures to help control aerodynamic forces and vibration levels on the rotor, it is likely that a further expansion in the operational flight envelope of conventional helicopters will occur.

The unique problem of designing a human-powered helicopter has also been discussed. While perhaps feasible, albeit at the expense and practical difficulties of building a truly enormous and lightweight rotor, it does not seem likely that even the most athletic human has the energy or endurance that can power a helicopter rotor for any significant time. This does not mean, however, the the task is impossible. Finally, the emerging area of hovering micro air vehicles has been mentioned. Current MAVs fall short of anticipated performance because of the low Reynolds numbers and relatively high viscous drag forces. However, this is a relatively new area of research and further developments in aerodynamic understanding will likely lead to much improved MAV designs.

Hovering Micro Air Vehicles

A micro air vehicle (MAY) has been defined variously as an aircraft having a max­imum dimension of 15 cm (~ 6 in) to as much as 40 cm (~ 16 in). MAVs are being designed to meet the requirements of various military missions at affordable cost. While having the obvious advantage of small scale and correspondingly low radar cross section, MAVs can potentially provide for reconnaissance capability advantages with rapid deployment and real-time data acquisition capability, with stealth and relatively low noise. Being able to operate autonomously is obviously an added capability of much military value. These ca­pabilities can offer the modern military increased situational awareness and greater combat effectiveness with fewer casualties.

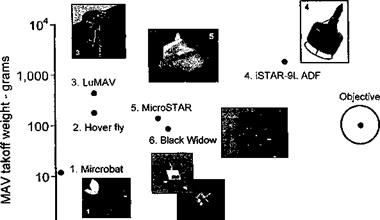
There are two VTOL types of MAV configurations that received interest, those based on rotating-wings and those with flapping (reciprocating) wings. As shown in Fig. 6.42, all existing MAV designs fall well short of the desired empty weight, payload and endurance objectives because they have not yet shown credible aerodynamic efficiency [see Bohorquez et al. (2003) and Tarascio & Chopra (2003)] or sufficiently good specific fuel consumption. Rotating-wing MAVs operate at blade chord Reynolds numbers that may be three orders of magnitude lower than full-scale helicopters. This produces thick boundary layers on the blades and results in large values of profile drag (see Fig. 7.4 as well as Sections 6.4.7 and 7.13). The resulting poor lift-to-drag ratios of the blade sections decrease substantially the net rotor efficiency (the figure of merit). In concert with this effect is the typically high induced power requirements associated with MAV-scale rotors. Specific problems of engine efficiency at this scale must be also considered, including increased friction and thermal losses and significantly decreased overall engine efficiency. In addition, for internal combustion engines there are carbureation and fuel-air mixing issues associated with low intake Reynolds numbers.

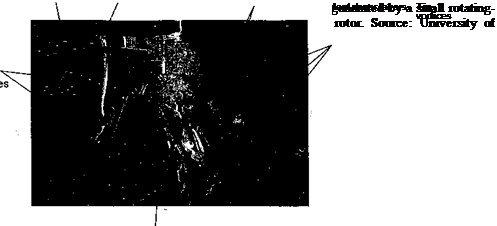
The underlying reason for high induced aerodynamic losses from a rotating-wing MAV can be seen in the structure of the rotor wake, an example of which is shown in Fig. 6.43.

Hovering Micro Air Vehicles

14———- 1———- 1———– 1————- 1 і і

0 10 20 30 40 50 60

Flight endurance – mins.

Figure 6.42 The domain of weight-endurance for some hovering MAV designs. Adapted from Tarascio & Chopra (2003).

The wake was visualized using smoke and laser sheet illumination (see Section 10.2.2). While the helicoidal wake structure is qualitatively similar to that found on rotors at much larger scale (see Figs. 2.2, 2.4, and 10.5), with clear evidence of the tip vortices on the periphery of the wake boundary, the most noticeable difference at this small scale is the very thick, turbulent vortex sheets in the rotor wake. These sheets are formed by the merging of the thick boundary layers on the upper and lower surfaces of the blade sections, which operate at Reynolds numbers of less than 104. These sheets are then convected down­ward in the wake below the rotor, undergoing a stretching and folding process. The net result is a relatively wide, conical, turbulent inner wake region that occupies a substantial fraction of the slipstream area. This means that an increased mass flow is necessary to produce the same change in vertical momentum of the fluid through the control volume surrounding the rotor and its wake. The net result for the MAV is larger induced losses to generate a given thrust, a higher effective disk loading, and much reduced hovering efficiency.

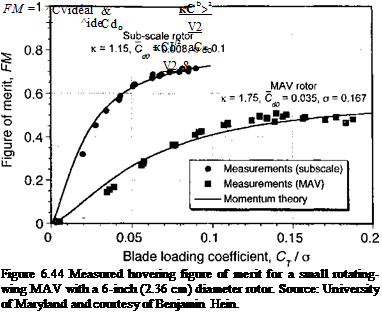
The measured hovering performance of this MAV is shown in Fig. 6.44 in terms of figure of merit (FM) as a function of blade loading coefficient. Notice the relatively low value of maximum FM obtained by the MAV (about 0.5) compared to a larger ro­tor (about 0.75), even at subscale. This loss of performance can be modeled within the context of the momentum theory with a nonideal wake contraction, as discussed for the ducted fan in Section 6.10.1. The ideal induced power coefficient for the MAV can be written as

Подпись: ,3/2

Hovering Micro Air Vehicles

(6.56)

where aw is the wake contraction parameter. Note that aw = 0.5 for an ideal rotor with a 2:1 wake area contraction and aw = 1 for an ideal ducted fan with no wake contraction. In the case of the MAV, aw < 0.5 and is probably close to 0.25 based on the flow visualization shown in Fig. 6.43. Using Eq. 6.56 allows the figure of merit for the MAV to written

Hovering Micro Air Vehicles Подпись: (6.57)

in the conventional way as

In this case the value of к is about 1.75 based on the asymptotic value of the measured FM curve, and ^ 0.035 based on low Reynolds number airfoil data (Fig. 7.4). Figure 6.44 shows that the momentum theory compares well with the measurements, but only if the wake contraction parameter, aw, is set to about 0.25. This confirms that because of the thick viscous wake losses the MAV rotor behaves as if it were being operated at a much higher disk loading, and combined with a high induced power factor and large profile drag, this gives the MAV relatively poor efficiency compared to a rotor operated at larger scale. This makes the value of rotating-wing MAVs less attractive because they require higher power with the result of reduced payload, range, and endurance. It is likely that future advances in understanding extremely low Reynolds number aerodynamics will lead to the improved viability of the rotating wing MAV concept. Already novel ideas such as blade surface heating-cooling or the application of Gurney naps are showing some promising results but with dubious gains in net vehicle performance – see Kim et al. (2003) and Nelson & Koratkar (2004). One key to improved performance obviously lies within the viscous dominated wake structure and the need to reduce induced losses not just profile losses.

As a consequence of these poor efficiencies, the flapping wing MAV concept has received some attention [see Woods et al. (2001)], and this seems to offer the potential of developing MAVs with improved hovering performance capability at these very low flight Reynolds numbers. The reasons are apparent from studies of autorotating seeds [Azuma & Yasuda

Hovering Micro Air Vehicles

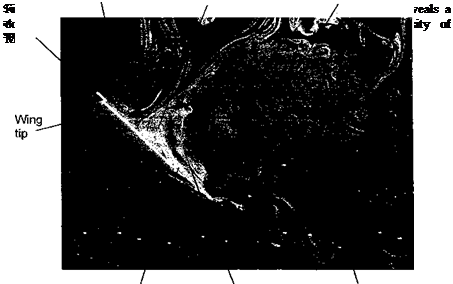
(1989)] and also measurements on flapping wings themselves – see review by Sane (2003). While showing only average lift-to-drag ratios in the range of 2 to 4, the ability to generate maximum lift coefficients of 2 or more is of considerable significance for low Reynolds number flight. However, it would be naive to conclude that somehow flapping wings were more aerodynamically efficient than a rotor and, therefore, are more well-suited for low Reynolds number flight. The physics of flapping wing aerodynamics is extremely compli­cated because it involves unsteady aerodynamic effects, large regions of flow separation and the production of highly vortical flows; see Sane (2003), Lehmann (2004), Singh et al. (2005), and Ramasamy et al. (2005). An example of flow visualization that was conducted on a small flapping wing vehicle is shown in Fig. 6.45, which clearly reveals leading-edge and mid-chord vortical structures that augments wing lift. These are not stable structures and are cast off the wing continuously for much of the flapping cycle. A stronger “starting vortex” is cast off as the wing rotates about its pitch axis (supination) and as it changes its direction for the second half of the flapping cycle. The process is repeated when the wing direction reverses again at the other end of the stroke (pronation). This vortical shed­ding process in many ways resembles the problem of dynamic stall, which is discussed in Chapter 9, although the low aspect ratios of typical flapping wings makes the problem considerably more 3-D than found even on helicopter rotor blades. The flapping process also continuously trails a pair of tip and root vortices into the wake that are laid down as a set of folded, interacting wake structures, a structure it seems that is difficult to generalize. Zbikowski (2002) suggests that some prediction capability of the unsteady aerodynamic forces on flapping wings might be achieved using unsteady thin airfoil theory (such as the methods given in Chapter 8), but the extremely nonlinear nature of the problem clearly offers considerable opportunities for new research.

Human-Powered Helicopter

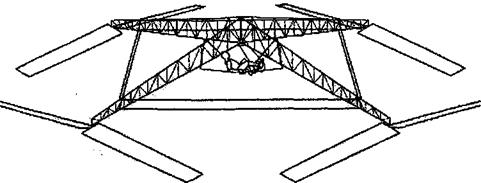
The problem of designing a human-powered helicopter (HPH) is not a new one, with some good theoretical studies being performed by Kendall, (1959), Naylor (1959), and Shenstone & Whitby (1959). In 1981, the American Helicopter Society (AHS) first offered a $20,000 prize [see Sopher (1997)] for the first successful controlled flight of a HPH. As of 2005, the prize remains unclaimed. The AHS’s requirements for the HPH dictate that the machine must lift itself and the pilot off the ground without the use of any stored energy devices, climb to a height of 3 m (9.84 ft) and be in flight for 1 minute while maintaining horizontal flight position within a 10 m (32.81 ft) square. A slow descent is allowed after the maximum height is reached. There have been two notable attempts to do this – one in Japan [see Naito (1990) and Fig. 6.41] and one in the United States at California Polytechnic Institute [see Mouritsen (1990)]. Both of the machines were driven by tip mounted propellers, very much like the early Brennan machine (see Fig. 1.13) so requiring no anti-torque devices, and had rotor diameters of over 100 ft (30.48 m). The pilot delivered power from a chain and sprocket system through a cable transmission to the propellers. The current flight record by the US team is 8 seconds at a maximum altitude of

0. 203 m (8 in) and the Japanese team holds the duration record of 19 seconds, both attempts which are far from meeting the AHS’s requirements. In the late 1990s, there were only two active HPH projects, one at the University of Michigan and the other at the University of British Columbia.

Patterson (1986) gives a good overview of the technical and practical issues in building a HPH. While the choice of strong lightweight materials and the constmction of a suitable HPH is one technical barrier, much of the problem has to do with the limits of human physiology. For an endurance of 1 minute an athletic human can be expected to deliver a power of between 0.67 hp and 0.8 hp (500-600 W) and perhaps up to a peak of 1.34 hp

Human-Powered Helicopter

Figure 6.41 An example of a human power helicopter concept, in this case the Yuri I design built at Nihon University in Japan.

(1,000 W) for a duration of 10 seconds. This means that a net possible energy expenditure of a human before exhaustion is about 34.1 BTU (36 kJ). Based on these power expectations it is possible to proceed with the conceptual design of a rotor to accomplish the AHS’s requirements. The design problem has been recently considered in some detail by Filippone

(2002) . The minimum power to hover a vehicle of weight W out of ground effect (OGE) will be given by the modified momentum theory (Chapter 2) where

1 Wъ'[22] [23] 1 W3/2

P0GE ~————– ‘ =————————- — – -. (6.52)

FM JlpA

5 vCwiisc the most optimistic average power output is known (Pavaii = 0.8 hp) the foregoing equation can be rearranged to solve for the rotor radius R giving

considered. Fradenburgh (1960) reports on measurements made with rotor height/diameter (h/D) ratios as low as 0.05, and Prouty (1985) gives a summary of other ground effect measurements. Reductions in induced velocity IGE of more than 60% seem possible for a large rotor in very close proximity to the ground. This favorable IGE effect will result in a lower effective disk loading (higher effective disk area) and so a smaller rotor can be built to meet the same requirements. The rapid loss in the benefits of IGE operation, however, are found for h/D > 0.4. Therefore, for the HPH to remain IGE throughout its flight for good aerodynamic efficiency, a balance between the choice of rotor diameter and hovering IGE benefits must be sought.

Подпись: req Подпись: Phover ( 1 ~F _ I — Phover T" APreq, 2vh' Подпись: (6.54)

Proceeding further by assuming such a rotor could be built and hovered in ground effect, it is interesting to evaluate whether sufficient human energy is available to climb a HPH to 3 m and then to hover there (i. e., further out of ground effect) for a period of time. The power to climb vertically can be established from the results in Chapter 2. Assuming low rates of climb then the extra power required to overcome induced losses and also increase potential energy will be

Human-Powered Helicopter Human-Powered Helicopter Подпись: (6.55)

where Vc is the climb velocity and A Preq is the excess power required to climb. The extra energy expended during this process is

if Vc is assumed to be constant. This means that the excess energy available to climb to the required altitude can either be expended quickly by climbing at a higher rate or slowly by climbing at a low rate. If the maximum extra power that is humanly possible is assumed to be 0.25 hp (0.186 kW) for a duration of 10 seconds (equivalent to an energy of 1.768 BTU or 1.86 kJ) then a maximum climb velocity of about 1.85 ft/s (0.56 m/s) is possible, reaching the required altitude in about 5 seconds. A subsequent hover for 55 seconds would consume at least 31 BTU (32.6 kJ), clearly to the point of human exhaustion. Alternatively, a slower climb over 60 seconds will need a climb velocity of only 0.164 ft/s (0.05 m/s) using a total energy of about 34.8 BTU (36.7 kJ), but this again is right at the limits of human endurance. Even if such a flight could be performed by a super-athlete, the final stages of the flight will require the aircraft to descend and possibly autorotate to the ground. Of interest is that because of the extremely low induced velocity through the rotor, even a modest rate of descent may take the rotor into the vortex ring state. This will require the machine to have good control capability, although it would seem that with kinesthetic (weight shifting) alone this may be insufficient.

In conclusion, it would seem that the design of a HPH to meet the AHS’s requirements is feasible but probably not yet practical. This is in part because of the enormous size and structural difficulties in building rotor to give the low power requirements that are necessary to match the physiological capabilities of even the most athletic, super-fit human. Also, it would seem that the assumed aerodynamic efficiencies of such large, slow turning rotors are unlikely to be realizable, even operating IGE. Some means of effective flight control will also be required for such a vehicle to stay within the within the defined 10 m (32.81 ft) box, although it would seem that apart from some allowance for kinesthetic control this aspect of the problem has received little attention from designers. The design of a HPH, however, will continue to be a problem that will fascinate generations of engineers for many years to come.

Smart Rotor Systems

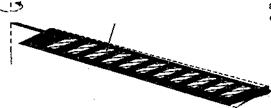
A “smart” structure is one that involves distributed actuators and sensors, along with a computer to analyze responses and apply displacements or strains to change the characteristics of the structure in an adaptive and beneficial way. Smart structures make it possible to aerodynamically alter the properties of rotors in a desirable way so as to reduce vibrations, improve performance, and enhance other performance factors. Such alterations would include the use of actively controlled aerodynamic surfaces on the rotor, such as with trailing-edge flaps (Fig. 6.40) or an all-movable blade tip or with strain producing actuators embedded in the blade to create elastic deformations. The field is reviewed by Chopra (1997, 2000). While the technology is not yet mature, various concepts are developing quickly, and it is likely that a full-scale helicopter rotor incorporating one or more new smart technologies will fly early in the twenty-first century.

Much of the work in this field has so far focused on building and testing dynamically scaled smart rotor models. The actuation concepts are presently difficult to build at full-scale without excessive weight and power penalties, but this will change as further research is conducted. Many of these rotor models consist of controllable twist blades, incorporating embedded piezoelectric elements or trailing-edge flaps (Fig. 6.40), actuated by piezoce­ramic or magnetostrictive actuators. The performance of the actuation systems seems to be degraded dramatically at higher rotational speeds because of high dynamic pressure, centrifugal forces, and frictional moments on the actuation mechanisms. For trailing-edge flap designs, a compact torsional actuation technique is required, and several approaches have been examined. For controllable twist designs, banks of piezoceramic elements are embedded under the skin of the blade on the top and bottom surface. To induce sufficient

(a) Active blade twist rotor concept

; Q Active piezoelectric piles embedded in blade

Подпись: ElasticПодпись: (b) Active trailing edge flap rotor conceptSmart Rotor Systems/— structure to generate torsional twisting L" / about the elastic axis of the blade
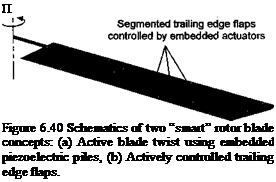
Подпись: П Figure 6.40 Schematics of two “smart” rotor blade concepts: (a) Active blade twist using embedded piezoelectric piles, (b) Actively controlled trailing edge flaps.

axis

blade twist for active control of rotor vibration or noise, a large number of distributed piezo­ceramic elements are required. Although this system involves no moving parts, it incurs a significant weight penalty and gives an undesirable increase in blade stiffness. There are also structural integrity issues.

Straub (1995) and Straub & Merkley (1995) have carried out a feasibility study of using smart structures technology for primary as well as active control of a full-scale helicopter rotor. It was concluded that the concept of blade twist and profile camber control using embedded actuators is not practical with the types smart materials currently available. Servoflap control systems using on-blade smart material actuators appeared conceptually feasible for primary and active controls. Shen et al. (2003) have examined the idea of trailing edge flaps for the primary flight control of an ultralight helicopter. So far there has been limited research towards the development of analytical tools need for a smart rotor design. Recently, however, there has been some effort to develop a coupled actuator-flap – rotor dynamic analysis, but it is far from being as comprehensive as would be required for confident design use. The development of unsteady aerodynamic models for this purpose have also undergone substantial development – see Section 8.18 – and the proper modeling of unsteady aerodynamic effects is vital to the predictive success of analytical tools for smart rotor systems. While it is clear that the smart rotor technology is not yet mature, either from a theoretical or practical perspective, various concepts are developing quickly and it is likely that a full-scale helicopter incorporating one or more of these technologies will fly within the next few years. It would seem, however, that full flight certification of actively controlled rotors for use in production helicopters is a longer way off.