Category Principles of Helicopter Aerodynamics Second Edition

Vortex Ring State (VRS)

The phenomenon of vortex ring state (VRS) has been previously mentioned in Section 2.13.6. Under descending flight conditions at high rates or at steep descending flight path angles, helicopter rotors can begin to operate in this adverse flight condition. For VRS to occur, the upward component of velocity normal to the rotor disk plane must be a substantial fraction of the average induced velocity downward through the rotor disk. In the VRS the wake vorticity produced by the blades cannot convect away from the rotor. Instead, the wake accumulates near the rotor plane, clumping or bundling together forming a violent, unsteady flow condition that is analogous to flight in a “vortex ring” – see Fig. 2.21. An early effort to analyze the VRS problem for a helicopter rotor was made by de Bothezat (1919).

Entry into the VRS manifests as rotor thrust fluctuations and also an increase in the average rotor-shaft torque (power required), the latter which is necessary to overcome the higher induced aerodynamic losses associated with rotor operations inside its own blade wake. Most helicopters do not have a lot of excess power available at low airspeeds, so the extra power required to overcome these additional induced losses can be of sufficient magnitude to negate the decreased rotor power requirements associated with giving up altitude (potential energy). Therefore, when in the VRS, the application of high rotor torque (power) may be required to maintain equilibrium flight, even though the aircraft is rapidly descending. This scenario is often referred to by pilots as “power settling” or “settling with power” and can be a safety of flight issue – see Vames et al. (2000). These latter terms, however, are not accurate descriptors of VRS conditions because such “settling” issues can

Подпись: ІОА АЛАПГmaw «nder operational flight conditions when VRS is clearly not present, such as when a helicopter transitions from hover into forward flight while in ground effect (see Section 5.8) or climbs out of ground effect at high gross weights or high density altitudes.

Autorotation Index

It is clear that the autorotative performance of a helicopter depends on several interrelated factors. These include the rotor disk loading (which affects the descent rate), the stored kinetic energy in the rotor system (which influences the probability of success of entry and completion of the autorotational maneuver), as well as subjective “difficulty rating” flight assessments by pilots. To help select the rotor diameter during predesign studies, an “autorotative index” is often used. Although various types of indices have been used [see White et al. (1982) for a summary] the autorotation index is basically a stored energy factor. One form of the index can be defined in terms of the ratio of the kinetic energy of the main rotor to the gross weight of the aircraft, that is,

Подпись: (5.92)R&2

m

Подпись: AI Подпись: IRV2 2 WDL Подпись: (5.93)

which is used by Bell – see Wood (1976). An alternative autorotative index used by Sikorsky, which is weighted by disk loading [see Fradenburgh (1984)] is

Autorotation Index Подпись: (5.94)

These indices may be modified to reflect the effects of higher density altitudes by using, for example, with the latter index

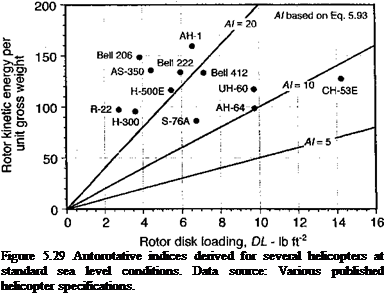
Подпись: Figure 5.29 Autorotative indices derived for several helicopters at standard sea level conditions. Data source: Various published helicopter specifications.

Figure 5.29 shows the autorotative index for several helicopters, which have been cal­culated using Eq. 5.93 based on published information for each helicopter. These indices are of great use in the sizing of the main rotor or in examining the effects on autorotative characteristics with increasing gross weight or density altitude. Note that the absolute values of the index are of no significance by themselves, but the relative values provide a means

of comparing the autorotative performance of a new helicopter design against another he­licopter with already acceptable autorotative characteristics. An index of about 20 would normally be considered acceptable for single-engine helicopters. A multi-engine helicopter can have a lower index and still have safe flight characteristics in the event of a single engine failure because any initial decay in rotor rpm is soon picked up by increasing torque from the remaining engine(s).

The autorotative characteristics of the helicopter may also be expressed in terms of equivalent hover time – see Wood (1976). This is the time that the stored kinetic energy in the rotor system can supply sufficient equivalent power to hover before the rotor rpm decays to the point that stall occurs (see previous discussion on page 245). This “equivalent time” parameter seems to correlate well with pilot opinion of autorotative characteristics – see Prouty (1986) for a summary. Based on the results of Wood (1976), a helicopter with an equivalent hover time of 3 or more seconds is ideal but rarely possible, but a goal for a new helicopter will be to design for at least half of this value to assure sufficient margins in autorotational capability to be safe for an average pilot.

Height-Velocity (H-V) Curve

In a survey of helicopter accidents conducted by Harris et al. (2000), it was found that out of8,436 accidents, 2,408 accidents occurred because of the loss of engine power. Out of these 2,408 accidents, about half were a result of fuel exhaustion. Nine hundred thirty-five accidents resulted in substantial damage to the helicopter and 445 helicopters were com­pletely destroyed. Besides the tragic loss of lives, such statistics are certainly not acceptable from an engineering standpoint and clearly emphasize the need for better helicopter designs with adequate single engine out performance and safe autorotational landing capability.

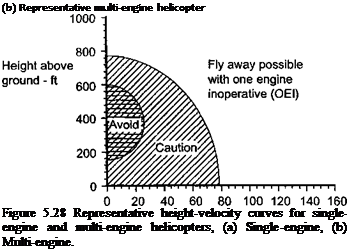
The flight conditions that will allow safe entry to an autorotation and recovery of the helicopter are summarized in the form of height-velocity or “H-V” curves. These are often called “deadman’s” curves, for obvious reasons. Figure 5.28 shows representative examples of the H-V curves for single-engine and multi-engine helicopters, which are typical of the information included in the aircraft flight manual. The curves that define the “avoid” regions are established though systematic test flights prior to certification of the helicopter. The tests are conducted at altitude relative to a virtual “floor” by incrementally approaching the

Подпись: (a) Representative single engine helicopter 1000

Подпись:Подпись:Подпись:Height-Velocity (H-V) CurveNote: Avoid region means avoid continuous operations

Unsafe region near ground

І і і 14’Vi‘i‘r і г і І’тті і і і і і і і i-|

40 60 80 100 120 140 160

Подпись: (b) Representative multi-engine helicopter Figure 5.28 Representative height-velocity curves for single-engine and multi-engine helicopters, (a) Single-engine, (b) Multi-engine.

Indicated airspeed – kt

Indicated airspeed – kt

combinations of airspeed and altitude where acceptable autorotational capability becomes questionable on the basis of pilot opinions, that is, a difficulty rating. The engineering results are then corrected for different helicopter gross weights and density altitudes, and charts made for the flight manual. For flight anywhere outside the avoid region the pilot should be able to safely recover the helicopter through an autorotative maneuver in the event of a flight emergency. While flight in the avoid region is not prohibited, its boundaries dictate the conditions where sustained flight operations should be avoided less there be an engine failure.

The actual size and shape of the H-V curve depends on many factors, including the characteristics of the helicopter, its gross weight, and operational density altitude [see Pegg

(1968) ]. As shown in Section 2.13.7, the disk loading Т/A is the primary factor influencing the autorotative rate of descent. The number of engines installed in the helicopter will also affect the shape of curves because flight operations (but at (reduced performance) are possible, so multiple curves may be defined for single – and multi-engine operations. Note that for a single engine helicopter there are two unsafe regions defined by the H-V curve. The avoid region at low altitude and high airspeeds determines the minimum altitude below which translational kinetic energy cannot be converted into potential energy by means of a zoom-climb prior to entering the autorotation. This boundary is also marked to prevent unsafe operations close to the ground. The most important avoid region is obviously, however, at low airspeeds.

The bottom part of the H-V curve is defined as the lowest height from which a successful autorotation can be performed from a full-power climb out, with some prescribed allowance for pilot reaction time, that is, the time between the power failure and the reduction in col­lective pitch. Military and civil requirements usually differ, so that the limits of the curve will also vary with the model of helicopter. The FARs require a 1-second delay, whereas the military require 2 seconds to allow for the typically higher workload of military pilots. To establish the lowest portion of the H-V diagram (zero airspeed) it is normally assumed that this is the height above which a vertical power off landing cannot be made with damaging the aircraft. Under these conditions the pilot will rapidly increase collective pitch to cushion the landing at the expense of a rapid decay in rotor rpm. The top portion of the H-V curve is established for level flight power conditions, again by including some prescribed pilot reaction time. If a power or mechanical failure occurred at this combination of altitude and low airspeed the pilot would normally dive the helicopter to gain airspeed at the expense of altitude while attempting to maintain rotor rpm with collective, followed by a flare with aft cyclic pitch as the ground is approached. Emergency descents from points near to the “avoid” region always requires a high level of piloting skill.

Reducing the size of the avoid region is obviously desirable from an operational point of view but is generally difficult from an engineering perspective. Helicopters with low disk loading will tend to have a much smaller avoid regions; hence the autorotative characteristics of the helicopter usually enter into the basic sizing and design of the rotor (see Section 6.4.1). Increasing the stored rotational kinetic energy by adding blade mass is one possibility, but this is not desirable as it will be at the expense of higher blade stresses and a lower payload. For a multi-engine helicopter the unsafe or avoid region shrinks considerably, as shown in Fig. 5.28(b). For twin-engine helicopters, the avoid region diminishes to the point where there is only a slight chance that a fly-away or safe autorotation could not be performed. For three-engine helicopters the avoid region essentially disappears in the event of a single engine failure. However, there will always be some avoid regions marked on the H-V diagram in the event of a tail rotor failure, which will require an autorotation to be performed no matter how many engines are installed.

Autorotation in Forward Flight

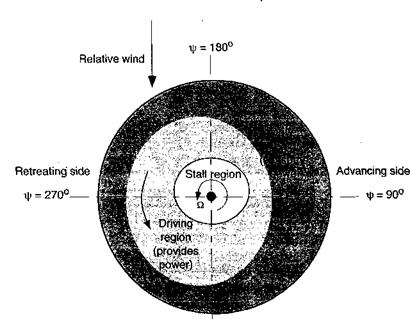
The autorotative energy balance in forward flight is basically the same as for vertical flight. However, because of the forward flight velocity there is a loss of axial symmetry in the induced velocity and angles of attack over the rotor disk. This tends to move the distribution of parts of the rotor disk that consume power and absorb power, as shown in Fig. 5.26. The stalled region may become biased toward the retreating side of the disk. However, the basic physics of the autorotational problem remains unchanged. Estimates of the autorotative rate of descent in forward flight can be made using the power equation given in terms of the momentum and blade element theories. While at low airspeeds autorotation takes place in the turbulent wake state, which is not strictly amenable to analysis by momentum theory without empirical correction, with some forward speed the flow state becomes much smoother. This means that the standard power equation can give results that are sufficiently accurate for engineering estimates of the rate of descent in autorotation as long as averaged flow properties are considered.

Подпись: кСу/ 2 y/p? + X2 Autorotation in Forward Flight Подпись: (5.90)
Autorotation in Forward Flight

In an autorotation Cq = 0, so that to a first approximation (and neglecting the tail rotor) to the rate of descent and finding the speed to fly for minimum rate of descent we can use a rearrangement of the power equation (e. g., Eq. 5.53) to give

This equation applies down to descent angle and high rotor disk AoA, where the induced velocity through the rotor then needs to be modeled empirically – see also Section 12.8. The result for the rate of descent would normally be expressed in ft/min so that Vj = 60Xd&R.

Autorotation in Forward Flight

яр = 0°

Figure 5.26 Autorotative torque distribution over the rotor disk in forward flight.

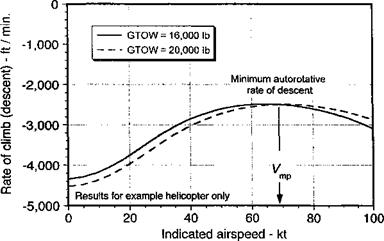
Representative results for the autorotative rate of descent in forward flight based on the use of the power equation are shown in Fig. 5.27. The shape of the curve mimics the power (or torque) required curve for steady level flight, as shown previously in Fig. 5.10 – see also Gessow & Myers (1947) and Wheatley (1932). Note the extremely high rates required at very low airspeeds, but for near Утр (airspeed for minimum power under normal flight conditions), the rate of descent is reduced to about half the value required in axial (vertical) flight. Therefore, should a problem arise that requires the pilot to put the aircraft

Autorotation in Forward Flight

Figure 5.27 Estimates of rate of descent in autorotation for example helicopter.

It is likely that an actual autorotation will have to be performed away from the vicinity of an airport, and maximizing the time to complete the descent is essential for choosing a suitable landing area. Although the autorotative rate of descent is always high, the actual autorotative entry is a relatively safe and benign maneuver from the pilot’s perspective when sufficient altitude is available. The final stages of the autorotation happen more quickly, however, and require great piloting skill. At about 50 ft (17 m) from the ground, the pilot must begin to decelerate the helicopter. This is done by slowly pulling up on the collective pitch (increasing blade pitch angles and so initially increasing rotor thrust), while simultaneously pulling back on the cyclic to flare the helicopter, increase the disk AoA, and reduce forward speed. As the collective pitch is increased, the unpowered rotor rpm will reduce quickly and so the pilot must ensure that the collective is brought in progressively and at a rate that still allows the rpm of the unpowered rotor to stay within acceptable values to produce thrust and prevent blade stall. Increasing the disk AoA to give the helicopter a steep nose-high attitude in the flare will tend to maintain rotor rpm as the component of forward velocity normal to the disk plane now helps to maintain the rotor in autorotation. The probability of success or otherwise of the resulting attempt at autorotation depends on many factors, including the exact pitch and roll angle of the helicopter when engine or mechanical failure occurred, overall pilot workload and the need to maneuver the helicopter as much as possible “into wind” to minimize ground speed at touchdown, and the need to find a suitable landing site free of obstructions.

Подпись: into an autorotation, the airspeed should be immediately increased or decreased to Утр to enable the lowest possible rate of descent. For example, if there is a mechanical problem in high-speed forward flight, the pilot would immediately pull back on the stick (application of longitudinal cyclic), to gain some additional altitude (zoom-climb) and lose airspeed, before quickly lowering the collective and entering the autorotation before the rotor rpm begins to decay. Autorotations performed at or near Fmp will give the pilot more time to diagnose and even try to correct a possible engine problem. When established at the minimum rate of descent, the pilot will also have the maximum possible time to select a suitable landing site.
Autorotation in Forward Flight
Autorotation in Forward Flight Подпись: (5.91)

It will be apparent that the time constant r in Eq. 5.89 will also govern the decay of the rotor rpm as the pilot raises the collective pitch and uses cyclic pitch to flare the helicopter. Because a reduction in rotor rpm also decreases rotor thrust, the consideration of rotor stall margins are also important here. Because rotor thrust is essentially proportional to £22 the lowest acceptable rotor rpm (£2staii) can be determined by using

where the A(Cr /cr)stall is the stall margin in terms of blade loading coefficient. Even though the stall margin on most helicopters at high gross weights is relatively modest, the allowable decay in rotor rpm during the flare maneuver is fairly generous while still avoiding stall. However, even without blade stall as an issue, the rotor rpm must also be maintained to avoid excessive blade flapping from flapwise blade inertia loads, especially as the helicopter touches down. There have been several serious accidents during the autorotative maneuver as a result of the pilot allowing low rotor rpm and so producing excessive blade flapping, which can cause the blades to strike the airframe. The overall objective for the pilot is to cushion the rate of descent such that the helicopter touches down with a rate of descent of less than about 10 ft s-1 (~ 3 ms-1) with minimal forward speed.

Autorotational Performance

The autorotation maneuver has been discussed in Section 2.13.7 and is defined as a self-sustained rotation of the rotor without the application of any shaft torque from the engine (i. e., Cq ~ 0). Under these conditions, the power to drive the rotor comes from the relative airstream upward through the rotor as the helicopter descends through the air.

Autorotation is used as a means of recovering the safe flight helicopter in the event of a catastrophic mechanical failure, such as engine, transmission, or tail rotor failure. The ability to autorotate is, therefore, a safety of flight issue. Under established autorotative conditions, there is an energy balance where the decrease in aircraft potential energy per unit time is equal to the power required to sustain the rotor speed. In other words, the pilot gives up altitude at a controlled rate in return for energy to turn the rotor to keep it producing thrust. Recall from Section 2.13.7 that an autorotation at low forward flight speeds will take place in the turbulent wake state where the flow is not smooth and leads to a certain amount of unsteadiness at. the rotor. At higher forward speeds the flow through the rotor tends to be smoother in the autorotational condition.

Consider now the flow environment encountered at a blade element on the rotor during a descent, as shown in Fig. 5.24. Although most autorotations are conducted with some forward speed, first consider a vertical autorotative descent with no forward speed. In an autorotation, the inflow angle ф must be such that there is no net in-plane force and, therefore, no contribution to rotor torque, that is, for this station on the blade,

dQ = (D – фЬ)у dy = 0. (5.82)

However, this is a condition that can only exist at most at two radial stations on the blade. In general, some stations on the rotor will absorb power from the relative airstream and some will consume power such that the net power at the rotor shaft is approximately zero. With

/2-

Подпись: УуПодпись: Accelerating torqueПодпись: Decelerating torqueAutorotational PerformanceПодпись: At section y2 net negative in-plane force (consumes power) Section ІП/ autorotational At section ул equilibrium

net positive in-plane force (delivers power to rotor)

Driving force
*] Thrust force

Подпись:Autorotational PerformanceПодпись:Подпись: UpflowПодпись: In-plane velocity at у2Подпись: Relative windПодпись:Autorotational PerformanceRelative wind

NOTE: Angles exaggerated for clarity

Подпись: ф — tan Autorotational Performance

the assumption of uniform inflow over the disk, the induced AoA is given by

It follows that the induced angles of attack over the inboard stations of the blade are high, and near the tip ф is low. Therefore, we find that at the inboard part of the blade the net AoA results in a forward inclination of the sectional lift vector and is such that in this region there is now a negative induced drag component that is greater than the profile drag. Therefore, this blade element absorbs power from the airstream to the rotor. At the tip of the blade where ф is low, these sections consume power because, as a result of the forward inclination of the lift vector, the propulsive component is insufficient to overcome the profile drag. The effect is summarized in Fig. 5.24. The consequences are that after initial autorotational equilibrium is obtained, variations in rotor thrust, inflow, and so on, will cause rotor rpm (£2) to adjust itself automatically until autorotational equilibrium is again obtained. Generally, autorotation is a stable equilibrium point because if Q increases, ф will decrease and the region of accelerating torque will decrease inboard, and this tends to decrease rotor rpm. Conversely, if the rotor rpm decreases then ф will increase and the region of accelerating torque will grow outward.

Подпись: M a ► 0max ►]

Consider the autorotation diagram shown in Fig. 5.25, where the blade section Cd/Ci is plotted versus AoA at the blade section. This is a form originally used by Wimperis (1928). Both Nikolsky (1944) and Gessow & Myers (1952) describe rotor equilibrium at the blade element in terms of this interpretation, which is relatively useful for a further understanding

Figure 5.25 Autorotative diagram used to describe equilibrium conditions at the blade element. Adapted from Gessow & Myers (1952).

Подпись: Cd — фС[ = 0 or Autorotational Performance Подпись: (5.84)

of the phenomenon. For a single section in equilibrium recall that

where 6 is the blade pitch angle. For a given value of blade pitch angle, в, and inflow angle ф, the previous equation represents a series of points that form a straight line, which is plotted on Fig. 5.25. The intersection of this line with the measured Q/Q data at point A corresponds to the equilibrium condition where ф — Cd/Ci. Above this point, say at point В, ф > Cd fCr, so this represents an accelerating torque condition. Point C is where Ф < Cd/Сг, this represents a decelerating torque condition. Note that above a certain pitch angle, say 0max, equilibrium is not possible and so for operation at point D stall will occur causing the rotor rpm to decay.

Establishing stable autorotational flight requires a certain level of skill from the pilot. The rotor rpm and the rate of descent can be controlled by the pilot by means of judicious adjustment of the collective pitch setting. The cyclic pitch is used to control the airspeed. The collective controls the mean blade pitch (and hence the mean aerodynamic angles of attack at the blade sections) and, therefore, the blade mean lift, drag, and rotor rpm. In an autorotation the collective pitch is always held at a low value. The inboard parts of the rotor blades always operate at high angles of attack during the autorotative descent. Therefore, the pilot must ensure that the collective pitch angle is kept low enough to prevent stall propagating out from the blade root region, which will tend to quickly decrease rotor rpm because of the high profile drag associated with stall.

The initial stages of the autorotative maneuver are the most critical. During these initial stages, the pilot must sharply lower the collective pitch setting from the normal flight value to prevent blade stall and a rapid decay in rotor rpm. Both military and civil certification requirements impose a finite time delay (usually a few seconds) to account for normal pilot reaction time before the collective pitch is lowered; thus there is always some safety margin imposed in all helicopter designs – see Prouty (1986). However, in most cases the pilot must still react sufficiently quickly to ensure that the rotor rpm does not decay below acceptable margins, this usually being only a matter of seconds.

Подпись: dQ Autorotational Performance Подпись: (5.85)

How quickly the rotor rpm decays is a function of the power required at the time of failure and the rotational kinetic energy of the rotor. Stewart & Sissingh (1949), Newman (1994), and Johnson (1980) give a good summary of this problem, although an approximate but accurate analysis is given by McCormick (1956). The equation of motion for the decay of the rotor rotational speed with time t after the removal for the shaft torque at time t = 0 is

Autorotational Performance Autorotational Performance

where Ir is the net inertia of the rotor system and the subscript 0 refers to time t = 0. This assumes that the helicopter does not reach an appreciable rate of descent or that the collective pitch is changed. The minus sign on the right-hand side of the foregoing equation denotes a decelerating torque. Integrating Eq. 5.85 by means of separation of variables gives

Подпись: Vd(0 = gi Подпись: t + IR£2Q/QO Подпись: = gf Подпись: t + r Подпись: (5.88)

and the corresponding buildup in rate of descent is

Autorotational Performance Подпись: (5.89)

The time constant т is

Notice that KEq is simply the rotational kinetic energy of the rotor at t = 0. This means that rotors with higher initial levels of stored kinetic energy and lower power requirements (i. e., rotors with the lowest disk loading) will have the slowest rate of rpm decay after the removal of shaft torque and the slowest initial rate of descent. See also Section 5.6.3.

Generally, values of r are found to vary from as low as about 1.5 seconds for the biggest and heaviest helicopters to about 4 seconds for the smallest and lightest helicopters. This means that for a typical helicopter the time for the rotor rpm to decay significantly is at most only a few’ seconds, and so the pilot’s reaction to engine or transmission failure must be almost immediate. In the first instance, this will require a rapid reduction of collective pitch. In the second instance, the pilot will generally use cyclic pitch to seek the forward flight airspeed that will give the lowest autorotational rate of descent.

The safe rpm range in autorotation for most helicopters is usually between 80 and 120% of the normal rotor rpm, which is controlled by the pilot primarily by using collective pitch. If the rpm becomes too low, the rotor will begin to stall and excessive blade flapping will also occur because of reduced centrifugal effects on the blades. Conversely, if the rotor rpm becomes too high, then structural overload becomes a concern.

Performance of Coaxial and Tandem Dual Rotor Systems

The hovering performance of coaxial and tandem rotors has been previously dis­cussed in Section 2.15.1. By accounting for the induced interference effects between the rotors, it has been shown that the relationship between power and thrust can be adequately

Performance of Coaxial and Tandem Dual Rotor Systems

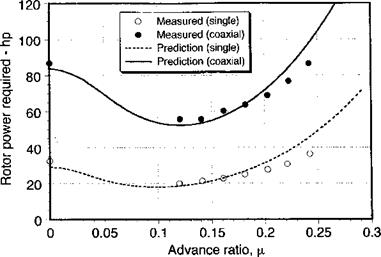
Figure 5.22 Predictions of power in forward flight for single and coaxial rotor system compared to measurements. Data source: Dingeldein (1954).

estimated using a variation of the simple momentum theory. The power required for a coaxial rotor system operating in forward flight at a constant thrust coefficient and over a range of advance ratios is shown in Fig. 5.22. The experimental data are taken from Dingeldein (1954). The predictions were made using the extension of simple momentum

4-і____ ——————- 1 апллл,»«^ fVx*.

шсшу iu luiwaiu infill, wiiu uic сіюсіь ui jnuiuc; lusdoa a^^uumtu ivn uuuugu tut/ uiau^

element theory, in the same manner used previously for the single rotor. The single rotor had a solidity of 0.027 and the coaxial rotor had a solidity of 0.054. An equivalent flat-plate parasitic drag area of 10 ft2 was used to define the propulsive force component, along with Cdg = 0.01, к — 1.15, and кт = 1.16, the latter being derived from the hover case and assumed to be valid also for forward flight.

For both the single and coaxial rotors, the predictions in Fig. 5.22 compare favorably with the measurements, although there is a slight over prediction of power at the highest advance ratios. It is clear that for the coaxial configuration, there is a higher overall power requirement than for an equivalent single rotor. This is because of the interference effects between the two rotors. Also, the higher overall parasitic drag of the two hubs and dual control linkages (see Fig. 4.13) make a coaxial rotor aerodynamically less efficient than a single rotor system. However, this negative aspect can be outweighed by the overall reduced rotor size and compactness of the coaxial rotor helicopter design.

The forward flight performance obtained with a tandem rotor configuration is shown in

Iji/y С О О лі/чмґ» г» Wranb-rl/Mim tU а плигл«* **л/пп 1 na/I nannrnfalTi Frvr fVta frnnt on/1 root*

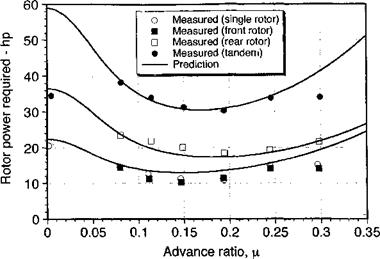
1 ig. aiuug wlLii <x uiV/Oivuuwїї иі uiu puwui luvjuiiuu oupmaiuij iui uiu num aiiu іиш rotors. There is no rotor overlap for this particular tandem configuration, with the rotor shafts being separated by 103% of the rotor diameter. Each rotor had a solidity of 0.027. The equivalent flat-plate area drag was 2 ft2. Note that the performance of the front rotor was almost identical to that of the single rotor, suggesting that in this case there is little or no interference produced on the forward rotor by the rear rotor during forward flight. This, however, may not be a general result that is independent of rotor spacing or relative difference in rotor height. Prediction of performance by means of the momentum/blade element theory is, therefore, of the quality expected based on previous studies with single rotors. The power

Performance of Coaxial and Tandem Dual Rotor Systems

Figure 5.23 Predictions of power in forward flight for a tandem rotor system compared

to measurements. Data source: Dingeldein (1954).

required for the rear rotor is considerably higher because it operates in the downwash generated by the front rotor[20] – see Heyson (1954). By computing the downwash from the front rotor, this can be used to redefine the flow environment encountered by the rear rotor. The induced power for the combination becomes

Pi = TFvif +KmTRviR, (5.81)

where TF and Tr are the thrusts of the front and rear rotor, respectively. An induced power interference factor, /cov, equal to 1.14 (see Section 2.15.2) was assumed for the rear rotor, for which the power required can then be estimated. For advance ratios of 0.1 and above, Fig. 5.23 shows that there is a good agreement between the predictions and the measurements. Note that because of the effects of the forward rotor, the minimum power required for the rear rotor is attained at a much higher advance ratio. Combining the results for the two rotors gives the power required for the tandem configuration. Agreement between prediction and experiment is generally good, except for low advance ratios approaching hover where the experimental results show a favorable interference effect. Based on the results shown previously in Section 5.5.11, this favorable effect seems unique to this tandem configuration and would not necessarily be expected for substantially overlapping tandem rotors.

Factors Affecting Maximum Attainable Forward Speed

Conventional helicopters are relatively low speed machines compared to their fixed-wing counterparts. The maximum flight speed will be determined by a combination of one or more of the following: 1. Installed engine power, 2. Airframe parasitic drag, 3. Gearbox (transmission) torque limits, and 4. Rotor stall and/or compressibility effects. Early helicopters were powered by reciprocating engines and were mostly limited in per­formance because of the lack of installed power. Reciprocating engines have relatively poor power-to-weight ratios and become extremely heavy when large amounts of power are re­quired. A reciprocating engine, on average, has a power-to-weight ratio of about 0.5 hp/lb (0.82 kW/kg), whereas a modem turboshaft engine has at least three times as much. Above a certain aircraft gross weight, it is inefficient to use reciprocating engines on helicopters.

As a result, on modern helicopters turboshaft engines are almost universally used because of their superior power-to-weight ratios. However, turboshaft engines have high acquisition and operating costs and are not usually found on small training helicopters. On turboshaft – powered helicopters, performance limits are dictated by allowable transmission torque. When it is necessary to transmit large amounts of torque to the rotor shaft, the transmission system becomes relatively heavy because of structural strength requirements, and so there is usually a torque limit imposed to minimize overall transmission weight. In this case, helicopter performance charts are usually presented in terms of indicated engine power or shaft torque versus indicated airspeed (e. g., Fig. 5.17).

Airframe drag constitutes a substantial impediment to high-speed flight. Therefore, the minimization of airframe drag has become a major issue in the design of a modern heli­copter. Over the past thirty years there have been progressive improvements toward reducing airframe drag and improving forward flight speeds and reducing fuel bum. A major drag producer at high forward speed is the rotor hub, especially because the blade hinges and controls are mostly all exposed to the airstream. Careful contouring of the fuselage in this region can significantly help reduce hub drag and control the extent and intensity of the separated wake behind the hub. More recently, there has been a shift to the use of hingeless or bearingless rotor hubs. Besides being mechanically simpler than conventional articulated rotor hubs, these types of hub designs are also aerodynamically cleaner and have a much lower equivalent flat-plate area.

On many helicopters, the maximum forward flight performance is limited by the aerody­namics of the rotor itself. This is because of the occurrence of one of two possible factors. First, high power (or torque) is required to overcome compressibility effects generated on the advancing side of the rotor disk. Second, retreating blade stall can produce sufficiently high blade loads and vibration levels to limit the flight speed. Compressibility effects man­ifest as wave drag as a result of the onset of transonic flow and the generation of shock waves. The intensity of the supercritical (transonic) flow may also progress to a point where the shock waves are sufficiently strong to promote rapid thickening of the local boundary layer, and it may even produce shock induced separation and stall. The approach of the rotor into these conditions is usually accompanied by a relatively gradual increase in power required or so-called power “creep” (see Section 5.4.3) with mild increases in vibration. However, the occurrence of retreating blade stall is often more sudden in its occurrence and is accompanied by high rotor vibration levels.

Finally, it will be apparent that an expansion of the flight boundary of helicopters to high flight speeds is limited by not only aerodynamic constraints, but also by aeroelastic and structural constraints as well. Usually, high stresses or intolerable fatigue loadings of the various structural components are limiting factors, particularly on the hub and pitch links. These vibratory stresses result from the generation of large unsteady aerodynamic loads on the rotor system, which is simply an undesirable outcome of pushing the rotor to its aerodynamic limits. The complex nature of these loads reflects the need to understand the highly unsteady aerodynamic flow field produced within the rotor disk, which is discussed in detail in Chapter 8.

Range—Payload and Endurance-Payload Relations

Range-payload and endurance-payload curves provide information of the effects of aircraft range and endurance when trading off payload for fuel. The specific mission for the aircraft must be defined, although most flight plans will involve a flight from point A to point B, as shown in Fig. 5.19. As previously explained, the engine characteristics must be taken into account to determine both the maximum endurance and maximum range. Fuel flow curves must be derived versus indicated airspeed and gross weight, and these depend on whether the helicopter is powered by reciprocating or turboshaft engines. Generally, the fuel flow curves versus airspeed (at a given density altitude) are fairly flat and so this alternative form of defining the performance curves closely follows the shapes of the power curves. McCormick (1995) lays down the basic range analysis for an aircraft, which can be adapted for the helicopter. The fuel bum, Wf, with respect to distance, R, will be

Подпись: (5.77)dWF P x (SFC)

dR V

Range—Payload and Endurance-Payload Relations
where SFC is the specific fuel consumption of the engine(s). The power required, P, varies with gross weight and density altitude and, as already shown, the SFC depends on power and density altitude. Because the weight decreases as fuel is burned, Eq. 5.77 must be integrated numerically to find the range. Fuel burned during takeoff, climb, and descent is factored into the calculation, along with a mandated fuel reserve in minutes of flying time. However, because the fuel weight is normally a small fraction of the total gross weight of the helicopter (usually, but not always) then Eq. 5.62 can be evaluated fairly accurately at the point in the cruise where the aircraft weight is equal to the initial gross weight (gross takeoff weight, Wgtow) less half the initial fuel weight, that is, at the point where W = W’ = Wgtow — Wp/2, where Wf is the initial fuel weight. In this case the range, R, of the helicopter when cruising at speed V is given by

Range

Figure 5.19 A representative mission profile for a helicopter.

Range—Payload and Endurance-Payload Relations

Range—Payload and Endurance-Payload Relations

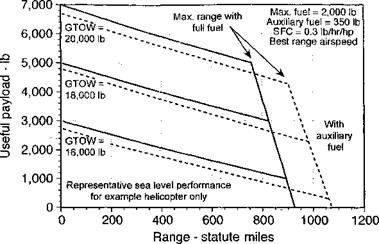
Figure 5.20 A representative payload-range curve for example the helicopter.


Range—Payload and Endurance-Payload Relations

(5.80)


and including a suitable allowance for transmission losses. The power available at altitude for a turboshaft engine is given by Eq. 5.61. The absolute maximum ceiling of the helicopter


Range—Payload and Endurance-Payload Relations

weight.


Range—Payload and Endurance-Payload Relations

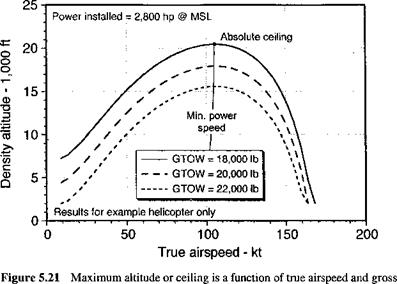
will be obtained at the speed for minimum power when Preq = Pait – Because this condi­tion is approached asymptotically, the altitude at which this occurs can be determined by setting the rate of climb Vc arbitrarily to the low value of 1 fts-1 (0.3 ms-1) and solving Eq. 5.80 for the density altitude at which this condition is reached. This is called the service ceiling.

РаспНс cbnu/inrr tbp срп/Ірр рріїїгш qc q fimpfiAn nf fniP оігєпррН fnr РУОГППІР Ьр1І_

XVWUIXXI. L> U11V vt nig 111V UV1 T 1VV wiling UJ «X lUUWllVll vi VlUV Ull 1V1 L11V v/vuinpiv 11V11

copter at different gross weights are given for standard atmospheric conditions in Fig. 5.21. This type of plot is often referred to as an operational flight envelope – see Fig. 6.38 for general operational flight envelopes of several rotorcraft configurations. It is apparent that the ceiling curves mimic the excess power available or maximum rate of climb curves, as would be expected. The ceiling that the helicopter can reach may be further qualified by specifying in ground effect (IGE) or out of ground effect (OGE) conditions – see Section 5.8. This is because operations IGE will reduce power required and so can help to augment the operational ceiling, a useful behavior when operating out of high altitude or mountainous terrain. However, the useful flight envelope may be further restricted by structural limita­tions that must be clearly defined to avoid inadvertent operations that may overstress the rotor – see Stepniewski & Keys (1984).

Speed for Maximum Range

The range of the helicopter is the distance it can fly for a given takeoff weight and for a given amount of fuel. In all cases contingency fuel allowances (i. e., reserves) must be

1Г4ІЛ ПЛЛЛППІ /4 /4 1ПГТ ЛП fU Л ПГЧЛП Л ГИЛ/4 AfV* /-»** ЇМПИПІ Г-Ч-** і rt nffl 1 tv« Я ч rrVif

uitvs attuuiu, uv^j^iuauig un uit* uuddiuu piunio anu wii^ux^i visual ui uiduuuiciu infill

Speed for Maximum Range Подпись: (5.72)

rules apply. The range can be written as R = V t so in terms of SFC and a given amount of fuel, a first approximation to the range is

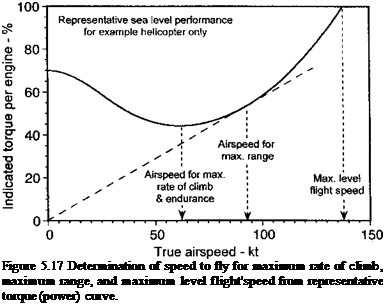
Typically, the fuel burn versus airspeed curves mimic the power required curves if the engines operate at the power settings where their SFC curves are relatively flat, as shown in Figs. 5.15 and 5.16. Therefore, as a first approximation the speed to fly to give the best range is obtained when the ratio V/P is a maximum or the ratio P/V is a minimum, that is, when the helicopter is operated at the best lift-to-drag ratio. For no-wind conditions this speed is graphically obtained from a line drawn through the origin and tangent to the P versus V (or torque versus V) curve, as shown in Fig. 5.17. As can be seen that this airspeed is usually at a somewhat higher airspeed than that required for maximum endurance. Notice that this speed will change with both the weight of the helicopter and with the atmospheric conditions.

Подпись: Figure 5.17 Determination of speed to fly for maximum rate of climb, maximum range, and maximum level flight'speed from representative torque (power) curve.

The speed to fly for maximum range, Vmr, is also determined essentially by the variation in induced power and the parasitic power. Therefore, the ratio of P/V can be approximated

Speed for Maximum Range Speed for Maximum Range

by the expression

Note that, like the speed for maximum range, this speed will also increase with increasing density altitude and with the square-root of aircraft weight.

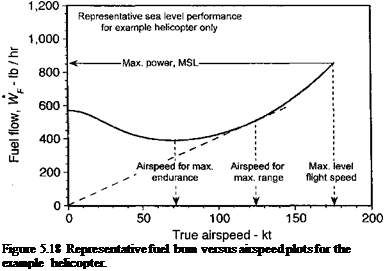
Подпись: Figure 5.18 Representative fuel bum versus airspeed plots for the example helicopter.

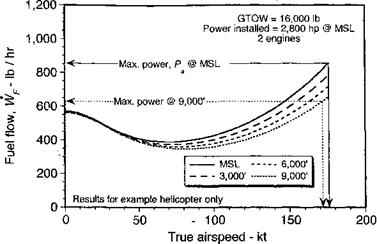
A more accurate estimate of range will take into account the actual SFC curves and fuel flow rates at the particular power settings for the altitude and temperature at which the helicopter is actually flying. From the representative results shown in Fig. 5.18, it is apparent that the maximum range condition that P/V is a minimum is obtained when a line drawn from the origin of the axes is tangent to the fuel flow curve. The resulting fuel flows (in units of lb hr-1 or kg hr-1) for different conditions (see Fig. 5.16) can then be used to find the specific range (in terms of distance flown per unit of fuel). Such results would normally be plotted as specific range versus true airspeed for different density altitudes. Determination of maximum endurance (see Section 5.20) also requires an accurate determination of the fuel flow curves.

Speed for Minimum Power

On the basis of the preceding analysis, it is clear that many of the performance characteristics of the helicopter in forward flight may be estimated directly from curves of excess power available and fuel bum relative to that required for straight-and-level flight at the same airspeed. For example, the maximum possible rate of climb is obtained at the speed for minimum power in level flight (this speed is often denoted by or Vy). It can be seen from Fig. 5.11 or Fig. 5.12 that this situation occurs at a fairly low airspeed, usually in the range 60-80 kts.

The speed Vmp will also be the optimum speed to fly for minimum autorotative rate of descent. At this airspeed the power required by the rotor is a minimum, and for an autorotation at this airspeed the pilot will need to give up the least amount of potential energy (altitude) per unit time. Thus, on the basis of the form of the power required curve it can be deduced that in the event of a mechanical failure in the hover condition, it is beneficial for the pilot to translate some of the stored potential energy into translational (forward flight) kinetic energy because the autorotative rate of descent under these conditions will be lower. However, if a mechanical failure occurs close to the ground, this transition may not be possible. For this reason, the normal operational envelope of a helicopter is restricted to an acceptable combination of altitude and airspeed that always allows safe autorotational landings to be performed (see Section 5.6.1).

In addition to being the speed to fly for maximum rate of climb and minimum autorotative rate of descent, Vmp also determines the speed to give the best endurance, that is, to obtain maximum loiter time on station for surveillance, search, and so on. To obtain maximum endurance the fuel bum per unit time must be a minimum. Now, the weight of fuel burned Wf in a given time t is given in terms of SFC (lb hp-1 hr-1) as

Подпись: (5.64)Подпись: (5.65)WF = SFC x Pt,

so the endurance (in appropriate units) for a given amount of fuel is

WF

SFC x P’

Clearly this time is maximized at the best SFC and lowest power required for flight. Fig­ure 5.16 shows representative fuel bum curves for the example helicopter. Because the engine SFC curve is fairly flat over the range of power settings where engines will operate in practice (Fig. 5.15), the fuel bum is proportional to power at a given pressure altitude and temperature, and the speed for minimum fuel bum coincides with the speed for minimum

Speed for Minimum Power

Speed for Minimum Power

Figure 5.16 Representative fuel bum versus airspeed plots for the example helicopter.


power. For the unusual case of engine operations at very low power settings, however, the SFC increases quickly and these two speeds will not necessarily be equal.

To estimate the value of Vmp, the approximation previously derived in Eq. 5.53 for the helicopter power can be used, namely


CpsCa = l§ + ^(1 + кд2) + (а) д3 + KCw’ (5’66)

At lower airspeeds the rotor profile power is small and builds slowly with the square of airspeed. Therefore, the minimum power is essentially determined by the variation in induced power and the parasitic power at these lower air speeds [see Johnson (1980)]. It can be assumed that Cj ~ Cw and so


(5.67)


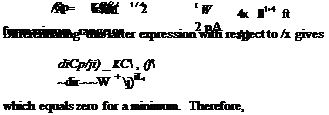
Differentiating this expression with respect to ц, gives


3// J

dpi 2д2 2 AJ ^


(5.68)


which equals zero for a minimum. Therefore,

3 // 2 ( K^w

= 0r l 3777)

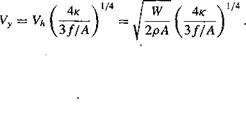
for maximum endurance. Also, recall that Xh = JCw/2 so that

1/4 ГгС: / л„ i/4


(5.69)


‘CW / 4к V 2 ІЗf/Aj


(5.70)


or


(5.71)


І


Speed for Minimum PowerSpeed for Minimum PowerSpeed for Minimum Power

Note that, in general, this speed will increase with increasing density altitude, that is, with both increases in altitude and temperature. In addition, it will be apparent that this airspeed is proportional to the square-root of disk loading and helicopter weight.