Category Principles of Helicopter Aerodynamics Second Edition

Rotor—Tail Rotor Interactions

The tail rotor has to operate in a relatively complex aerodynamic environment and must produce thrust with the relative flow coming from essentially any direction – see Newman (1994). For example, the tail rotor must operate properly in side winds and during yaw maneuvers. In a yawing maneuver, the tail rotor operates either in an effective climb or descent mode, depending on the yaw direction. The yawing direction that produces an effective descending condition is the most critical because it is possible for the tail rotor to enter into the vortex ring state (see Section 2.13.6). This can result in a loss of tail rotor authority and perhaps even a loss of control under certain conditions, a problem first explored by Amer & Gessow (1955). These effects are carefully examined during certification flight testing to ensure that there is a minimal chance that the helicopter will inadvertently exhibit undesirable flight characteristics.

As described previously in Section 6.9.4, the tail rotor is also mounted in proximity to a vertical fin or other empennage assembly and the resultant aerodynamic interactions will affect tail rotor operation. Furthermore, the operation of the tail rotor will be affected by turbulent separated flow generated by the main rotor hub and fuselage wakes, and also the energetic main rotor wake itself. This adverse environment means that the aerodynamic design requirements for the tail rotor are different in some respects from those of the main rotor. For these reasons, it is known to be difficult to design a tail rotor that will meet all aerodynamic, control, stability, weight, and structural requirements. See Lynn (1970), Cook (1978), В у ham (1990), and Newman (1994) for a detailed overview of tail rotor design issues.

The aerodynamic interactions between the main rotor and the tail rotor are discussed by Wiesner & Kohler (1973, 1974), Leverton et al. (1977), Balch (1984), Wilson (1990), Ellin (1993), Tarttelin & Martyn (1994), Coton et al. (2002), Early et al. (2002), and Wang et al. (2002). In forward flight there is a lateral asymmetry in dynamic pressure across the tail rotor, as with the main rotor, but the effects are alleviated by flapping hinges. Yet the tail rotor still trails its own unique wake, although this is much less powerful than the main rotor wake. The main rotor wake is known to roll up at its edges into a pair of “super-vortices,” this phenomenon having been alluded to several times previously in Chapter 10. This rollup effect produces a downwash over the tail rotor with a significant veiocity gradient in the iongitudinal direction. There is also an increased total pressure in the main rotor wake, which encroaches onto the tail rotor as forward flight speed builds.

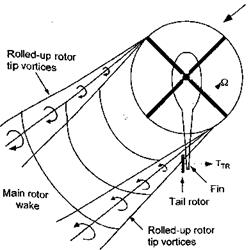
Of some importance in the aerodynamics and aeroacoustics of the tail rotor are the cutting or “chopping” types of interactions that take place as the tail rotor blades intersect the strong tip vortices trailed from the main rotor blades – see Leverton et al. (1977), Howe

(1989) , and Coton et al. (2002). Because the plane of rotation of the tail rotor is almost perpendicular to the main rotor (unless the tail rotor is canted), the plane of the tail rotor blades is essentially perpendicular to the vorticity vector of the tip vortices. The location of the interactions over the tail rotor disk are a function of several parameters, including the

Figure 11.26 The tail rotor may intersect and cut-through the strong tip vortices that are trailed from the main rotor.

flight condition (see Fig. 11.26). More interactions can usually be expected to occur when the helicopter is in higher speed forward flight or during descents.

The number and location of the intersections between the tail rotor blades and the main rotor wake vortices can be determined using the same principles as those described in Section 10.4.2 for finding the main rotor BVI locations. In the first instance, a simple rigid wake model can be used to study the tail rotor interactions, such as that discussed by Newman (1994), but it must be recognized that considerable main rotor wake distortion can indeed be produced at the tail rotor. The geometry of this type of model is shown in Fig. 11.27. The tip vortices from the trailing edge of the main rotor disk are assumed to be convected at the free-stream velocity relative to the tail rotor and to be uninfluenced by the tail rotor.
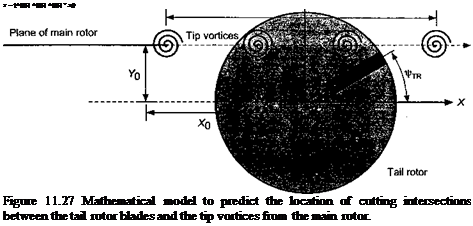
Подпись: X ~ t^MR ^MR ^MR + X0 Figure 11.27 Mathematical model to predict the location of cutting intersections between the tail rotor blades and the tip vortices from the main rotor.

Yn

where і = 1, NbjR. The coordinates of a point on the axis of the tail rotor blades are given by

/ 2n{i – 1)

XTR = r cos UrTR———– ——— I Rtr, (11.9)

and

/ 2n(i — 1)

TTR = ±rsin UrTR———– ——— J Rtr, (11.10)

where the ± accounts for the direction of rotation of the tail rotor (counterclockwise or clockwise, respectively). The different rotational frequencies of the main and tail rotors means that the time scales are related by

= (1U1)

Rotor—Tail Rotor Interactions Подпись: (11.12)

An intersection occurs when

are simultaneously satisfied. This solution can easily be found numerically.

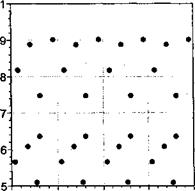
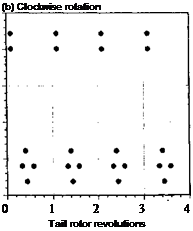
Representative results from this model (in terms of the radial intersection point as a function of tail rotor revolutions) are shown in Fig. 11.28 for a counterclockwise and for a clockwise turning tail rotor. Notice that the intersection pattern is periodic but differs considerably depending on the sense of rotation of the tail rotor, a point also noted by Leverton et al. (1977) and Newman (1994). This is because, in the case of a counterclockwise rotation, the tail rotor blades are advancing into the main rotor tip vortices whereas, for a clockwise rotation, the blades retreat away from the oncoming vortices. The implications are that minimizing the number of intersections will reduce unsteady airloads and tail rotor noise, and on this basis it appears that a clockwise rotation of the tail rotor (usually called rotation “aft at the top”) is the better choice, a result borne out by flight testing experience – seeEllin (1993).

Подпись: (a) Counterclockwise rotationПодпись: UJ c "ra TD Подпись: DCПодпись:Подпись:Rotor—Tail Rotor InteractionsПодпись: (b) Clockwise rotation 0 1 2 3 4 Tail rotor revolutions 0.

0.

0.

0.

0.

Wind over nose

Подпись:Rotor—Tail Rotor InteractionsПодпись:

Rotor—Tail Rotor Interactions

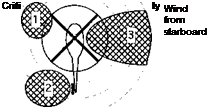
for loss of tail rotor effectiveness Zone 1: Effects of main rotor wake (port side).

Zone 2: Effects of main rotor wake (starboard side). Zone 3: Tail rotor may enter vortex ring state.

Figure 11.29 The impingement of the main rotor wake on the tail rotor can cause loss of tail rotor effectiveness. Adapted from Vuillet (1990) and other sources.

Clearly the aeroacoustics problem is relatively more complicated than this, but a par­simonious model like this illustrates one fundamental aspect of the tail rotor-main rotor wake interaction problem. The model can also be used to explore the effects of changing the phase angles between the tail rotor blades, such as the nonorthogonal set used on the AH-64 Apache (see Question 11.7). It should be pointed out, however, that the tail rotor was not designed for this way for acoustic purposes but instead to alleviate clearance issues with the pitch links.

The aerodynamic interactions between the main rotor and tail rotor in low-speed flight generally prove to be the most severe and the hardest to predict. Critical conditions include right and left crosswinds, where the bundled super-vortices trailed from the main rotor disk can impinge on the tail rotor. An example is shown in Fig. 11.29. Under these conditions the down wash and change in dynamic pressure across the tail rotor disk that is produced by the main rotor wake can degrade tail rotor performance. As previously mentioned, because of these effects, one normally finds that tail rotors that have an “aft at the top” rotation are preferable. This has been fotmd through flight testing to balance the aerodynamic forces and maintain good tail rotor authority over a wider range of flight conditions than the opposite sense of rotation. Other critical flight conditions include rearward flight near the ground or sideward flight to port – see Section 10.10.6. In rearward flight, the ground vortex can result m loss of tail rotor effectiveness. In sideward flight (or when hovering in a crosswind), the tail rotor operates in an effective descent and will eventually encounter the vortex ring state where a loss of anti-torque and yaw control effectiveness will occur. All of these issues are carefully examined during certification of the helicopter to ensure that there are no adverse effects or that potentially problem areas of the flight envelope can be fully identified.

Modeling of Rotor-Empennage Interactions

– Mathematical models have not yet evolved to the point where the aerodynam­ics of the empennage can be predicted without input from wind tunnel and/or flight tests.

Modeling of Rotor-Empennage Interactions
Blade azimuth position (time), ^ – deg. Blade azimuth position (time), i)> – deg.

The capabilities of these methods are beyond the state of the art because of the need to model vortex-surface collisions, the cutting of vortex filaments, as well as the forma­tion of 3-D unsteady separated flows. Gangwani (1982, 1983) has used a prescribed wake model coupled with a doublet-lattice model of a fixed wing to predict the unsteady bending moments produced on a helicopter tail. Reasonable correlation was obtained with flight measurements. Mello & Rand (1991) confirmed that the predicted unsteady airloads on the empennage were sensitive to the rotor wake position, simply confirming results of both wind tunnel measurements and flight test experience. Weinstock (1991) has developed a
parsimonious model of the rotor wake-empennage aerodynamic interaction problem for use in flight simulation modeling. Curtiss & Quackenbush (1989) considered in more de­tail how the induced velocity field of the rotor wake at the empennage location affects the helicopter’s stability derivatives. The limited correlations obtained with flight mea­surements reiterated the complexity of the main rotor wake-empennage interaction prob­lem and the difficulties in constructing truly faithful models for use in flight mechanics simulations.

Rotor-Empennage Interactions

Rotor-Empennage Interactions

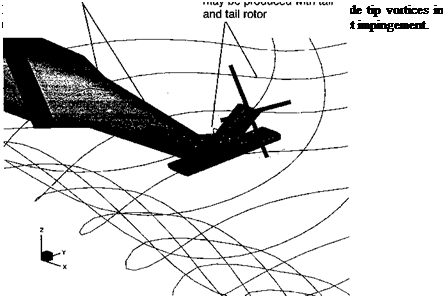
The interactions between the main rotor wake and the empennage (horizontal and vertical stabilizers and the tail rotor) are known to be particularly significant, yet systematic studies of the problem to understand the flow physics still remain relatively few. As shown in Fig. 11.20, the interactions involve vortex surface impingement. Lynn (1966) has discussed

some of the general problems associated with helicopter rotor-lifting surface interactions, but concentrating mostly on performance issues.

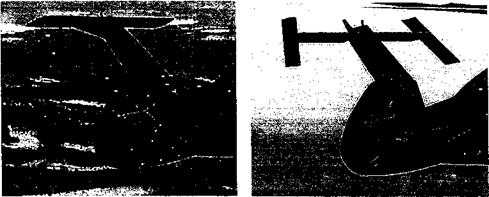
Historically, empennage designs on helicopters have proved problematic, mainly from a stability and control perspective, because large forces and moments are produced on the empennage by the rotor wake as its position changes with flight condition. As previously alluded to, resolving such problems can involve substantial costs for the manufacturer because of airframe redesign and associated flight retesting time. Good case histories of the stabilizer design are available in the literature [e. g., for the AH-64 Apache as documented by Prouty & Amer (І982) and Prouty (1983)]. Other documented examples are for the AS-360 discussed by Roesch & Vuillet (1981) and for the EH-101 as discussed by Main & Mussi (1990). It appears, however, that lessons are not always learned and the horizontal stabilizers of new helicopters continue to be hounded by main rotor wake interaction problems.

More fundamental investigations into the problem of rotor wake-lifting surface interac­tions include the work of Wheatley (1935), Makofski & Menkick (1956), and McKee & Naeseth (1958). Sheridan & Smith (1979) examined specific issues associated with wake induced empennage airloads in their seminal work on rotor-airframe interactions, as previ­ously mentioned. Leishman & Bi (1994a, b), Foley et al. (1995), Funk & Komerath (1995), and Moedersheim & Leishman (1998) have studied the more detailed fluid dynamics of the interactions between rotor wakes and horizontal lifting surfaces. Torok & Ream (1993) ob­tained flight measurements documenting the wake interactions found on a helicopter with a T-tail empennage configuration. Frederickson & Lamb (1993) conducted wind-tunnel tests to further examine the issues. This research has led to a more optimized empennage design, as shown in Fig. 11.21. Moedersheim & Leishman (1998) have also examined the unsteady forces on a generic T-tail. In all tests the unsteady airloads and vibration levels can be correlated with the relative position of the main rotor wake boundary. Sheridan & Smith (1979) and Roesch & Vuillet (1981) have also shown that the turbulent rotor hub wake can have a considerable influence on the flow environment at the empennage location at high advance ratios – see also Berry (1997) for measurements and a more detailed discussion of this problem. This turbulence has been known to cause lateral buffeting or “tail shake” on some helicopters, which is only cured by suitable streamlining downstream of the rotor hub.

While rotor-empennage interactions have proved to be significant on helicopters, rotor­wing and rotor-empennage interactions are particularly acute on compound helicopters and on tilt-rotor aircraft. In hover (helicopter mode), the wings of a tilt-rotor are directly below

(a) Original empennage design (b) Alternative empennage design

Rotor-Empennage Interactions

Figure 11.21 Two developmental versions of the empennage used on an advanced attack helicopter.

the rotors and are immersed in the rotor wakes. This can produce strong wake-surface interactions [see Wood & Peryea (1991)] as well as unsteady airloads from blade-passage effects that are induced by the highly loaded proprotors. In forward flight (airplane mode), both the main wings and the tail surfaces are located inside the rotor wake boundaries. Un­der these conditions the proprotors induce nonuniform, 3-D velocity fields at the wings and empennage. Interactions between the rotor wake and the empennage are known to constitute a significant source of vibratory loads. See Clark (1987), McVeigh (1986), Schillings & Reinesch (1987), McVeigh et al. (1990), and Lesching & Wagner (1990) for a good dis­cussion of the specific aerodynamic interaction problems associated with tilt-rotors. Like helicopters, the adverse effects are difficult to design out but some attempts can be made to minimize the otherwise deleterious effects on the performance of tilt-rotor aircraft.

Rotor-Empennage Interactions

A low mounted aft stabilizer is a common design choice for a modern helicopter because it is structurally efficient; all the loads are carried directly into the tail boom so it can be of minimum weight compared to a T-tail. However, this stabilizer design tends to produce trim problems associated with transition from low-speed flight into hover, where the main rotor wake may suddenly move forward over the empennage location and so produce a nose-down pitching moment on the helicopter – see Prouty & Amer (1982). This problem is shown schematically in Fig. 11.22. Because the wake position relative to the empennage is affected by forward flight speed as well as climb or descent velocity, the aerodynamic angles of attack found at the empennage can be very sensitive to the actual flight conditions. Combined also with the higher total pressure obtained inside the main rotor wake, substantial changes in the forces on the stabilizer can be produced, which affect the pitching moments generated by the helicopter as a whole. If these changes occur suddenly or unpredictably, undesirable handling qualities can result – see Main & Mussi (1990). A high mounted tail or T-tail configuration places the tail out of the rotor wake for many flight conditions except for higher-speed forward flight or during descents. While a less efficient structural choice, Prouty & Amer (1982) suggest that this design is sometimes a good compromise in meeting the various requirements for a military helicopter.

Подпись:‘ Stabilizer outside rotor wake boundary
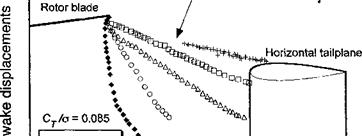
Figure 11.22 Schematic showing interactions between the main rotor wake and the hori­zontal tail during transition from hover into forward flight.

11.3.1 Airloads on the Horizontal Tail

Consider now the airloads produced on the T-tail for the subscale experiment shown in Fig. 11.2. The primary factors influencing the airloads on the empennage include the highly nonuniform velocity field produced by the rotor and its wake, as well as an increase in total pressure inside the wake boundaries. For example, Fig. 11.23 shows measured flow velocity vectors in a cross-plane near the empennage location. Notice the signatures of the vortex bundles or “super-vortices” that are trailed from the lateral edges of the rotor disk, similar to those generated at the tips of a fixed wing aircraft – see, for example, Fig. 10.9. Similar results have been obtained by Le Pape et al. (2004) using PIV measurements. This wake rollup from the rotor disk induces a downwash on the horizontal tail, producing negative lift for this flight condition. The asymmetry of the wake roll up also produces a nonuniform sideward flow velocity and a force on the vertical fin.

As shown in Section 10.2, flow visualization (i. e., smoke, shadowgraph) is an effective tool for finding the position of the tip vortices in the rotor wake. Typical results showing the wake boundaries at the longitudinal centerline for different advance ratios relative to the tail location are given in Fig. 11.24. The locations of the tail boom, vertical fin, and

Подпись:Подпись: ♦Подпись: CD > Подпись: CO О Подпись:Подпись: ♦Подпись: ♦Подпись: ♦♦♦ ♦♦♦♦♦♦»♦♦♦♦♦Rotor-Empennage Interactions

Rotor-Empennage Interactions
Подпись: r<- Подпись: /

Body

Streamwise wake displacements

Figure 11.24 Measurements of the rotor wake boundary relative to an empennage assem­bly showing the sensitivity to variations in advance ratio. Data source: Moedersheim & Leishman (1998).

horizontal tailplane are shown for reference. It is clear that advance ratio has a significant effect on the wake position relative to the tail. At the lowest advance ratios the tip vortices are convected down toward the body surface, and then follow a trajectory that is almost parallel to the horizontal tailplane. An increase in advance ratio produces a higher wake skew angle, so the tip vortices are convected streamwise at an increasingly higher velocity. As expected, changes in the wake skew angle are largest at low advance ratios; this angle changes very little for д > 0.25. The rotor wake was found to impinge on the top surface of the horizontal tail for д = 0.25 and above. The flow visualization showed that, in the cases where direct, impingement of the tip vortices on the tail surfaces could be observed, they would burst and diffuse quickly. This suggests that strong local pressure and viscous effects are present.

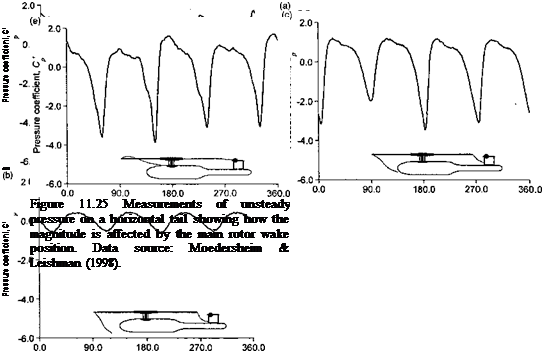
Overall, it is found that the time-dependent pressures measured on the tail generally show more complex variations compared to on the body. This is not entirely unexpected because the environment at the empennage is much more 3-D than points further upstream. Also, as in the case of the body, the unsteady airloads are found to be closely related to the proximity of the rotor wake. For example, Fig. 11.25 shows representative time-dependent pressures measured at one location (Sensor #5 in this case) on the upper surface of the tailplane for a range of advance ratios at a constant rotor thrust and shaft angle. At low advance ratios (д <0.10) the rotor wake is convected relatively far below the horizontal tailplane, and the unsteady airloads are found to be negligible. As the advance ratio is increased, however, the unsteady airloads build up in intensity. Clearly this occurs because of the closer proximity of the rotor wake boundary to the tailplane.

The wake boundary comes very close to the tailplane between д = 0.20 and 0.25. At this condition the unsteady airloads seem to reach their maximum values. For advance ratios above 0.25, the separation distance between the wake boundary and the horizontal tailplane increases slightly, with a corresponding mild decrease in unsteady loading. Recall that for higher advance ratios the position of the wake boundary remains relatively unaffected by changes in advance ratio. The unsteady airloads are, therefore, maintained at the same overall magnitude. However, because the convection velocity of the individual vortex wake filaments increases with increasing advance ratio, a change in phase of the unsteady airloads with respect to the blade position will still be observed. It should also be apparent that the induced velocity field produced by the convecting tip vortices results in local angles of attack that vary in time at a fairly high reduced frequency. This can be established by computing the reduced frequency of the vortex passage at the tailplane from the equation

2д ‘ 1 ‘

The ratio с/R is about 0.25 for the configuration shown, so the reduced frequency of the flow at the tail for an advance ratio of 0.2 would be of order 2.5. Obviously this requires the mathematical modeling of the physics of this problem to be considered fully unsteady (Section 8.4). Also, if and when stall occurs locally on the tail, the high effective reduced frequency of the flow means that separation and stall may be more dynamic in nature. This adds yet an additional level of complexity to the mathematical modeling of the rotor-fail interactional aerodynamics problem.

Modeling of Rotor—Fuselage Interactions

Effective analytical tools that are capable of treating interactional aerodynamic problems are still undergoing development and will continue to do so until wake modeling is improved further (see Chapter 10). Some of the earliest theoretical work on the rotor – fuselage aerodynamics problem was performed by Bramwell (1966) using potential flow assumptions and conformal mapping techniques. The results compared well with the few experimental data that were available at that time. Landgrebe et al. (1977) made one of the first studies of the effects of an airframe on rotor airloads and performance. The task was divided into three levels of complexity: 1. The calculation of velocity perturbations induced by the body in the rotor plane and the calculation of changes in the rotor airloads based on these perturbations, 2. The inclusion of velocity perturbations in the trim analysis, with the rotor loading being adjusted for the velocity perturbation, and 3. The inclusion of the effects of the body on the rotor wake geometry. The results clearly demonstrated the overall importance of accurately predicting interactional effects on helicopters.

The basic approach of linear superimposition of flow fields about the airframe and the rotor, but without considering the mutual interactions, has been pursued by several other researchers. Wilby et al. (1979), Ryan et al. (1988), and Dehondt (1989) have all used this type of superposition methodology. Although these models give an indication of the types
of interactional effects that can be expected, there are clearly many questions about the quantitative validity of the results, particularly in flight regimes where it is known that there are strong interactions between the rotor wake and the fuselage (i. e., in hover or low-speed forward flight). Under these conditions the interactional aerodynamics problem cannot be treated by linear-superposition techniques. It has already been shown how the rotor wake heavily influences the fuselage flow field, and likewise, the fuselage influences and distorts the rotor wake development. A somewhat better approximation was first introduced by Freeman (1980), who included a time-averaged vortex tube wake model during the calculation of the body aerodynamics. Clark & Maskew (1985,1988) later developed a more sophisticated time-averaged wake model using vortex theory. A major deficiency of all of these models, however, was the omission of the distortion of the wake induced by the body.

More sophisticated surface singularity (panel) methods have been developed that allow a more complete computation of interactional effects, including the interaction of the wake and the airframe. These panel methods are discussed in Section 14.7. Some of these methods, however, have shown less predictive success in the low-speed forward flight regime, and this is a serious deficiency because the various flow interactions are often more significant here. Landgrebe et al. (1977) and Lorber & Egolf (1990) recognized the significance of the rotor wake distortions induced by the body, and developed an analysis using a prescribed rotor wake with geometric displacement rules to distort the wake about the body. More sophisticated analysis have coupled free-vortex wake models and surface panel models, including the work of Clark & Maskew (1988, 1991), Mavris et al. (1989), Berry (1988), Berry & Althoff (1990), Quackenbush et al. (1990), Crouse & Leishman (1992), Boyd et al.

(2000) , and Wachspress (2003). All these methods are potential flow models, so naturally are limited to essentially inviscid flows. Furthermore, for most flight situations there is a need to retain unsteady terms in the governing equations to give acceptable levels of predictive success, a point alluded to previously, and this leads to a greater computational cost.

All of these types of panel models inevitably include some empirical features (including viscous tip vortex models) and so require detailed experimental measurements for valida­tion purposes. Unfortunately, there are still only limited measurements available that are directly relevant to the somewhat more idealized interactional problems currently under theoretical study (i. e., vortex-surface impingement). More experimental data are available for complex geometrical configurations, but it is difficult to isolate the effects of individual flow phenomena from these results. This paucity of specific types of experimental data hin­ders the development and validation of more effective analytical models for airframe and rotor airloads. Validation predictions against existing experiments has been fairly success­ful, however, allowing a clear delineation of the primary effects of the body on rotor airloads and performance and vice versa. For example, predictions using the free-vortex wake and surface singularity method of Crouse & Leishman (1992) has been shown in several prior figures, including Figs. 11.3, 11.8, and 11.15. These predictions are in general agreement, with measured results, which gives overall confidence in these types of essentially potential flow models for predicting a priori the possibilities of various rotor-airframe interaction problems. Predictive capabilities with panel methods are always reasonably good in air­frame regions unaffected by flow separation. It is possible to represent 3-D separated flows by extending the singularity panels off the airframe surface as free shear layers, however, the points of 3-D flow separation on the airframe are hard to predict.

As previously alluded to, it is the interaction of blade tip vortices with the airframe surface that has proved more difficult to model, and this problem has perhaps received the most recent attention from a theoretical perspective. As previously described, these interactions can range from almost benign interactions where the tip vortex trajectories just

glance the airframe or empennage surfaces, to direct impingement and associated large – scale reorganization of the flow topology. Even though the encounter may vary in terms of its severity, in almost all cases the tip vortices induce large unsteady airloads on the airframe surface. Significant progress has been made in modeling this behavior numerically by means of vortex methods – see Conlisk & Affes (1993), Conlisk et al. (1993), and Quackenbush et al. (1994). However, rotor wake-surface interaction predictions are challenged by their inability to calculate the vortex strengths and wake distortions with good accuracy, and also because the local distortion of the wake by the body must be accounted for.

Because rotor-mrframe interactional problems often involve 3-D viscous effects and flow separation, these problems a particularly good challenge for advanced computational fluid dynamic (CFD) models based on Navier-Stokes (NS) or Reynolds-averaged Navier – Stokes (RANS) equations (see Section 14.2.1). Fundamental studies of the problems has been conducted by Stremel (1987, 1990). More ambitious attempts with entire rotor and airframe configurations [e. g., Park et al. (2003)] have been recently attempted using millions of grid points in the flow (and many hours on a supercomputer), but these methods seem to have provided only limited new insight to the numerous types of interactional aerodynamics problems; most of the understanding still comes from more parsimonious models and from experimental observations. See Section 14.10.4 for further details of CFD approaches to rotor-airframe interaction problems.

Fuselage Side-Forces

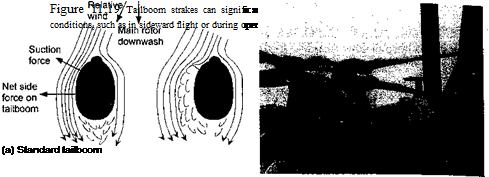
The origin of the adverse download and pitching moments on the airframe that are induced by the rotor has been discussed previously in Section 11.2.2. However, adverse side forces can also be produced on the airframe as a result of the rotor wake. An example has been shown previously in Fig 11.11, where the difference in static pressure between the two sides of the tail boom will produce a net side force. The side force is usually in the direction opposite to that required for anti-torque purposes. It has also been shown that when a helicopter is in sideward flight or is hovering over a fixed point above the ground in a crosswind, a significantly increased side-force will be produced on the fuselage. For most helicopters this side-force usually remains small enough to have a minimal impact on the handling qualities of the helicopter and its operational envelope. However, in some cases, the adverse aerodynamic side-force can be significant and may impact flight operations. This can occur when the helicopter is in starboard sideward flight or has a starboard crosswind component – see Fig. 11.19. (This example is for a rotor turning in the conventional, counterclockwise direction.) On some helicopters this is a powerful adverse effect that can affect directional (yaw) control and can limit its operational flight envelope. In particular, this can be an issue on military helicopters as these must often demonstrate high-speed sideward flight capability and must often operate in confined locations in gusty crosswind conditions (such as on a ship).

The aerodynamic side-force on the fuselage has been found to be accentuated by certain tail boom shapes, which can produce a sizable circulatory lift forces when the sideward velocity is combined with the main rotor downwash – see Wilson & Kelly (1983, 1986) for a systematic study of the forces produced on such tail boom shapes. See also Delany & Sorensen (1953) and Hoemer (1965) for force measurements on a variety of bluff body shapes. To counter this undesirable side-force effect, Brocklehurst (1985) and Wilson et al.

Fuselage Side-Forces

(b) Tailboom with strake (c) Application on a helicopter

(1988) have suggested the use of a spoiler or strake that runs longitudinally along the one side (usually the port side) of the tail boom. This strake forces the flow to separate from the tail boom surface, spoiling the side-force and thereby restoring or improving the helicopter’s operational flight envelope – see Kelly et al. (1993). This design solution will only be required if the tail boom cross section is relatively deep, typically if of quasi­elliptical shape with height to width ratios greater than about 2. The strake also creates a vertical download penalty and a nose-up moment on the airframe, but these effects are relatively small compared to the overall operational benefits that have been realized with me use oi а аігаке. inis uevice nas uceii iiueu or reiroimeu to several prouucuon nencopier models. A more recent innovation is to use tail boom venting with porous skins to reduce tail boom side forces – see Banks & Kelly (2000). Although, passive venting appears to reduce adverse side-forces, its use is also accompanied by an increased vertical download from the higher skin friction effects created by the flow as it passes over the porous skin.

Type-4 Interactions: Post Wake-Surface Impingement

A fourth type of pressure signature is shown in Fig. 11.13(d). This type of signature generally occurs just downstream of the impingement of a tip vortex on the body and thus is called a post wake-surface impingement or Type-4 interaction. This signature contains certain features common to both Type-2 and Type-3 interactions; the basic saw-tooth pattern is present along with a transient loading, but with several additional pressure fluctuations. The amplitude of the dominant peak is also attenuated relative to the Type-3 interactions, a point made by Lorber & Egolf (1990). This is a very complicated sighature to predict because the flow hear the body surface under these conditions is more viscous dominated and turbulent as it interacts with the body surface boundary layer. This problem requires a more thorough understanding of the distortions and stretching of the vortex filaments during and after the wake interaction with the body.

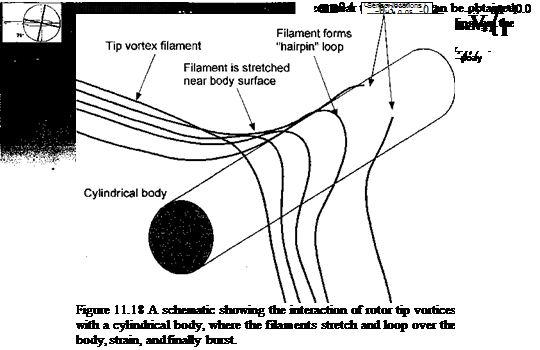
Leishman & Bi (1994b) suggest that Type-4 pressure signatures can be further classified into two groups. One can be called a near-field, post wake-surface impingement interaction and the other can be called a far-field post wake-surface impingement interaction. The former occur immediately downstream of the surface location where the tip vortex impacts or at least comes very close to the body surface. The latter type occur some further distance downstream and contain high frequency fluctuations that are associated with turbulence in the boundary layer or separated flow. Unsteadiness also arises because part of the tip vortex that is very close to the body becomes unsteady (aperiodic with respect to rotor frequency) as it undergoes a complicated stretching and turbulent diffusion process (Fig. 11.18).

Type-3 Interactions: Wake-Surface Impingement

A third type of pressure signature often measured on helicopter airframes is shown in Fig. 11.13(c). This signature occurs when direct impingement of a tip vortex occurs near the measurement point, a fact confirmed by flow visualization experiments. For example, such an interaction made visible using the shadowgraph technique (see Section 10.2.3) is shown in Fig. 11.17. The tip vortex filaments appear as thin dark lines. Near the body surface the local wake skew angle increases progressively as the filaments asymptotically approach the body surface. The tip vortices also undergo significant local stretching (both laterally and longitudinally) before the action of viscosity causes the vortices to burst. The schematic in Fig. 11.18 shows the observed wake behavior in more detail. As the filaments reach the

Type-3 Interactions: Wake-Surface Impingement
body surface they distort to form a loop or hairpin vortex structure. These vortex-surface interactions and their effects on the surface pressure, poses a complex problem in vortex dynamics because they involve a complex balance of inertia, pressure, and viscous forces – see Atias & Weihs (1984), Doligalski & Walker (1984), Walker et al. (1987), and Lim (1989). The physics of these complicated wake distortions have also been studied in detail by Conlisk et al. (1993) and Moedersheim et al. (1994), by means of flow visualization, and modeling these effects is discussed by Quackenbush & Bliss (1988), Quackenbush et al. (1990, 1994), and Conlisk & Affes (1993). Progressive transitions from Type-3 to Type-2 interactions (or vice versa) will be found during adjustments of the advance ratio and/or rotor thrust that adjust the position of the rotor wake relative to the body.

Type-2 Interactions: Close Wake-Surface Interactions

Figure 11.13(b) shows a second type of pressure signature found on a body situated below a rotor, which is distinctive because of its “saw-tooth” type of waveform. This second type of signature can occur at different points on the rear of the body under a variety of
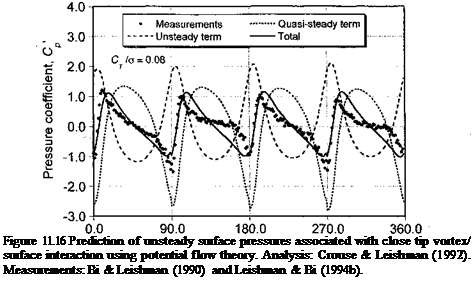
combinations of thrust and advance ratio; it is related to the proximity, trajectory, and convection velocity of the trailed tip vortices relative to the body surface. The prediction of these airloads, therefore, requires a knowledge of the rotor wake structure, and specifically the strengths, induced velocity field, and trajectories of the convecting blade tip vortices. As shown in Chapter 10, this is a much more difficult problem, even for an isolated rotor. For the results shown in Fig. 11.13(b) the tip vortices were found to be close to the measurement point, but were a small distance above the body surface and not directly impinging at this point. Therefore, these pressure signatures are called close wake-surface interactions or Type-2 interactions..

Подпись: C'p(f) = — 100АГ2 Type-2 Interactions: Close Wake-Surface Interactions Подпись: 2 Подпись: 2

Of course, the actual pressure signature induced on the body by the wake depends not only on the relative speed, direction of, and proximity of the tip vortices to the measurement location, but also on their strength (i. e., tip vortex strength is proportional to rotor thrust – see Eq. 3.112). This problem can also be examined, albeit approximately, using potential flow theory. The simplest model consists of an infinite series of free vortices convecting at velocity fxQR at a skew angle x relative to the vertical (see Fig. 3.28). Again, an image system is included to satisfy the condition of flow tangency on the body surface. The unsteady pressure coefficient on the body induced by this model of the convecting wake is given as a function of xjs by

Подпись: - 200д К Type-2 Interactions: Close Wake-Surface Interactions Подпись: ілф- tan x Подпись: (11.5)

quasi-steady term

unsteady term

where К reflects the effect of rotor thrust and blade loading, as given by Eq. 11.4.

The first term in Eq. 11.5 is the quasi-steady contribution, and the second term is the unsteady effect, with the results being shown in Fig. 11.16. It can be seen that the predicted pressure signature is in excellent qualitative agreement with the measurements. This level of correlation essentially confirms that this second type of pressure signature is induced by the relatively close proximity of the convecting tip vortices to the fuselage surface. It should be noted, however, that, compared to the blade passage effect shown in Fig. 11.16, in this case both the quasi-steady term and the unsteady term are of equal importance in determining the net form of the unsteady pressure response.

Crouse et al. (1992) have hypothesized a large sensitivity of the unsteady pressure sig­nature to hypothetical changes in the wake skew angle у (i. e., the height and trajectory of the convecting wake vortices over the body). At low wake skew angles the saw-tooth type of pressure signature induced on the body is clearly a Type-2 interaction (i. e., a close wake-surface interaction). However, when the wake skew angle is increased slightly, the induced pressure signature becomes more benign. In fact, the pressure signature at higher wake skew angles gradually becomes more like a blade-passage effect because the wake

Blade azimuth position (time), гр – deg.

Подпись: Figure 11.16 Prediction of unsteady surface pressures associated with close tip vortex/ surface interaction using potential flow theory. Analysis: Crouse & Leishman (1992). Measurements: Bi & Leishman (1990) and Leishman & Bi (1994b).

makes an increasingly shallow angle with the body surface as д increases for a constant value of rotor thrust – see Fig. 3.28.

In reality, of course, the trajectory of the rotor wake is not just a function of rotor thrust, but is affected by the distribution of loading over the rotor disk, the advance ratio, and the self-induced wake distortion, as well as the amount of local wake distortion caused by the fuselage. This latter effect increases the wake skew angle at the rear of the rotor and decreases the wake skew angle at the front of the disk. Therefore, it can be concluded that while an unsteady potential flow model is sufficient to predict the close wake-surface interactions when the vortex strengths and locations are prescribed, the high sensitivity of the body pressures to changes in wake location means that accurate prediction of the rotor wake geometry is really the vital key to successful prediction of rotor wake-airframe interactional airloads. Because it is difficult to predict (or measure) the wake geometry to high accuracy, this means that the accurate prediction (and measurement) of Type-2 interaction signatures at specific points on the airframe is still very challenging – see Wachspress et al. (2003) for a comprehensive study.

Unsteady Rotor-Fuselage Interactions

Considerable attention has been placed on the measurement and prediction of the unsteady pressures induced on a fuselage below a rotor. In many cases, the unsteady pres­sure fluctuations are much larger than the mean pressures. All parts of the fuselage surface are subjected to unsteady loading, both in magnitude and phase. Because the distribution of pressures is very complicated in nature and has contributions from multiple sources (rotor, individual blades, wake, etc.), it has proved difficult to isolate or characterize unsteady pres­sure responses and correlate the behavior with specific physical phenomena. As previously mentioned, the isolation of phenomena is very necessary for the validation of mathematical models, such as those for wake distortion and tip vortex impingement on the airframe – see Section 11.2.5.

Liou et al. (1989a, b) and Brand et al. (1989,1990) have conducted experiments to inves­tigate the aerodynamic interactions between a cylindrical body and a rotor. Measurements of the instantaneous and time-averaged pressures on the cylinder surface were obtained. Measurements of three velocity components of the flow at selected regions were also made using LDV techniques. Leishman & Bi (1994a, b) have made similar measurements using the configuration shown in Fig. 11.2. In both experiments, flow visualization of the tra­jectories of the wake vortices complemented the measurements. All of these results have helped to provide a reasonably comprehensive picture of the underlying interactional flow mechanisms, while also providing an extensive data base for validation of predictive models (see Section 11.2.5).

Based on the various experimental studies that have been performed, it is apparent that the unsteady airloads on the airframe that are associated with the presence of the rotor and its vortical wake can be classified into four distinct types. These are: 1. blade passage effects, 2.

1 o. o-rf^4

О

Подпись:

Unsteady Rotor-Fuselage Interactions

0.0 90.0 180.0 270.0 360.0 0.0

Blade azimuth position (time), – deg.

Figure 11.13 Characterization of unsteady pressure signatures on an airframe below a rotor, (a) Blade passage, (b) Close wake-surface impingement, (c) Wake-surface impinge­ment. (d) Post wake-surface impingement. Data source: Bi & Leis’nman (1990), Leisnman & Bi (1994b).

close wake-surface interactions, 3. wake-surface impingement, and 4. post wake-surface impingement.

Type-1 Interactions: Blade Passage Effects

Blade passage effects have been measured and reported by Bramwell (1966), Brand et al. (1989), Leishman & Bi (1990), and many other investigators. More recently, Le Pape et al. (2004) have measured surface pressure loads on a geometrically scaled helicopter fuselage model that were induced by blade passage. An example of the unsteady pressure response measured at a location directly under the rotor is shown in Fig. 11.13(a). The results show that large pulses are produced that are exactly in-phase with the blade passage over the body (i. e., for a four-bladed rotor they occur at jf = 0°, 90°, 180°, and 270°). This type of signature has been noted to be relatively independent of advance ratio so it must be associated with the local loading on the rotor itself; in other words, the main features of this type of signature are not coupled to the strength of the rotor wake or the rotor wake geometry. Therefore, it is called a blade passage effect and is classified as a Type-1 interaction.

The blade passage effect can be examined from a parsimonious potential flow analysis of a series of line vortices moving at velocity rQR (r = y/R) at a distance h above a surface. A simple model such as this is given by Bramwell (1966) with later extensions by Lorber & Egolf (1990) and Crouse et al. (1992). The vortex represents the bound circulation at some

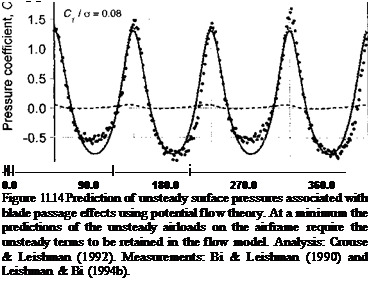
point on the blade at a radial distance у from the hub. The surface plane representing the body is made into a streamline of the flow using an image system. If the circulation along the blade is assumed to be uniform (a good assumption for a rotor with twisted blades operating in hover), then the circulation Г can be related to the blade loading using Eq. 3.111. With these assumptions, along with Kelvin’s equation for the velocity potential, it can be shown that the pressure coefficient at some point x on the surface is given as a function of blade azimuth, xj/, by

Подпись: where Подпись: cv о Подпись: (П.4)
Unsteady Rotor-Fuselage Interactions

(П. З)

The first term in Eq. 11.3 is a steady or quasi-steady contribution to the pressure and the second term is the unsteady contribution. Results using Eq. 11.3 are shown in Fig. 11.14 where the pressure signature is found to be in excellent quantitative agreement with the mea­surements. The unsteady term clearly dominates the quasi-steady term. This immediately illustrates the necessity of retaining the time-dependent terms in any type of predictive aerodynamic model, if the rotor-body interaction airloads are to be properly predicted.

Unsteady Rotor-Fuselage Interactions

The significance of the unsteady terms is further appreciated when the model is com­pared with the experimental data measured on the fuselage directly under the rotor disk.

Blade azimuth position (time), г|> – deg.

Distance from rotational axis, у / R

Подпись: Figure 11.15 Predicting the effects of blade passage loading on the airframe is relatively easy because it is mostly a noncirculatory effect and requires no knowledge of the rotor wake. Analysis: Crouse & Leishman (1992).

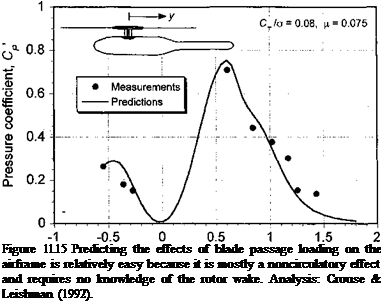
According to the model described by Eq. 11.3 the approximate magnitude of the unsteady pressures on the body resulting from the blade passage should be: 1. Proportional to the rotor disk loading (which is proportional to CTJo for a given rotor and tip speed), 2. In­versely proportional to the distance of the rotor blades above the measurement point (i. e., the rotor-body spacing), and 3. Proportional to the speed of the blade past the measurement point (i. e., rotor tip speed and distance along the blade). This parsimonious model confirms what is already known from numerous experimental studies, that the unsteady loads induced by blade passage effects will become much more pronounced on rotorcraft with higher disk loadings and smaller rotor-airframe spacing. Recall that the airframe loading in this case can be considered as a noncirculatory effect because it depends only on the blade loading and requires no explicit knowledge of the circulation that is shed or trailed into the rotor wake.

Figure 11.15 shows a comparison of the peak-to-peak values of the unsteady pressure at two points directly below the rotor as a function of rotor thrust. It can be seen that the agreement between theory (see also Section 11.2.5) and experiment is indeed very good. The blade passage effect is found to be largely independent of rotor advance ratio. This behavior is to be expected because any changes in either advance ratio or TPP angle will only slightly affect the longitudinal variation of lift over the rotor (i. e., the distribution of circulation on the rotor blades as they pass above the body). These results confirm the validity of more general potential flow approaches for rotor-airframe aerodynamics, such as those of Lorber & Egolf (1990), Crouse & Leishman (1992), and Waschpress et al.

(2003) .

Time-Averaged Effects on the Airframe

The effects of the generally nonsteady airloads averaged over many rotor revo­lutions are time-averaged effects. These can be considered as the effects that can affect the overall forces and moments on the airframe and, therefore, the flight characteristics of the helicopter as a whole. Wilson & Mineck (1975), Freeman & Mineck (1979), Sheridan & Smith (1979), Freeman & Wilson (1980), and Trept (1984) were among the first to conduct systematic tests to study the effects of the rotor wake on the time-averaged aero­dynamic characteristics of helicopter fuselages. Considerable downloads and yawing mo­ments induced by the rotor wake have been measured. The largest effects of the body on the rotor performance are in low-speed and hovering flight, and the body downloads are also the largest here. Subsequent experiments by other investigators [e. g., Smith & Betzina (1986), Liou et al. (1989a, b), Leishman & Bi (1990a)] have confirmed these basic findings.

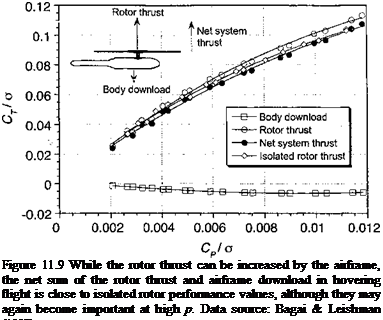
Подпись: Figure 11.9 While the rotor thrust can be increased by the airframe, the net sum of the rotor thrust and airframe download in hovering flight is close to isolated rotor performance values, although they may again become important at high p. Data source: Bagai & Leishman (1992).

It is instructive first to examine in detail the net lifting performance of the rotor system (rotor plus body) in hovering flight. Representative results are shown in Fig. 11.9 as a function of rotor power required for the generic subscale model shown in Fig. 11.2. As previously discussed, with the body present the rotor thrust is increased relative to the thrust of the isolated rotor for a given collective pitch or power setting. The body also experiences a download that increases with increasing thrust, and hence the downwash velocity is increased below the rotor. In fact, the measured results simply confirm that the download on the body is proportional to /2 as might be expected based on the discussion in Section 6.6.2. It is apparent that the increase in thrust on the rotor is almost exactly equal and opposite to the download on the body, at least within the bounds of experimental accuracy. The net thrust of the system also agrees closely with the isolated rotor results, and while perhaps not an entirely unexpected result, it is not obvious that this should be the case.

pAQ2R2

Mf

pAQ2R3

Подпись: CL, = Подпись: and CMf = Подпись: (11.1)

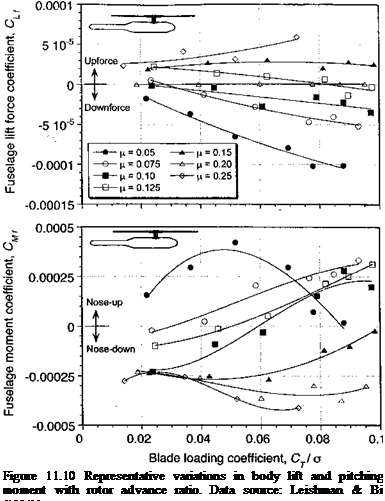
An example of the effects of the rotor on the lift and pitching moment of the body is shown in Fig. 11.10 for a range of rotor advance ratios up to д = 0.25; this would represent the range of д when transitioning from hover into forward flight or vice versa. Notice that the lift and pitching moment for the isolated body are close to zero for all advance ratios, so these results represent almost entirely the effects of the rotor on the integrated aerodynamics of the body. It should be noted that the results are plotted by nondimensionalizing the body forces and moments by using rotor tip speed, that is,

This is necessary because if standard coefficient values are used (based on free-stream velocity Vqo) the effect of increasing д will be to decrease the coefficient values for a constant lift and may produce misleading trends.

The results in Fig. 11.10 show that the rotor provides the most significant download on the body at low advance ratios. As the advance ratio is increased the download decreases,

Подпись: Figure 11.10 Representative variations in body lift and pitching moment with rotor advance ratio. Data source: Leishman & Bi (1994b).

and an upforce is actually obtained at high advance ratios. Similar results have been obtained by Smith & Betzina (1986). The source of the upflow reflects the low pressure region produced on the upper part of the body because of the higher-speed flow in the rotor wake (see Fig. 11.7). The results in Fig. 11.10 also show that the fuselage pitching moment decreases (i. e., the moment changes from nose-up to nose-down) with increasing advance ratio. This is because the rotor wake modifies the pressure distribution on the body such that the net center of pressure moves further aft from increasing the advance ratio (see Figs. 11.11 and 11.12). Overall, the foregoing results reflect the significant changes in the pressure distribution on the body as the position of the rotor wake is changed by varying rotor thrust and the advance ratio.

Подпись: C'p = 100 Подпись: p- Poo р(ПК? Подпись: (11.2)

We can examine in more detail the source of the pressure distribution found over the body surface. A pressure coefficient can be defined in terms of the rotor tip speed, QR, as

Time-Averaged Effects on the Airframe

Figure 11.11 Static pressure distribution on top and sides of a body at fx = 0.075. Data source: Leishman & Bi (1994b).

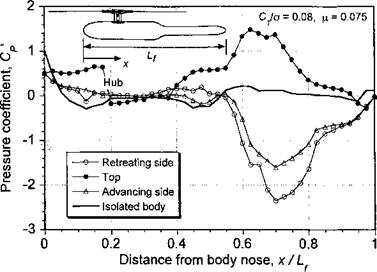
where the factor of 100 is simply a scaling. This form of coefficient was introduced by Liou et al. (1989a, b) and has become accepted by many investigators for the purposes of helicopter interactional aerodynamic studies because it gives an indication of the actual pressure on the body, so they can then be more readily compared at different advance ratios. Examples of the measured pressure distributions along the top and on the two sides of a body are shown in Fig. 11.11 for an advance ratio of 0.075. In general, the results show that the rotor wake has a pronounced effect on the body pressure distribution. A significant

Time-Averaged Effects on the Airframe

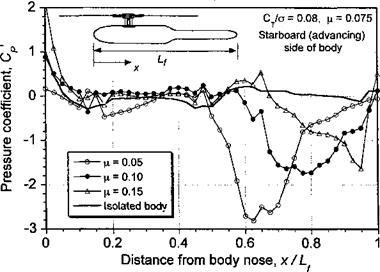
Figure 11.12 Static pressure distribution along the starboard side of a body as induced by the rotor at several rotor advance ratios. Data source: Leishman & Bi (1994b).

increase in static pressure is obtained over the top of the body in regions affected by the rotor wake because the wake induces a relatively high dynamic pressure there. There are large suction pressure peaks on the sides of the body, and this is a direct consequence of the wake flow being accelerated over the sides of the fuselage.

As the advance ratio is increased the wake is skewed back (see Fig. 11.7), and the re­sults in Fig. 11.12 show that the suction peaks produced by the rotor wake move aft along the body. It should be apparent that the high adverse pressure gradients downstream of the suction peaks will cause the boundary layer to be susceptible to flow separation. This is a good example, that shows why 3-D flow separation is inevitably always involved in helicopter airframe aerodynamics, and why the modeling of the flow over airframe surfaces will be relatively difficult (see also Section 14.7). Another aspect of the pressure distributions shown in Figs. 11.11 and 11.12 is that the distributions on the two sides of the rear fuselage are different, with a higher suction pressure obtained on the retreating (port) side of the tail boom. This indicates that because of the rotor wake the fuselage will experience both a side force (to port) and a yawing moment (nose-right) for a rotor rotating in the conventional (counterclockwise) direction. On an actual helicopter, this may be important from a handling qualities perspective, as pointed out by Wilson & Mineck (1975). Notice also that this side force is in a direction opposite to that required for anti-torque purposes, so a tail rotor will have to produce more thrust (and consume more power) to compensate. The integration of the tail rotor into the overall flow field, however, will further change the body airloads to some degree but there are few results available in this case that clearly delineate this effect.