Category When Is A Flow Compressible?

Solutions of Viscous Flows: A. Preliminary Discussion

The governing continuity, momentum, and energy equations for a general unsteady, compressible, viscous, three-dimensional flow are given by Equations (2.52), (15.19a to c), and (15.26), respectively. Examine these equations closely. They are nonlin­ear, coupled, partial differential equations. Moreover, they have additional terms— namely, the viscous terms—in comparison to the analogous equations for an inviscid flow treated in Part 3. Since we have already seen that the nonlinear inviscid flow equations do not lend themselves to a general analytical solution, we can certainly expect the viscous flow equations also not to have any general solutions (at least, at the time of this writing, no general analytical solutions have been found). This leads to the following question: How, then, can we make use of the viscous flow equations in order to obtain some practical results? The answer is much like our approach to the solution of inviscid flows. We have the following options:

1. There are a few viscous flow problems which, by their physical and geometrical nature, allow many terms in the Navier-Stokes solutions to be precisely zero, with the resulting equations being simple enough to solve, either analytically or by simple numerical methods. Sometimes this class of solutions is called “exact solutions” of the Navier-Stokes equations, because no simplifying approxima­tions are made to reduce the equations—just precise conditions are applied to reduce the equations. Chapter 16 is devoted to this class of solutions; examples are Couette flow and Poiseuille flow (to be defined later).

2. We can simplify the equations by treating certain classes of physical problems for which some terms in the viscous flow equations are small and can be neglected. This is an approximation, not a precise condition. The boundary-layer equations developed and discussed in Chapter 17 are a case in point. However, as we will see, the boundary-layer equations may be simpler than the full viscous flow equations, but they are still nonlinear.

3. We can tackle the solution of the full viscous flow equations by modem numerical techniques. For example, some of the computational fluid dynamic algorithms discussed in Chapter 13 in conjunction with “exact” solutions for the inviscid flow equations carry over to exact solutions for the viscous flow equations. These matters will be discussed in Chapter 20.

There are some inherent very important differences between the analysis of vis­cous flows and the study of inviscid flows that were presented in Parts 2 and 3. The remainder of this section highlights these differences.

First, we have already demonstrated in Example 2.4 that viscous flows are ro­tational flows. Therefore, a velocity potential cannot be defined for a viscous flow, thus losing the attendant advantages that were discussed in Sections 2.15 and 11.2. On the other hand, a stream function can be defined, because the stream function satisfies the continuity equation and has nothing to do with the flow being rotational or irrotational (see Section 2.14).

Second, the boundary condition at a solid surface for a viscous flow is the no­slip condition. Due to the presence of friction between the surface material and the adjacent layer of fluid, the fluid velocity right at the surface is zero. This no-slip condition was discussed in Section 15.2. For example, if the surface is located at у = 0 in a cartesian coordinate system, then the no-slip boundary condition on velocity is

At у = 0; и = 0 u = 0 w = 0

This is in contrast to the analogous boundary condition for an inviscid flow, namely, the flow-tangency condition at a surface as discussed in Section 3.7, where only the component of the velocity normal to the surface is zero. Also, recall that for an inviscid flow, there is no boundary condition on the temperature; the temperature of the gas adjacent to a solid surface in an inviscid flow is governed by the physics of the flow field and has no connection whatsoever with the actual wall temperature. However, for a viscous flow, the mechanism of thermal conduction ensures that the temperature of the fluid immediately adjacent to the surface is the same as the temperature of

the material surface. In this respect, the no-slip condition is more general than that applied to the velocity; in addition to и = v = 0 at the wall, we also have T = Tw at the wall, where T is the gas temperature immediately adjacent to the wall and Tw is the temperature of the surface material. Thus,

Aty= 0: T = TW [15.34]

Tn many problems, Tw is specified and held constant; this boundary condition is easily applied. However, consider the following, more general case. Imagine a viscous flow over a surface where heat is being transferred from the gas to the surface, or vice versa. Also, assume that the surface is at a certain temperature, Tw, when the flow first starts, but that Tw changes as a function of time as the surface is either heated or cooled by the flow [i. e., Tw = Tw(t)]. Because this timewise variation is dictated in part by the flow which is being calculated, Tw becomes an unknown in the problem and must be calculated along with the solution of the viscous flow. For this general case, the boundary condition at the surface is obtained from Equation (15.2) applied at the wall; that is,

Aty= 0: qw = -(kd-^j [15.35]

Here, the surface material is responding to the heat transfer to the wall qw, hence changing Tw, which in turn affects qw. This general, unsteady heat transfer problem must be solved by treating the viscous flow and the thermal response of the material simultaneously. This problem is beyond the scope of the present book.

Finally, let us imagine the above, unsteady case carried out to the limit of large times. That is, imagine a wind-tunnel model which is at room temperature suddenly inserted in a supersonic or hypersonic stream. At early times, say, for the first few sec­onds, the surface temperature remains relatively cool, and the assumption of constant wall temperature Tw is reasonable [Equation (15.34)]. However, due to the heat trans­fer to the model [Equation (15.35)], the surface temperature soon starts to increase and becomes a function of time, as discussed in the previous paragraph. However, as Tw increases, the heating rate decreases. Finally, at large times, Tw increases to a high enough value that the net heat transfer rate to the surface becomes zero, that is, from Equation (15.35),

q<u

or (— =0 [15.36]

Ь К

When the situation of zero heat transfer is achieved, a state of equilibrium exists; the wall temperature at which this occurs is, by definition, the equilibrium wall tempera­ture, or, as it is more commonly denoted, the adiabatic wall temperature, Taw. Hence, for the case of an adiabatic wall (no heat transfer), the wall boundary condition is given by Equation (15.36).

In summary, for the wall boundary condition associated with the solution of the energy equation [Equation (15.26)], we have three possible cases:

1. Constant temperature wall, where Tw is a specified constant [Equation (15.34)]. For this given wall temperature, the temperature gradient at the wall (dT/dy)w is obtained as part of the flow-field solution and allows the direct calculation of the aerodynamic heating to the wall via Equation (15.35).

2. The general, unsteady case, where the heat transfer to the wall qw causes the wall temperature Tw to change, which in turn causes qw to change. Here, both Tw and (ЗT/3 v )„ change as a function of time, and the problem must be solved by treating jointly the viscous flow as well as the thermal response of the wall mate­rial (which usually implies a separate thermal conduction heat transfer numerical analysis).

3. The adiabatic wall case (zero heat transfer), where (дТ/dy)w = 0 [Equa­tion)^.36)]. Here, the boundary condition is applied to the temperature gradient at the wall, not to the wall temperature itself. Indeed, the wall temperature for this case is defined as the adiabatic wall temperature Taw and is obtained as part of the flow-field solution.

Finally, we emphasize again that, from the point of view of applied aerodynamics, the practical results obtained from a viscous flow analysis are the skin friction and heat transfer at the surface. However, to obtain these quantities, we usually need a complete solution of the viscous flow field; among the data obtained from such a solution are the velocity and temperature gradients at the wall. These, in turn, allow the direct calculation of rw and qw from

and

Another practical result provided by a viscous flow analysis is the prediction and calculation of flow separation; we have discussed numerous cases in the preceding chapters where the pressure field around an aerodynamic body can be greatly changed by flow separation; the flows over cylinders and spheres (see Sections 3.18 and 6.6) are cases in point.

Clearly, the study of viscous flow is important within the entire scope of aero­dynamics. The purpose of the following chapters is to provide an introduction to such flows. We will organize our study following the three options itemized at the beginning of this section; that is, we will treat, in turn, certain specialized “exact” solutions of the Navier-Stokes equations, boundary-layer solutions, and then “exact” numerical solutions of Navier-Stokes equations. In so doing, we hope that the reader will gain an overall, introductory picture of the whole area of viscous flow. Entire books have been written on this subject, see, for example, References 42 and 43. We cannot possibly present such detail here; rather, our objective is simply to provide a “feel” for and a basic understanding of the material. Let us proceed.

Problems

1. Consider the incompressible viscous flow of air between two infinitely long parallel plates separated by a distance h. The bottom plate is stationary, and the top plate is moving at the constant velocity ue in the direction of the plate. Assume that no pressure gradient exists in the flow direction.

(a) Obtain an expression for the variation of velocity between the plates.

(b) If T = constant = 320 K, ue = 30 m/s, and h = 0.01 m, calculate the shear stress on the top and bottom plates.

2. Assume that the two parallel plates in Problem 15.1 are both stationary but that a constant pressure gradient exists in the flow direction (i. e., dp/dx = constant).

(a) Obtain an expression for the variation of velocity between the plates.

(b) Obtain an expression for the shear stress on the plates in terms of dp/dx.

Final Comments

This chapter and the previous two have dealt with boundary layers, especially those on a flat plate. We end with the presentation of a photograph in Figure 19.2 showing the development of velocity profiles in the boundary layer over a flat plate. The fluid is water, which flows from left to right. The profiles are made visible by the hydrogen bubble technique, the same used for Figure 16.13. The Reynolds number is low (the freestream velocity is only 0.6 m/s); hence, the boundary-layer thickness is large. However, the thickness of the plate is only 0.5 mm, which means that the boundary layer shown here is on the order of 1 mm thick—still small on an absolute scale. In any event, if you need any further proof of the existence of boundary layers, Figure 19.2 is it.

19.5 Summary

Approximations for the turbulent, incompressible flow over a flat plate are

0.37 x

[19.1]

Re[./5

0.074

[19.2]

Cf = —– Г77

Re,1/5

To account for compressibility effects, the data shown in Figure 19.1 can be used, temperature method can be employed.

or alternatively the reference

Problems

Note: The standard sea level value of viscosity coefficient for air is д = 1.7894 x 10⁻⁵ kg/(m • s) = 3.7373 x 1СГ7 slug/(ft • s).

1. The wing on a Piper Cherokee general aviation aircraft is rectangular, with a span of 9.75 m and a chord of 1.6 m. The aircraft is flying at cruising speed (141 mi/h) at sea level. Assume that the skin friction drag on the wing can be approximated by the drag on a flat plate of the same dimensions. Calculate the skin friction drag:

(a) If the flow were completely laminar (which is not the case in real life)

(b) If the flow were completely turbulent (which is more realistic)

Compare the two results.

2. For the case in Problem 19.1, calculate the boundary-layer thickness at the trailing edge for

(a) Completely laminar flow

(b) Completely turbulent flow

3. For the case in Problem 19.1, calculate the skin friction drag accounting for transition. Assume the transition Reynolds number = 5 x 10s.

4. Consider Mach 4 flow at standard sea level conditions over a flat plate of chord 5 in. Assuming all laminar flow and adiabatic wall conditions, calculate the skin friction drag on the plate per unit span.

5. Repeat Problem 19.4 for the case of all turbulent flow.

6. Consider a compressible, laminar boundary layer over a flat plate. Assuming Pr = 1 and a calorically perfect gas, show that the profile of total temperature through the boundary layer is a function of the velocity profile via

To = Tw + (7oe — Tw) — ue

where Tw = wall temperature and To,,, and ue are the total temperature and velocity, respectively, at the outer edge of the boundary layer. [Hint: Compare Equations (18.32) and (18.41).]

7. Consider a high-speed vehicle flying at a standard altitude of 35 km, where the ambient pressure and temperature are 583.59 N/m2 and 246.1 K, respectively. The radius of the spherical nose of the vehicle is 2.54 cm. Assume the Prandtl number for air at these conditions is 0.72, that cp is 1008 joules/(kg K), and that the viscosity coefficient is given by Sutherland’s law. The wall temperature at the nose is 400 K. Assume the recovery factor at the nose is 1.0. Calculate the aero­dynamic heat transfer to the stagnation point for flight velocities of (a) 1500 m/s, and (b) 4500 m/s. From these results, make a comment about how the heat transfer varies with flight velocity.

Calculation of Normal Shock-Wave Properties

Подпись: Consider again the road map given in Figure 8.2. We have finished our three side trips (Sections 8.3 to 8.5) and are now ready to get back on the main road toward the calculation of changes of flow properties across a normal shock wave. Return again to Section 8.2, and recall the basic normal shock equations given by Equations (8.2),
(8.6), and (8.10):

Continuity: pi «і = Р2И2 [8.2]

Momentum: p + plu2 = p2 + ргм2 [8.6]

Energy: h + у = h2 + у [8.10]

In addition, for a calorically perfect gas, we have

h2 = cpT2 [8.40]

p2 = p2RT2 [8.50]

Return again to Figure 8.3, and recall the basic normal shock-wave problem: given the conditions in region 1 ahead of the shock, calculate the conditions in region 2 behind the shock. Examining the five equations given above, we see that they involve five unknowns, namely, p2, u2, p2, h2, and T2. Hence, Equations (8.2), (8.6), (8.10), (8.49), and (8.50) are sufficient for determining the properties behind a normal shock wave in a calorically perfect gas. Let us proceed.

First, dividing Equation (8.6) by (8.2), we obtain

P1 , P 2 ,

——– h U ———– h u2

PU p2U2

Подпись: [8.51]P P2

——- — —– = W 2 — U1

PU p2U2

Calculation of Normal Shock-Wave Properties Подпись: U-2 — U Подпись: [8.52]

Recalling from Equation (8.23) that a = л/ур/р, Equation (8.51) becomes

Equation (8.52) is a combination of the continuity and momentum equations. The energy equation, Equation (8.10), can be used in one of its alternate forms, namely, Equation (8.35), rearranged below, and applied first in region 1 and then in region 2:

Calculation of Normal Shock-Wave Properties

+ 1


У-1

2


Calculation of Normal Shock-Wave Properties

[8.53]


2


Calculation of Normal Shock-Wave Properties

and


[8.54]


2


In Equations (8.53) and (8.54), a* is the same constant value because the flow across the shock wave is adiabatic (see Sections 7.5 and 8.5). Substituting Equations (8.53) and (8.54) into Equation (8.52), we have

Подпись: и 2 — и і «2 — И] у + 1 а*2 у — 1 у + 1 а*2 у — 1

————— — ——- ц, ——————- _|_ —– до о

2 yu 2 у 2 уиг 2 у

Подпись:У + 1 ч *2 , к – 1 ч

———- (u2-ui)a + ——(и2-иі)

2yuu2 2у

Подпись: *2 Подпись: У- 1 2y Подпись: У + 1 2yuiu2

Dividing by и2 — мі, we obtain

Solving for a*, we obtain

Подпись: a*2 = Uyii2[8.55]

Equation (8.55) is called the Prandtl relation and is a useful intermediate relation for normal shock waves. For example, from Equation (8.55),

Подпись:и і и 2 a* a*

Recall the definition of characteristic Mach number, M* — и /a*, given in Section

8.4. Hence, Equation (8.56) becomes

1 = M*M*

* 1 , , or = [8.57]

2 M

Substituting Equation (8.48) into (8.57), we have

Подпись: [8.58](у + V)M Г (у + l)M2 I 1 2 + (у — У)М L2 + (k-1)M2.

Подпись: 1 + [(Y ~ l)/2]M2 yM2 — (y — l)/2 Подпись: [8.59]

Solving Equation (8.58) for M, we obtain

Equation (8.59) is our first major result for a normal shock wave. Examine Equation

(8.59) closely; it states that the Mach number behind the wave M2, is a function only of the Mach number ahead of the wave M. Moreover, if M = 1, then M2 = 1. This is the case of an infinitely weak normal shock wave, defined as a Mach wave. Furthermore, if M > 1, then M2 < T, that is, the Mach number behind the normal shock wave is subsonic. As M increases above 1, the normal shock wave becomes stronger, and M2 becomes progressively less than 1. However, in the limit as M —у
oo, M2 approaches a finite minimum value, M2 V(K — l)/2y, which for air is 0.378.

Let us now obtain the ratios of the thermodynamic properties p2/pi, p2/pi, and T2/Tі across a normal shock wave. Rearranging Equation (8.2) and using Equation

(8.55) , we have

Подпись: [8.60]Подпись: [8.61]Pi _ u_ _ u] _ lP_ _

Pi u2 и2П] a*2 Substituting Equation (8.48) into (8.60), we obtain

P2 _ U_ __ (к + 1)M2 Pi m2 2 + (y – l)Aff

To obtain the pressure ratio, return to the momentum equation, Equation (8.6), com­bined with the continuity equation, Equation (8.2):

Подпись: [8.6a]29 ? I ^2

Pl — Pl = PU — p2U2 = PU{U — U2) = PiMj I 1———

Ml

Подпись: P2 - Pl Pl Подпись: YPU YPi Подпись: «2 Ml Подпись: Yu Подпись: М2 Ml Подпись: [8.63]

Dividing Equation (8.62) by pb and recalling that aj5 = ypi/pi, we obtain

For m2/mi in Equation (8.63), substitute Equation (8.61):

Подпись: P2 _ Pi 1.2 = YM; PI Подпись:2+ (x – 1)M2_I

(K + 1)M2 J

Подпись: Pi Y + 1 Подпись: [8.65]

Equation (8.64) simplifies to

To obtain the temperature ratio, recall the equation of state p = pRT. Hence,

Подпись:[8.66]

Подпись: T2 _ h2 T~i~h~i Calculation of Normal Shock-Wave Properties Подпись: 2 + (y - 1)M2 (y + l)M2 Подпись: [8.67]

Substituting Equations (8.61) and (8.65) into (8.66), and recalling that h = cpT, we obtain

Equations (8.61), (8.65), and (8.67) are important. Examine them closely. Note that p2/pi, pi/pi, and T2/T axe functions of the upstream Mach number M only. Therefore, in conjunction with Equation (8.59) for M2, we see that the upstream Mach number M is the determining parameter for changes across a normal shock wave in a

Подпись: [8.68]Подпись:calorically perfect gas. This is a dramatic example of the power of the Mach number as a governing parameter in compressible flows. In the above equations, if Mi = 1, then рг/р = Рі/P = T2/T1 = 1; that is, we have the case of a normal shock wave of vanishing strength—a Mach wave. As M] increases above 1, pilp, Р2/p, and Тг/Т progressively increase above 1. In the limiting case of Mi —»• 00 in Equations

(8.59) , (8.61), (8.65), and (8.67), we find, for у = 1.4,

Подпись:у — 1

——- = 0.378 (as discussed previously)

Calculation of Normal Shock-Wave Properties

2 Y

Note that, as the upstream Mach number increases toward infinity, the pressure and temperature increase without bound, whereas the density approaches a rather moder­ate finite limit.

We have stated earlier that shock waves occur in supersonic flows; a stationary normal shock such as shown in Figure 8.3 does not occur in subsonic flow. That is, in Equations (8.59), (8.61), (8.65), and (8.67), the upstream Mach number is supersonic M] > 1. However, on a mathematical basis, these equations also allow solutions for Mi < 1. These equations embody the continuity, momentum, and energy equations, which in principle do not care whether the value of Mi is subsonic or supersonic. Here is an ambiguity which can only be resolved by appealing to the second law of thermodynamics (see Section 7.2). Recall that the second law of thermodynamics determines the direction which a given process can take. Let us apply the second law to the flow across a normal shock wave, and examine what it tells us about allowable values of Mi.

First, consider the entropy change across the normal shock wave. From Equation (7.25),

Подпись:І2 P2

2+(y – DM?
(Y + DM,[1]

Calculation of Normal Shock-Wave Properties
S2-S] = cp In — – R In — Ti p

obey the second law. However, if M < 1, then Equation (8.68) gives, v2 – ,V| < 0, which is not allowed by the second law. Consequently, in nature, only cases involving Mі > 1 are valid; that is, normal shock waves can occur only in supersonic flow.

Why does the entropy increase across the shock wave? The second law tells us that it must, but what mechanism does nature use to accomplish this increase? To answer these questions, recall that a shock wave is a very thin region (on the order of 1СГ5 cm) across which some large changes occur almost discontinuously. Therefore, within the shock wave itself, large gradients in velocity and temperature occur; that is, the mechanisms of friction and thermal conduction are strong. These are dissipative, irreversible mechanisms that always increase the entropy. Therefore, the precise entropy increase predicted by Equation (8.68) for a given supersonic M is appropriately provided by nature in the form of friction and thermal conduction within the interior of the shock wave itself.

In Section 7.5, we defined the total temperature 7b and total pressure po – What happens to these total conditions across a shock wave? To help answer this question, consider Figure 8.7, which illustrates the definition of total conditions ahead of and behind the shock. In region 1 ahead of the shock, a fluid element has the actual conditions of Mi, p[, T], and, sr. Now imagine that we bring this fluid element to rest isentropically, creating the “imaginary” state la ahead of the shock. In state la, the fluid element at rest would have a pressure and temperature po, and To. , respectively, that is, the total pressure and total temperature, respectively, in region 1. The entropy in state la would still be, V| because the fluid element is brought to rest isentropically; sia = Now consider region 2 behind the shock. Again consider a fluid element with the actual conditions of M2, p2. /2, and, s2, as sketched in Figure 8.7. And again let us imagine that we bring this fluid element to rest isentropically, creating the “imaginary” state 2a behind the shock. In state 2a, the fluid element at rest would

©

Calculation of Normal Shock-Wave Properties Calculation of Normal Shock-Wave Properties

M2 < 1

Подпись:Imaginary state 1 a where the fluid element has been brought to rest is­entropically. Thus, in state la, the pressure is p0,i (by definition). Entropy is still Si. Temperature is Tq і (by definition).
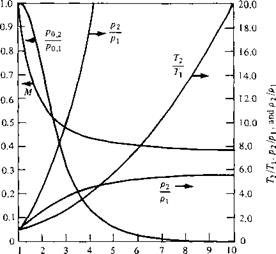
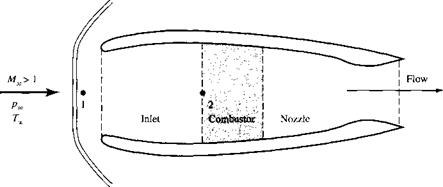
Figure 8.7 Total conditions ahead of and behind a normal shock wave.

have pressure and temperature po,2 and To,2, respectively, that is, the total pressure and total temperature, respectively, in region 2. The entropy in state 2a would still be S2 because the fluid element is brought to rest isentropically; ,s’2a = .s’2- The questions are now asked: How does To,2 compare with 7b, 1, and how does p0,2 compare with

Po, i?

To answer the first of these questions, consider Equation (8.30):

cpT1 + ^=cpT2 + £ 18.30]

From Equation (8.38), the total temperature is given by

u2

cpT0 = cpT + — [8.38]

Combining Equations (8.30) and (8.38), we have

Подпись: or Подпись: 7o, 1 = 7b,2 Подпись: [8.69]

cp7b, i = cpTo,2

Equation (8.69) states that total temperature is constant across a stationary normal shock wave. This should come as no surprise; the flow across a shock wave is adiabatic, and in Section 7.5 we demonstrated that in a steady, adiabatic, inviscid flow of a calorically perfect gas, the total temperature is constant.

To examine the variation of total pressure across a normal shock wave, write Equation (7.25) between the imaginary states la and 2a:

•S2a – Sla = Cp ІП ———- R ІП —- [8.70]

T a p la

Calculation of Normal Shock-Wave Properties Calculation of Normal Shock-Wave Properties

However, from the above discussion, as well as the sketch in Figure 8.7, we have •?2a = S2, ria = 7га = 7b,2, 7)a — 7Ь, і, рга = Po,2, and pia = P0,. Thus, Equa­tion (8.70) becomes

From Equation (8.68), we know that S2 — si >0 for a normal shock wave. Hence, Equation (8.73) states that po,2 < Рол – The total pressure decreases across a shock wave. Moreover, since S2 — «і is a function of M only [from Equation (8.68)], then Equation (8.73) clearly states that the total pressure ratio ро, г/Po, across a normal shock wave is a function of M only.

Calculation of Normal Shock-Wave Properties

.n.

<N

О

Cl.

ТЭ

C

Л

(N

5


M!


Figure 8.8 The variation of properties across a normal shock wave as a function of upstream Mach number: у = 1.4.


Calculation of Normal Shock-Wave Properties

In summary, we have now verified the qualitative changes across a normal shock wave as sketched in Figure 7.4b and as originally discussed in Section 7.6. Moreover, we have obtained closed-form analytic expressions for these changes in the case of acalorically perfect gas. We have seen that p2/p, Pi/Pi, Ті/Ту М2, and рол/Рол are functions of the upstream Mach number M only. To help you obtain a stronger physical feeling of normal shock-wave properties, these variables are plotted in Figure

8.8 as a function of M. Note that (as stated earlier) these curves show how, as M becomes very large, T2/Ti and p2/p also become very large, whereas рг/p and M2 approach finite limits. Examine Figure 8.8 carefully, and become comfortable with the trends shown.

The results given by Equations (8.59), (8.61), (8.65), (8.67), and (8.73) are so important that they are tabulated as a function of M in Appendix В for у = 1 -4.

Consider a normal shock wave in air where the upstream flow properties are u = 680 m/s, T = 288 K, and />, = I atm. Calculate the velocity, temperature, and pressure downstream of the shock.

Solution

a, = У/ЛГ, = У 1.4(287)(288) = 340 m/s

Подпись: M,Подпись: Example 8.4u, _ 680 a/ ~ 340

Подпись: Example 8.5A ramjet engine is an air-breathing propulsion device with essentially no rotating machinery (no rotating compressor blades, turbine, etc.). The basic generic parts of a conventional ramjet are sketched in Figure 8.9. The flow, moving from left to right, enters the inlet, where it is compressed and slowed down. The compressed air then enters the combustor at very low subsonic speed, where it is mixed and burned with a fuel. The hot gas then expands through a nozzle. The net result is the production of thrust towards the left in Figure 8.9. In this figure the ramjet is shown in a supersonic freestream with a detached shock wave ahead of the inlet. The portion of the shock just to the left of point 1 is a normal shock. (A detached normal shock wave in front of the inlet of a ramjet in a supersonic flow is not the ideal operating condition; rather, it is desirable that the flow pass through one or more oblique shock waves before entering the inlet. Oblique shock waves are discussed in Chapter 9.) After passing through the shock wave, the flow from point 1 to point 2, located at the entrance to the combustor, is isentropic. The ramjet is flying at Mach 2 at a standard altitude of 10 km, where the air pressure and temperature are 2.65 x 10⁴ N/m2 and 223.3 K, respectively. Calculate the air temperature and pressure at point 2 when the Mach number at that point is 0.2.

Solution

The total pressure and total temperature of the freestream at M= 2 can be obtained from Appendix A.

Po. oo = j Poo = (7.824)(2.65 x 10⁴) = 2.07 x 10s N/m2

Calculation of Normal Shock-Wave Properties

Calculation of Normal Shock-Wave Properties

Figure 8.9 Schematic of a conventional subsonic-combustion ramjet engine.


To, c

Подпись: Tx = (1.8)(223.3) = 401.9 КCalculation of Normal Shock-Wave PropertiesAt point 1 behind the normal shock, the total pressure is, from Appendix B, for M-< = 2

Рол = ( — ) po. oc = (0.7209)(2.07 x 10⁵) = 1.49 x 10⁵ N/m2

VPo. cc/

The total temperature is constant across the shock, hence

To. і = T0,^ =401.9 К

Calculation of Normal Shock-Wave Properties Подпись: Example 8.6

The flow is isentropic between points 1 and 2, hence po and T0 are constant between these points. Therefore, p0,2 = 1.49 x 10⁵ N/m2 and T0-2 = 401.9 K. At point 2, where M2 = 0.2, the ratios of the total-to-static pressure and total-to-static temperature, from Appendix A, are Рол/Pi = 1-028 and T02/T2 = 1.008. Hence,

At point 1, from Appendix В for = 10, we have

Подпись: Po,) (po. oo) = (0.3045 x 10_2)(1.125 x 10⁹) = 3.43 x 10⁶ N/m2

PO. oc /

At point 2, where M2 = 0.2, we have from Example 8.5, po, i/pi = 1.028 and T0,i/T2 Also at point 2, since the flow is isentropic between points 1 and 2,

Подпись: 1.008.p0,2 = Po. i = 3.43 x 10⁶ N/m2 Ta, i = Год = 4690 К

Calculation of Normal Shock-Wave Properties Calculation of Normal Shock-Wave Properties Calculation of Normal Shock-Wave Properties

Hence,

Подпись: Pi Подпись: 3.34 x 10⁶ 1.02 x 10⁵ Подпись: 32.7 atm

In atmospheres,

Compared to the rather benign conditions at point 2 existing for the case treated in Example 8.5, in the present example the air entering the combustor is at a pressure and temperature of 32.7 atm and 4653 К—both extremely severe conditions. The temperature is so hot that the fuel injected into the combustor will decompose rather than bum, with little or no thrust being produced. Moreover, the pressure is so high that the structural design of the combustor would have to be extremely heavy, assuming in the first place that some special heat-resistant material could be found that could handle the high temperature. In short, a conventional ramjet, where the flow is slowed down to a low subsonic Mach number before entering the combustor, will not work at high, hypersonic Mach numbers. The solution to this problem is not to slow the flow inside the engine to low subsonic speeds, but rather to slow it only to a lower but still supersonic speed. In this manner, the temperature and pressure increase inside the engine will be smaller and can be made tolerable. In such a ramjet, the entire flowpath through the engine remains at supersonic speed, including inside the combustor. This necessitates the injection and mixing of the fuel in a supersonic stream—a challenging technical problem. This type of ramjet, where the flow is supersonic throughout, is called a supersonic combustion ramjet—SCRAMjet for short. SCRAMjets are a current area of intense research and advanced development; at the time of writing no viable SCRAMjet engine has successfully powered a flight vehicle. This will soon change. SCRAMjet engines are the only viable airbreathing power plants for hypersonic cmise vehicles. Aspects of SCRAMjet engine design will be discussed in Chapter 9.

Internal Points

Consider the internal grid points 1, 2, and 3 as shown in Figure 13.5. Assume that we know the location of points 1 and 2, as well as the flow properties at these points. Define point 3 as the intersection of the C__ characteristic through point 1 and the C+ characteristic through point 2. From our previous discussion, (K…) = (K_)^

because К.. is constant along a given C characteristic. The value of (K_) = (К _) у

is obtained from Equation (13.17) evaluated at point 1:

(K-) з = (A_)i = в + и і

Figure 13.5 Characteristic mesh used for the

location of point 3 and the calculation of flow conditions at point 3, knowing the locations and flow properties at points 1 and 2.

Similarly, (К+)г = (К+)з because K+ is constant along a given C+ characteristic. The value of (K+)2 = (К+)з is obtained from Equation (13.18) evaluated at point 2:

(K+h = (K+h = 6>2 – v2 [13.30]

Now evaluate Equations (13.17) and (13.18) at point 3:

e3 + v3 = (K-h [13.31]

and 03 – v3 = (K+)3 [13.33]

In Equations (13.21) and (13.22), (К_)з and (K+ )3 are known values, obtained from Equations (13.19) and (13.20). Hence, Equations (13.21) and (13.22) are two alge­braic equations for the two unknowns в3 and v3. Solving these equations, we obtain

въ = [{К-)1 + {К+)2] [13.33]

v3 = ±[(K-)i ~(K+)2] [13.34]

Knowing 03 and v3, all other flow properties at point 3 can be obtained as follows:

1. From Уз, obtain the associated M3 from Appendix C.

2. From M3 and the known po and 7b for the flow (recall that for inviscid, adiabatic flow, the total pressure and total temperature are constants throughout the flow), find p3 and r3 from Appendix A.

3. Knowing 7з, compute a3 = RT3. In turn, V3 = M3a3.

As stated earlier, point 3 is located by the intersection of the C_ and C+ characteristics through points 1 and 2, respectively. These characteristics are curved lines; however, for purposes of calculation, we assume that the characteristics are straight-line seg­ments between points 1 and 3 and between points 2 and 3. For example, the slope of the C – characteristic between points 1 and 3 is assumed to be the average value between these two points, that is, j($i +03) — ^(j± + д3). Similarly, the slope of the C+ characteristic between points 2 and 3 is approximated by ^ (02 + #з) + (дг +Дз)-

Time-Dependent Finite-Difference Method

Return to the picture of Couette flow in Figure 16.2. Imagine, for a moment, that the space between the upper and lower plates is filled with a flow field which is not a Couette flow; for example, imagine some arbitrary flow field with gradients in both the x and у directions, including gradients in pressure. We can imagine such a flow existing at some instant during the start-up process just after the upper plate is set into motion. This would be a transient flow field, where и, T, p, etc., would be functions of time t as well as of r and y. Finally, after enough time elapses, the flow will approach a steady state, and this steady state will be the Couette flow solution discussed above. Let us track this picture numerically. That is, starting from an assumed initial flow field at time t = 0, let us solve the unsteady Navier-Stokes equations in steps of

time until a steady flow is obtained at large times. As discussed in Section 13.5, the time-asymptotic steady flow is the desired result; the time-dependent approach is just a means to that end. At this stage in our discussion, it would be well for you to review the philosophy (not the details) presented in Section 13.5 before progressing further.

The Navier-Stokes equations are given by Equations (15.18a to c) and (15.26). For an unsteady, two-dimensional flow, they are Continuity:

dp d(pu) d(pv)

dt dx dy

x momentum:

du

~dt

у momentum:

dv

~dt

d{uTxx) d(uryx) d(vrxy) d(vzyy) |

dx dy dx dy J

Note that Equations (16.66) to (16.69) are written with the time derivatives on the left-hand side and spatial derivatives on the right-hand side. These are analogous to the form of the Euler equations given by Equations (13.59) to (13.62). In Equa­tions (16.67) to (16.69), rxy, rxx, and xyy are given by Equations (15.5), (15.8), and (15.9), respectively.

The above equations can be solved by means of MacCormack’s method as de­scribed in Chapter 13. This is a predictor-corrector approach, and its arrangement for the time-dependent method is described in Section 13.5. The application to com­pressible Couette flow is outlined as follows:

1. Divide the space between the two plates into a finite-difference grid, as sketched in Figure 16.8a. The length L of the grid is somewhat arbitrary, but it must be longer than a certain minimum, to be described shortly.

2. At x — 0 (the inflow boundary), specify some inflow conditions for u, v, p, and T (hence, e, since e = cvT). The incompressible solution for Couette flow makes reasonable inflow boundary conditions.

3. At all the remaining grid points, arbitrarily assign values for all the flow-field variables, u, v, p, and T. This arbitrary flow field, which constitutes the initial conditions at t = 0, can have finite values of v, and can include pressure gradients.

4. Starting with the initial flow field established in step 3, solve Equations (16.66) to

(16.69) in steps of time. For example, consider the x-momentum equation in the form of Equation (16.67). MacCormack’s predictor-corrector method, applied to this equation, is as follows.

Predictor: Assume that we know the complete flow field at time t, and we wish to advance the flow-field variables to time / + Д/. Replace the spatial derivatives with forward differences:

(Ljx)/,_/+1 (j-yx)i. j

Ду

All the quantities on the right-hand side are known at time t; we want to advance the flow-field values to the next time, t + At. That is, the right-hand side of Equation (16.70) is a known number at time t. Form the predicted value of u, j at time t + At, denoted by m; j from the first two terms of a Taylor’s series as

Calculate predicted values for p, v, and e, namely, /),. /, v,,;, and e, ,, by the same approach applied to Equations (16.66), (16.68), and (16.69), respectively. Do this for all the grid points in Figure 16.8a.

Corrector: Return to Equation (16.67), and replace the spatial derivatives with rearward differences using the predicted (barred) quantities obtained from the predictor step:

(tyx)i, j (tyx)i. j— 1

~Ay

Finally, calculate the corrected value of m,,/ at time t + At, denoted by from the first two terms of a Taylor’s series using an average time derivative

obtained from Equations (16.70) and (16.72). That is,

[16.73]

Carry out the same process using Equations (16.66), (16.68), and (16.69) to obtain p^At, и’+л’, and е’+л’. The complete flow field at time t + At is now obtained.

5. Repeat step 4, except starting with the newly calculated flow-field variables at the previous time. The flow-field variables will change from one time step to the next. This transient flow field will not even have parallel streamlines; i. e., there will be finite values of v throughout the flow. This is sketched in Figure 16.86. Make the calculations for a large number of time steps; as we go out to large times, the changes in the flow-field variables from one time step to another will become smaller. Finally, if we go out to a large enough time (hundreds, sometimes even thousands, of time steps in some problems), the flow-field variables will not change anymore—a steady flow will be achieved, as sketched in Figure 16.8c. Moving from left to right in Figure 16.8c, we see a developing flow near the entrance, influenced by the assumed inflow profile. However, at the right of Figure 16.8c, the history of the inflow has died out, and the flow-field profiles become independent of distance. Indeed, we have chosen L to be a sufficient length for this to occur. The flow field near the exit is the desired solution to the compressible Couette flow problem.

The value of At in Equations (16.71) and (16.73) is not arbitrary. The steps outlined above constitute an explicit finite-difference method, and hence there is a stability bound on At. The value of At must be less than some prescribed maximum, or else the numerical solution will become unstable and “blow up” on the computer. A useful expression for At is the Courant-Friedrichs-Lewy (CFL) criterion, which states that At should be the minimum of Atx and Aty, where

In Equation (16.74), a is the local speed of sound. Equation (16.74) is evaluated at every grid point, and the minimum value is used to advance the whole flow field.

The time-dependent technique described above is a common approach to the solution of the compressible Navier-Stokes equations, and for that reason, it has been outlined here. Our purpose has been not so much to outline the solution of Couette flow by means of this technique, but rather to present the technique as a precursor to our later discussions on Navier-Stokes solutions.

(b) Transient flow

Illustration of the finite-difference grid, and characteristics of the flow during its transient approach to the steady state.

Governing Equations for Quasi-One­Dimensional Flow

Recall the one-dimensional flow treated in Chapter 8. There, we considered the flow – field variables to be a function of a only, that is, p = p(x), и = u(x), etc. Strictly speaking, a streamtube for such a flow must be of constant area; that is, the one­dimensional flow discussed in Chapter 8 is constant-area flow, as sketched in Fig­ure 10.4a.

In contrast, assume that the area of the streamtube changes as a function of x, that is, A = A(x), as sketched in Figure 10.4b. Strictly speaking, this flow is three­dimensional; the flow-field variables are functions of x, y, and z, as can be seen simply by examining Figure 10.4b. In particular, the velocity at the boundary of the streamtube must be tangent to the boundary, and hence it has components in the у and z directions as well as the axial x direction. Flowever, if the area variation is moderate, the components in the у and z directions are small in comparison with the component in the x direction. In such a case, the flow-field variables can be assumed to vary with x only (i. e., the flow can be assumed to be uniform across any cross section at a given x station). Such a flow, where A = A (x), but p = p(x), p = p(x), и = u(x), etc., is defined as quasi-one-dimensionalflow, as sketched in Figure 10.4b. Such flow is the subject of this chapter. We have encountered quasi-one-dimensional flow earlier, in our discussion of incompressible flow through a duct in Section 3.3. Return to Section 3.3, and review the concepts presented there before progressing further.

Although the assumption of quasi-one-dimensional flow is an approximation to the actual flow in a variable-area duct, the integral forms of the conservation equations, namely, continuity [Equation (2.48)], momentum [Equation (2.64)], and energy [Equation (2.95)], can be used to obtain governing equations for quasi-one­dimensional flow which are physically consistent, as follows. Consider the control volume given in Figure 10.5. At station 1, the flow across area A i is assumed to be uniform with properties p, p, и , etc. Similarly, at station 2, the flow across area An

is assumed to be uniform with properties p2, p2, u2, etc. The application of the integral form of the continuity equation was made to such a variable-area control volume in Section 3.3. The resulting continuity equation for steady, quasi-one-dimensional flow was obtained as Equation (3.21), which in terms of the nomenclature in Figure 10.5 yields

Consider the integral form of the momentum equation, Equation (2.64). For a steady, inviscid flow with no body forces, this equation becomes

Since Equation (10.2) is a vector equation, let us examine its jc component, given below:

(pV • dS)n = -0> (pdS)

where (pdS)x denotes the x component of the pressure force. Since Equation (10.3) is a scalar equation, we must be careful about the sign of the x components when evaluating the surface integrals. All components pointing to the right in Figure 10.5 are positive, and those pointing to the left are negative. The upper and lower surfaces of the control volume in Figure 10.5 are streamlines; hence, V • dS = 0 along these surfaces. Also, recall that across A , V and dS are in opposite directions; hence, V • dS is negative. Therefore, the integral on the left of Equation (10.3) becomes ~Pi 4] А і + p2uA2. The pressure integral on the right of Equation (10.2), evaluated over the faces A) and A2 of the control volume, becomes — (—pj At + p2A2). (The negative sign in front of p, A is because dS over A! points to the left, which is the

©

negative direction for the x components.) Evaluated over the upper and lower surface of the control volume, the pressure integral can be expressed as

[10.4]

where dA is simply the x component of the vector dS, that is, the area dS projected on a plane perpendicular to the x axis. The negative sign inside the integral on the left of Equation (10.4) is due to the direction of dS along the upper and lower surfaces; note that dS points in the backward direction along these surfaces, as shown in Figure

10.5. Hence, the x component of p dS is to the left, and therefore appears in our equations as a negative component. [Recall from Section 2.5 that the negative sign outside the pressure integral, that is, outside the integral on the left of Equation (10.4), is always present to account for the physical fact that the pressure force p dS exerted on a control surface always acts in the opposite direction of dS. If you are unsure about this, review the derivation of the momentum equation in Section 2.5. Also, do not let the signs in the above results confuse you; they are all quite logical if you keep track of the direction of the x components.] With the above results, Equation (10.3) becomes

[10.5]

Equation (10.5) is the momentum equation for steady, quasi-one-dimensional flow.

Consider the energy equation given by Equation (2.95). For inviscid, adiabatic, steady flow with no body forces, this equation becomes

[10.6]

Applied to the control volume in Figure 10.5, Equation (10.6) yields

or

[10.7]

Dividing Equation (10.7) by Equation (10.1), we have

[10.8]

Recall that h = e + pv = e + р/р. Hence, Equation (10.8) becomes

©

volume at station 1, where the area is A, has properties p, u, and p. In traversing the length dx, where the area changes by dA, the flow properties change by the corresponding amounts dp, dp, and du. Hence, the flow leaving at station 2 has the properties p + dp, u+du, and p + dp, as shown in Figure 10.6. For this case, Equa­tion (10.5) becomes [recognizing that the integral in Equation (10.5) can be replaced by its integrand for the differential volume in Figure 10.6]

pA + pu2A + p dA = (p + dp)(A + dA) + (p + dp)(u + du)2(A + dA) [10.l 5]

In Equation (10.15), all products of differentials, such as dp dA, dp(du)2, are very small and can be ignored. Hence, Equation (10.15) becomes

A dp + Au2 dp + pu2 dA + 2puA du = 0 [10.16]

Expanding the continuity equation, Equation (10.14), and multiplying by u, we have

pu2 dA + puAdu + Au2 dp = 0 [10.17]

Subtracting Equation (10.17) from (10.16), we obtain

[10.18]

which is the differential form of the momentum equation for steady, inviscid, quasi- one-dimensional flow. Equation (10.18) is called Euler’s equation. We have seen it before—as Equation (3.12). In Section 3.2, it was derived from the differential form of the general momentum equation in three dimensions. (Make certain to review that derivation before progressing further.) In Section 3.2, we demonstrated that Equation

(3.12) holds along a streamline in a general three-dimensional flow. Now we see Euler’s equation again, in Equation (10.18), which was derived from the governing equations for quasi-one-dimensional flow.

A differential form of the energy equation follows directly from Equation (10.9), which states that

Differentiating this equation, we have

[10.19]

In summary, Equations (10.14), (10.18), and (10.19) are differential forms of the continuity, momentum, and energy equations, respectively, for a steady, inviscid, adiabatic, quasi-one-dimensional flow. We have obtained them from the algebraic forms of the equations derived earlier, applied essentially to the picture shown in Figure 10.6. Now you might ask the question, Since we spent some effort obtaining partial differential equations for continuity, momentum, and energy in Chapter 2, applicable to a general three-dimensional flow, why would we not simply set d/dy = 0 and 9/3z = 0 in those equations and obtain differential equations applicable to the one-dimensional flow treated in the present chapter? The answer is that we certainly could perform such a reduction, and we would obtain Equations (10.18) and (10.19) directly. [Return to the differential equations, Equations (2.113a) and (2.114), and prove this to yourself.] However, if we take the general continuity equation, Equation

(2.52) , and reduce it to one-dimensional flow, we obtain d(pu) = 0. Comparing this result with Equation (10.14) for quasi-one-dimensional flow, we see an inconsistency. This is another example of the physical inconsistency between the assumption of quasi-one-dimensional flow in a variable-area duct and the three-dimensional flow which actually occurs in such a duct. The result obtained from Equation (2.52), namely, d(pu) = 0, is a truly one-dimensional result, which applies to constant – area flows such as considered in Chapter 8. [Recall in Chapter 8 that the continuity equation was used in the form pu = constant, which is compatible with Equation

(2.52) .] However, once we make the quasi-one-dimensional assumption, that is, that uniform properties hold across a given cross section in a variable-area duct, then Equation (10.14) is the only differential form of the continuity equation which insures mass conservation for such an assumed flow.

Let us now use the differential forms of the governing equations, obtained above, to study some physical characteristics of quasi-one-dimensional flow. Such physical information can be obtained from a particular combination of these equations, as follows. From Equation (10.14),

[10.30]

We wish to obtain an equation which relates the change in velocity du to the change in area dA. Hence, to eliminate dp/p in Equation (10.20), consider Equation (10.18) written as

dp dp dp

p dp p

Keep in mind that we are dealing with inviscid, adiabatic flow. Moreover, for the time being, we are assuming no shock waves in the flow. Hence, the flow is isentropic. In particular, any change in density dp with respect to a change in pressure dp takes place isentropically; that is,

Substituting Equation (10.24) into (10.20), we have

Equation (10.25) is the desired equation which relates dA to du; it is called the area-velocity relation.

Equation (10.25) is very important; study it closely. In the process, recall the standard convention for differentials; for example, a positive value of du connotes an increase in velocity, a negative value of du connotes a decrease in velocity, etc. With this in mind, Equation (10.25) tells us the following information:

1. For 0 < M < 1 (subsonic flow), the quantity in parentheses in Equation (10.25) is negative. Hence, an increase in velocity (positive du) is associated with a decrease in area (negative dA). Likewise, a decrease in velocity (negative du) is associated with an increase in area (positive dA). Clearly, for a subsonic compressible flow, to increase the velocity, we must have a convergent duct, and to decrease the velocity, we must have a divergent duct. These results are illustrated at the top of Figure 10.7. Also, these results are similar to the familiar trends for incompressible flow studied in Section 3.3. Once again we see that subsonic compressible flow is qualitatively (but not quantitatively) similar to incompressible flow.

2. For M > 1 (supersonic flow), the quantity in parentheses in Equation (10.25) is positive. Hence, an increase in velocity (positive du) is associated with an increase in area (positive dA). Likewise, a decrease in velocity (negative du) is associated with a decrease in area (negative dA). For a supersonic flow, to

Figure 10*7 Compressible flow in converging and diverging ducts.

increase the velocity, we must have a divergent duct, and to decrease the velocity, we must have a convergent duct. These results are illustrated at the bottom of Figure 10.7; they are the direct opposite of the trends for subsonic flow.

3. ForM = 1 (sonic flow), Equation (10.25) shows thatrM = 0 even though a finite du exists. Mathematically, this corresponds to a local maximum or minimum in the area distribution. Physically, it corresponds to a minimum area, as discussed below.

Imagine that we want to take a gas at rest and isentropically expand it to supersonic speeds. The above results show that we must first accelerate the gas subsonically in a convergent duct. However, as soon as sonic conditions are achieved, we must further expand the gas to supersonic speeds by diverging the duct. Hence, a nozzle designed to achieve supersonic flow at its exit is a convergent-divergent duct, as sketched at the top of Figure 10.8. The minimum area of the duct is called the throat. Whenever an isentropic flow expands from subsonic to supersonic speeds, the flow must pass through a throat; moreover, in such a case, M = 1 at the throat. The converse is also true; if we wish to take a supersonic flow and slow it down isentropically to subsonic speeds, we must first decelerate the gas in a convergent duct, and then as soon as sonic flow is obtained, we must further decelerate it to subsonic speeds in a divergent duct. Here, the convergent-divergent duct at the bottom of Figure 10.8 is operating as a diffuser. Note that whenever an isentropic flow is slowed from supersonic to subsonic speeds, the flow must pass through a throat; moreover, in such a case, M = 1 at the throat.

As a final note on Equation (10.25), consider the case when M = 0. Then we have dA/A — —du/u. which integrates to Au = constant. This is the familiar continuity equation for incompressible flow in ducts as derived in Section 3.3 and as given by Equation (3.22).

Accuracy Considerations

How accurate is newtonian theory in the prediction of pressure distributions over hy­personic bodies? The comparison shown in Figure 14.9 indicates that Equation (14.7) leads to a reasonably accurate pressure distribution over the surface of a blunt body. Indeed, for “back-of-the-envelope” estimates of the pressure distributions over blunt bodies at hypersonic speeds, modified newtonian is quite satisfactory. However, what about relatively thin bodies at small angles of attack? We can provide an answer by using the newtonian flat-plate relations derived in the present section, and compare these results with exact shock-expansion theory (Section 9.7), for flat plates at small angles of attack. This is the purpose of the following worked example.

Consider an infinitely thin flat plate at an angle of attack of 15° in a Mach 8 flow. Calculate | Example 1 4.1 the pressure coefficients on the top and bottom surface, the lift and drag coefficients, and the lift-to-drag ratio using (a) exact shock-expansion theory, and (b) newtonian theory. Compare the results.

Solution

(a) Using the diagram in Figure 9.26 showing a flat plate at angle of attack, and following the shock-expansion technique given in Example 9.8, we have for the upper surface, for A?, =8 and V{ = 95.62°,

v2 = V, +0 = 95.62 + 15 = 110.62° From Appendix C, interpolating between entries,

M2 = 14.32

From Appendix A, for M = 8, poJp = 0.9763 x 10⁴, and for M2 = 14.32, po-,/p2 = 0.4808 x 10⁶. Since p0l = /+,,

The pressure coefficient is given by Equation (11.22), and the freestream static pressure in Figure 9.26 is denoted by p. Hence

To obtain the pressure coefficient on the bottom surface from the oblique shock theory, we have from the в-fi-M for Mt = 8 and в = 15°, /і = 21°:

Af„,i = M sin p = 8 sin 21° = 2.87

Interpolating from Appendix B, for Mn = 2.87, p3/pt = 9.443. Hence the pressure coeffi­cient on the bottom surface is

The lift coefficient can be obtained from the pressure coefficients via Equations (1.15), (1.16), and (1.18).

c„ = – f (СрЛ – Єр,,,) dx = Cm – CP2 = 0.1885 – (-0.0219) = 0.2104

c Jo

The axial force on the plate is zero, because the pressure acts only perpendicular to the plate. On a formal basis, dy/dx in Equation (1.16) is zero for a flat plate. Hence, from Equation (1.18),

C„, = 2 sin2 a = 2 sin2 15° =

From Equation (14.9), we have for the upper surface

r —

^ pi

Discussion. From the above worked example, we see that newtonian theory underpredicts the pressure coefficient on the bottom surface by 29 percent, and of course predicts a value of zero for the pressure coefficient on the upper surface in comparison to —0.0219 from exact theory—an error of 100 percent. Also, newtonian theory underpredicts q and c, j by 36.6 percent. However, the value of L/D from newtonian theory is exactly correct. This is no surprise, for two reasons. First, the

newtonian values of ct and q are both underpredicted by the same amount, hence their ratio is not affected. Second, the value of L/D for supersonic or hypersonic inviscid flow over a flat plate, no matter what theory is used to obtain the pressures on the top and bottom surfaces, is simply a matter of geometry. Because the pressure acts normal to the surface, the resultant aerodynamic force is perpendicular to the plate (i. e., the resultant force is the normal force N). Examining Figure 1.10, when this is the case, the vectors R and N are the same vectors, and L/D is geometrically given by

L

— = cot a

D

For the above worked example, where a = 15°, we have

L

— = cot 15° = 3.73 D

which agrees with the above calculations where q and c, i were first obtained, and L/D is found from the ratio, L/D = cy/cj. So, Equation (14.16), derived in our discussion of newtonian theory applied to a flat plate, is not unique to newtonian theory; it is a general result when the resultant aerodynamic force is perpendicular to the plate.

We induce from Example 14.1 the general fact that the newtonian sine-squared law, Equation (14.4), does not accurately predict the hypersonic pressure distribution on the surface of two-dimensional bodies with local tangent lines that are at small or moderate angles to the flow, such as the bi-convex airfoil shape shown in Figure 12.3. On the other hand, it generally turns out that the newtonian prediction of the lift-to-drag ratio for slender shapes at small to moderate angles of attack is reasonably accurate. These statements apply to a gas with the ratio of specific heats substantially greater than one, such as the case of air with у = 1.4 treated in Example 14.1. In the next section, we will see that newtonian theory becomes more accurate as Mx —» со and у —>■ 1. For more information on the accuracy of newtonian theory applied to two-dimensional slender shapes, see Reference 77 which is a study of this specific matter.

Finally, we note that newtonian theory does a better job of predicting the pressure on axisymmetric slender bodies, such as the 15° half-angle cone shown in Figure 14.13.

Compressible Flow over a Flat Plate

The properties of the incompressible, laminar, flat-plate boundary layer were devel­oped in Section 18.2. These results hold at low Mach numbers where the density is essentially constant through the boundary layer. However, what happens to these properties at high Mach numbers where the density becomes a variable; that is, what are the compressibility effects? The purpose of the present section is to outline briefly the effects of compressibility on both the derivations and the final results for laminar flow over a flat plate. We do not intend to present much detail; rather, we exam­ine some of the salient aspects which distinguish compressible from incompressible boundary layers.

The compressible boundary-layer equations were derived in Section 17.3, and were presented as Equations (17.28) to (17.31). For flow over a flat plate, where dpeldx = 0, these equations become

Compare these equations with those for the incompressible case given by Equations (18.1) to (18.3). Note that, for a compressible boundary layer, (1) the energy equation must be included, (2) the density is treated as a variable, and (3) in general, p and к are functions of temperature and hence also must be treated as variables. As a result, the system of equations for the compressible case, Equations (18.31) to (18.34), is more complex than for the incompressible case, Equations (18.1) to (18.3).

It is sometimes convenient to deal with total enthalpy, ho = h + V2/2, as the dependent variable in the energy equation, rather than the static enthalpy as given in Equation (18.34). Note that, consistent with the boundary-layer approximation, where v is small, ho — h + V2/2 = h + (n + v2)/2 ~ h + и2/2. To obtain the energy equation in terms of ho, multiply Equation (18.32) by u, and add to Equation (18.34), as follows. From Equation (18.32) multiplied by u,

Adding Equation (18.35) to (18.34), we obtain

Recall that for a calorically perfect gas, dh = cpdT hence,

Substituting Equations (18.39) and (18.40) into (18.38), we obtain

dh0 dh0 d /X dh0

pu——- h pv—- = —————–

dx dy dy Pr dy

which is an alternate form of the boundary-layer energy equation. In this equation, Pr is the local Prandtl number, which, in general, is a function of T and hence varies throughout the boundary layer.

For the laminar, compressible flow over a flat plate, the system of governing equations can now be considered to be Equations (18.31) to (18.33) and (18.41). These are nonlinear partial differential equations. As in the incompressible case, let us seek a self-similar solution; however, the transformed independent variables must be defined differently.

£ — PeP^e^eX

The dependent variables are transformed as follows:

и._

/ = — (which is consistent with defining stream function = v2|/)

ue

_ hp
8 ~ iho)e

The mechanics of the transformation using the chain rule are similar to that described in Section 18.2. Hence, without detailing the precise steps (which are left for your

solution to Equations (18.42) and (18.43) is the shooting technique described in Section 16.4. The approach here is directly analogous to that used for the solution of compressible Couette flow discussed in Section 16.4. Since Equation (18.42) is third order, we need three boundary conditions at r] = 0. We have only two, namely, / = /’ = 0. Therefore, assume a value for /"(0), and iterate until the boundary condition at the boundary-layer edge, /’ = 1, is matched. Similarly, Equation (18.43) is a second-order equation. It requires two boundary conditions at the wall in order to integrate numerically across the boundary layer; we have only one, namely, g(0) = gw. Thus, assume g'(0), and integrate Equation (18.43). Iterate until the outer boundary condition is satisfied; that is, g = 1. Since Equation (18.42) is coupled to Equation (18.43), that is, since pji in Equation (18.42) requires a knowledge of the enthalpy (or temperature) profile across the boundary layer, the entire process must be repeated again. This is directly analogous to the two minor iterations nested within the major iteration that was described in the discussion of the shooting method in Section 16.4. The approach here is virtually the same philosophy as described in Section 16.4, which should be reviewed at this stage. Therefore, no further details will be given here.

Typical solutions of Equations (18.42) and (18.43) for the velocity and temper­ature profiles through a compressible boundary layer on a flat plate are shown in Figures 18.4-18.7, obtained from van Driest (Reference 79). Figures 18.4 and 18.5 contain results for an insulated flat plate (zero-heat transfer) using Sutherland’s law for [jl, and assuming a constant Pr = 0.75. The velocity profiles are shown in Fig­ure 18.4 for different Mach numbers ranging from 0 (incompressible flow) to the large hypersonic value of 20. Note that at a given x station at a given Re*, the boundary – layer thickness increases markedly as Me is increased to hypersonic values. This clearly demonstrates one of the most important aspects of compressible boundary layers, namely, that the boundary-layer thickness becomes large at large Mach num­bers. Figure 18.5 illustrates the temperature profiles for the same case as Figure 18.4. Note the obvious physical trend that, as Me increases to large hypersonic values, the temperatures increase markedly. Also note in Figure 18.5 that at the wall (у = 0), (ЗT/3y)w = 0, as it should be for an insulated surface (qw = 0). Figures 18.6 and 18.7 also contain results by van Driest, but now for the case of heat transfer to the wall. Such a case is called a “cold wall” case, because Tw < Taw. (The opposite case would be a “hot wall,” where heat is transferred from the wall into the flow; in this case, Tw > Taw.) For the results shown in Figures 18.6 and 18.7, Tw/Te = 0.25 and Pr = 0.75 = constant. Figure 18.6 shows velocity profiles for various different values of Me, again demonstrating the rapid growth in boundary layer thickness with increasing Me. In addition, the effect of a cold wall on the boundary layer thickness can be seen by comparing Figures 18.4 and 18.6. For example, consider the case of Me = 20 in both figures. For the insulated wall at Mach 20 (Figure 18.4), the bound­ary layer thickness reaches out beyond a value of (y/x)^Rex = 60, whereas for the cold wall at Mach 20 (Figure 18.6), the boundary-layer thickness is slightly above (y/x)«/Re^ = 30. This illustrates the general fact that the effect of a cold wall is to reduce the boundary-layer thickness. This trend is easily explainable on a physical basis when we examine Figure 18.7, which illustrates the temperature profiles through

0 0.2 0.4 0.6 0.8 1.0

«/«

Figure 1 8.4 Velocity profiles in a compressible laminar boundary layer over an insulated flat plate (Source: van Driest, Reference 79.)

the boundary layer for the cold-wall case. Comparing Figures 18.5 and 18.7, we note that, as expected, the temperature levels in the cold-wall case are considerably lower than in the insulated case. In turn, because the pressure is the same in both cases, we have from the equation of state p = pRT, that the density in the cold-wall case is

T/Te

Figure 18.5 Temperature profiles in a compressible laminar boundary layer over an insulated flat plate. (Source: van Driest Reference 79.)

much higher. If the density is higher, the mass flow within the boundary layer can be accommodated within a smaller boundary-layer thickness; hence, the effect of a cold wall is to thin the boundary layer. Also note in Figure 18.7 that, starting at the outer edge of the boundary layer and going toward the wall, the temperature first increases, reaches a peak somewhere within the boundary layer, and then decreases to its pre­scribed cold-wall value of Tw. The peak temperature inside the boundary layer is an indication of the amount of viscous dissipation occurring within the boundary layer. Figure 18.7 clearly demonstrates the rapidly growing effect of this viscous dissipation as Me increases—yet another basic aspect of compressible boundary layers.

Carefully study the boundary-layer profiles shown in Figures 18.4-18.7. They are an example of the detailed results which emerge from a solution of Equations (18.42) and (18.43); indeed, these figures are graphical representations of Equations (18.43) and (18.42), with the results cast in the physical (x, y) space (rather than in terms of the transformed variable r). In turn, the surface values Cf and Сц can be obtained from the velocity and temperature gradients respectively at the wall as given by the velocity and temperature profiles evaluated at the wall. Recall from Equations (16.51) and (16.55) that Cf and Сц are defined as

rw

PeU2e

and where (3u/dy)w and (dT/dy)w are the values obtained from the velocity and temperature profiles, respectively, evaluated at the wall. In turn, the overall flat plate skin friction drag coefficient C/ can be obtained by integrating c/ over the plate via Equation (18.21).

Return to Equation (18.22) for the friction drag coefficient for incompressible flow. The analogous compressible result can be written as

In Equation (18.44), the function F is determined from the numerical solution. Sam­ple results are given in Figure 18.8, which shows that the product C/VRec decreases as Me increases. Moreover, the adiabatic wall is warmer than the wall in the case of Tw/Te = 1.0. Hence, Figure 18.8 demonstrates that a hot wall also reduces C/ VRec.

Return to Equation (18.23) for the thickness of the incompressible flat-plate boundary layer. The analogous result for compressible flow is

In Equation (18.45), the function G is obtained from the numerical solution. Sample results are given in Figure 18.9, which shows that the product (&^/ШГх/х) increases as Me increases. Everything else being equal, boundary layers are thicker at higher

Figure 1 8.8 Friction drag coefficient for laminar, compressible flow over a flat plate, illustrating the effect of Mach number and wall temperature. Pr = 0.75.

(Calculations by E. R. van Driest, N АСА Tech. Note 2597.)

Figure 1 8-9 Boundary-layer thickness for laminar, compressible flow over a flat plate, illustrating the effect of Mach number and wall temperature. Pr = 0.75.

(Calculations by E. R. van Driest, NАСА Tech. Note 2597.)

Mach numbers. This fact was stated earlier, as shown in Figures 18.4 and 18.6. Note also from Figure 18.9 that a hot wall thickens the boundary layer, as discussed earlier.

Recall our discussion of Couette flow in Chapter 16. There, we introduced the concept of the recovery factor r where

haw=he + r-^ [18.46]

This is a general concept, and can be applied to the boundary-layer solutions here. If we assume a constant Prandtl number for the compressible flat-plate flow, the numerical solution shows that

r = VPr

for the flat plate. Note that Equation (18.47) is analogous to the result given for Couette flow in that the recovery factor is a function of the Prandtl number only. However, for the flat plate, r = л/Рг, whereas for Couette flow, r = Pr.

Aerodynamic heating for the flat plate can be treated via Reynolds analogy. The Stanton number and skin friction coefficients are defined respectively as

(See our discussion of these coefficients in Chapter 16.) Our results for Couette flow proved that a relation existed between C# and c/—namely, Reynolds analogy, given by Equation (16.59) for Couette flow. Moreover, in this relation, the ratio Сн/cf was a function of the Prandtl number only. A directly analogous result holds for the compressible flat-plate flow. If we assume that the Prandtl number is constant, then for a flat plate, Reynolds analogy is, from the numerical solution,

In Equation (18.50), the local skin friction coefficient Cf which is given by Equa­tion (18.20) for the incompressible flat-plate case, becomes the following form for the compressible flat-plate flow:

In Equation (18.51), F is the same function as appears in Equation (18.44), and its variation with Me and Tw/Te is the same as shown in Figure 18.8.

The speed of sound is

«oo = yJyRTx = л/(1-4)(287)(288) = 340.2 m/s

The Mach number is Mx = 100/340.2 = 0.29. Hence, Mx is low enough to assume incompressible flow, and we can use Equation (18.22),

1.328

v’ReZ

Please note that for the flow over a flat plate at zero angle of attack, the freestream velocity and density, Vx and p0c, are the same as the velocity and density at the outer edge of the boundary layer, ue and pe. Hence, these quantities can be used interchangeably. Thus,

The total drag due to friction is generated by the shear stress acting on both the top and bottom of the plate. Since D f above is the friction drag on only one surface, we have

Total friction drag = D = 2D/ = 2(87.8) = (b) For Poo = 1000 m/s, we have

Clearly, the flow is compressible, and we have to use Equation (18.44), or more directly, Figure 18.8. From Figure 18.8, we have for Mx = Me = 2.94 and an adiabatic wall,

С/л/ReZ = 1.2

The friction drag on one surface is

Df = {pooVlSCf = і(1.22)(1 ООО)2(40)(1.03 x IQ-4) = 2513 N

Taking into account both the top and bottom surfaces,

Total friction drag = D = 2Df = 2(2513) =

Drag-Divergence Mach Number: The Sound Barrier

Imagine that we have a given airfoil at a fixed angle of attack in a wind tunnel, and we wish to measure its drag coefficient cd as a function of Mx. To begin with, we measure the drag coefficient at low subsonic speed to be cd 0, shown in Figure

11.11. Now, as we gradually increase the freestream Mach number, we observe that

cd remains relatively constant all the way to the critical Mach number, as illustrated in Figure 11.11. The flow fields associated with points a, b, and c in Figure 11.11 are represented by Figure 11.5a, b, and r, respectively. Asweverycarefullyincrea. se slightly above Mcr, say, to point d in Figure 11.11, a finite region of supersonic flow appears on the airfoil, as shown in Figure 11.5cf. The Mach number in this bubble of supersonic flow is only slightly above Mach 1, typically 1.02 to 1.05. Flowever, as we continue to nudge M00 higher, we encounter a point where the drag coefficient suddenly starts to increase. This is given as point e in Figure 11.11. The value of Мж at which this sudden increase in drag starts is defined as the drag-divergence Mach number. Beyond the drag-divergence Mach number, the drag coefficient can become very large, typically increasing by a factor of 10 or more. This large increase in drag is associated with an extensive region of supersonic flow over the airfoil, terminating in a shock wave, as sketched in the insert in Figure 11.11. Corresponding to point / on the drag curve, this insert shows that as Мж approaches unity, the flow on both the top and bottom surfaces can be supersonic, both terminated by shock waves. For example, consider the case of a reasonably thick airfoil, designed originally for low – speed applications, when Мж is beyond drag-divergence; in such a case, the local Mach number can reach 1.2 or higher. As a result, the terminating shock waves can be relatively strong. These shocks generally cause severe flow separation downstream of the shocks, with an attendant large increase in drag.

Now, put yourself in the place of an aeronautical engineer in 1936. You are familiar with the Prandtl-Glauert rule, given by Equation (11.51). You recognize that as Mх —>• 1, this equation shows the absolute magnitude of Cp approaching

Figure I I.1 I Sketch of the variation of profile drag coefficient with freestream Mach number, illustrating the critical and drag-divergence Mach numbers and showing the large drag rise near Mach 1.

infinity. This hints at some real problems near Mach 1. Furthermore, you know of some initial high-speed subsonic wind-tunnel tests that have generated drag curves which resemble the portion of Figure 11.11 from points a to /. How far will the drag coefficient increase as we get closer to MTO = 1? Will q go to infinity? At this stage, you might be pessimistic. You might visualize the drag increase to be so large that no airplane with the power plants existing in 1936, or even envisaged for the future, could ever overcome this “barrier.” It was this type of thought that led to the popular concept of a sound barrier and that prompted many people to claim that humans would never fly faster than the speed of sound.

Of course, today we know the sound barrier was a myth. We cannot use the Prandtl-Glauert rule to argue that q will become infinite at MTO = 1, because the Prandtl-Glauert rule is invalid at MTO = 1 (see Sections 11.3 and 11.4). Moreover, early transonic wind-tunnel tests carried out in the late 1940s clearly indicated that cj peaks at or around Mach 1 and then actually decreases as we enter the supersonic regime, as shown by points g and h in Figure 11.11. All we need is an aircraft with an engine powerful enough to overcome the large drag rise at Mach 1. The myth of the sound barrier was finally put to rest on October 14, 1947, when Captain Charles (Chuck) Yeager became the first human being to fly faster than sound in the sleek, bullet-shaped Bell XS-1. This rocket-propelled research aircraft is shown in Figure 11.12. Of course, today supersonic flight is a common reality; we have

Figure 11.12 The Bell XS-1 —the first manned airplane to fly faster than sound, October 14, 1947. (Courtesy of the National Air and Space Museum.)

(a)

Figure 11.14 By sweeping the wing, a streamline effectively sees a thinner airfoil.

Figure 11.15 A typical example of a swept-wing aircraft. The North American F-86 Sabre of Korean War fame.

sound. One of these—the area rule—is discussed in this section; the other—the supercritical airfoil—is the subject of Section 11.9.

For a moment, let us expand our discussion from two-dimensional airfoils to a consideration of a complete airplane. In this section, we introduce a design concept which has effectively reduced the drag rise near Mach 1 for a complete airplane.

As stated before, the first practical jet-powered aircraft appeared at the end of World War II in the form of the German Me 262. This was a subsonic fighter plane with a top speed near 550 mi/h. The next decade saw the design and production of many types of jet aircraft—all limited to subsonic flight by the large drag near Mach 1. Even the “century” series of fighter aircraft designed to give the U. S. Air Force supersonic capability in the early 1950s, such as the Convair F-102 delta-wing airplane, ran into difficulty and could not at first readily penetrate the sound barrier in level flight. The thrust of jet engines at that time simply could not overcome the large peak drag near Mach 1.

A planview, cross section, and area distribution (cross-sectional area versus dis­tance along the axis of the airplane) for a typical airplane of that decade are sketched in Figure 11.16. Let A denote the total cross-sectional area at any given station. Note that the cross-sectional area distribution experiences some abrupt changes along the axis, with discontinuities in both A and dA/dx in the regions of the wing.

In contrast, for almost a century, it was well known by ballisticians that the speed of a supersonic bullet or artillery shell with a smooth variation of cross-sectional area

Figure 11.16 A schematic of a non-area-ruled aircraft.

was higher than projectiles with abrupt or discontinuous area distributions. In the mid-1950s, an aeronautical engineer at the NACA Langley Aeronautical Laboratory, Richard T. Whitcomb, put this knowledge to work on the problem of transonic flight of airplanes. Whitcomb reasoned that the variation of cross-sectional area for an airplane should be smooth, with no discontinuities. This meant that, in the region of the wings and tail, the fuselage cross-sectional area should decrease to compensate for the addition of the wing and tail cross-sectional area. This led to a “coke bottle” fuselage shape, as shown in Figure 11.17. Here, the planview and area distribution are shown for an aircraft with a relatively smooth variation of A(x). This design philosophy is called the area rule, and it successfully reduced the peak drag near Mach 1 such that practical airplanes could fly supersonically by the mid-1950s. The variations of drag coefficient with for an area-ruled and non-area-ruled airplane are schematically compared in Figure 11.18; typically, the area rule leads to a factor – of-2 reduction in the peak drag near Mach 1.

The development of the area rule was a dramatic breakthrough in high-speed flight, and it earned a substantial reputation for Richard Whitcomb—a reputation which was to be later garnished by a similar breakthrough in transonic airfoil design, to be discussed in Section 11.9. The original work on the area rule was presented by Whitcomb in Reference 31, which should be consulted for more details.

Figure 11.17 A schematic of an area-ruled aircraft.

Figure 11.18 The drag-rise properties of

area-ruled and non-area-ruled aircraft (schematic only).

Some Special Cases; Couette and. Poiseuille Flows

The resistance arising from the want of lubricity in the parts of a fluid is, other things being equal, proportional to the velocity with which the parts of the fluid are separated from one another.

Isaac Newton, 1687, from Section IX of Book II of his Principia

16.1 Introduction

The general equations of viscous flow were derived and discussed in Chapter 15. In particular, the viscous flow momentum equations were treated in Section 15.4 and are given in partial differential equation form by Equations (15.19a to c)—the Navier-Stokes equations. These, along with the viscous flow energy equation, Equa­tion (15.26), derived in Section 15.5, are the theoretical tools for the study of viscous flows. However, examine these equations closely; as discussed in Section 15.7, they are a system of coupled, nonlinear partial differential equations—equations which contain more terms and which are inherently more elaborate than the inviscid flow equations treated in Parts 2 and 3 of this book. Three classes of solutions of these equations were itemized in Section 15.5. The first itemized class was that of “exact” solutions of the Navier-Stokes equations for a few specific physical problems which, by their physical and geometrical nature, allow many terms in the governing equations to be precisely zero, resulting in a system of equations simple enough to solve, either analytically or by simple numerical methods. Such exact problems are the subject of this chapter.

Reynolds analogy

The road map for this chapter is given in Figure 16.1. The types of flows consid­ered here are generally labeled as parallel flows because the streamlines are straight and parallel to each other. We will consider two of these flows, Couette and Poiseuille, which will be defined in due course. In addition to representing exact solutions of the Navier-Stokes equations, these flows illustrate some of the important practical facets of any viscous flow, as itemized on the right side of the road map. In a clear, uncom­plicated fashion, we will be able to calculate and study the surface skin friction and heat transfer. We will also use the results to define the recovery factor and Reynolds analogy—two practical engineering tools that are frequently used in the analysis of skin friction and heat transfer.