Category AVIATORS

FRICTION EFFECTS

Because the air has viscosity, air will en­counter resistance to flow over a surface. The viscous nature of airflow reduces the local velocities on a surface and accounts for the drag of skin friction. The retardation of air particles due to viscosity is greatest immedi­ately adjacent to the surface. At the very sur­face of an object, the air particles are slowed to a relative velocity of near zero. Above this area other particles experience successively smaller retardation until finally, at some dis­tance above surface, the local velocity reaches the full value of the airstream above the sur­face. This layer of air over the surface which shows local retardation of airflow from vis­cosity is termed the “boundary layer.” The characteristics of this boundary layer are illus­trated in figure 1.24 with the flow of air over a smooth flat plate.

The beginning flow on a smooth surface gives evidence of a very thin boundary layer with the flow occurring in smooth laminations. The boundary layer flow near the leading edge is similar to layers or laminations of air slid­ing smoothly over one another and the obvi­ous term for this type of flow is the “laminar"

boundary layer. This smooth laminar flow exists without the air particles moving from a given elevation.

As the flow continues back from the leading edge, friction forces in the boundary layer continue to dissipate energy of the airstream and the laminar boundary layer increases in thickness with distance from the leading edge. After some distance back from the leading edge, the laminar boundary layer begins an oscillatory disturbance which is unstable. A waviness occurs in the laminar boundary layer which ultimately grows larger and more severe and destroys the smooth laminar flow. Thus, a transition takes place in which the laminar boundary layer decays into a “turbu­lent" boundary layer. The same sort of – transition can be noticed in the smoke from a cigarette in still air. At first, the smoke ribbon is smooth and laminar, then develops a definite waviness, and decays into a random turbulent smoke pattern.

As soon as the transition to. the turbulent boundary layer takes place, the boundary layer thickens and grows at a more rapid rate. (The small scale, turbulent flow within the boundary layer should not be confused with the large scale turbulence associated with airflow separation.) The flow in the turbu­lent boundary layer allows the air particles to travel from one layer to another producing an energy exchange. However, some small lami­nar flow continues to exist in the very lower levels of the turbulent boundary layer and is referred to as the “laminar sub-layer." The turbulence which exists in the turbulent bound­ary layer allows determination of the point of transition by several means. Since the turbu­lent boundary layer transfers heat more easily than the laminar layer, frost, water, and oil films will be removed more rapidly from the area aft of the transition point. Also, a small probe may be attached to a stethoscope and positioned at various points along a surface. When the probe is in the laminar area, a low “hiss” will be heard; when the probe is in

Подпись: TURBULENT BOUNDARY
DEVELOPMENT OF BOUNDARY LAYER
ON A SMOOTH FLAT PLATE

COMPARISON OF VELOCITY PROFILES
FOR LAMINAR AND TURBULENT BOUNDARY LAYERS

Подпись: u w TURBULENT

PROFILE

FRICTION EFFECTS

Подпись:

— LOW THICKNESS

— LOW VELOCITIES NEXT TO SURFACE

— GRADUAL VELOCITY CHANGE

— LOW SKIN FRICTION

— GREATER THICKNESS

— HIGHER VELOCITIES NEXT TO SURFACE

— SHARP VELOCITY CHANGE

— HIGHER SKIN FRICTION

the turbulent area, a sharp "crackling” will be audible.

In order to compare the characteristics of the laminar and turbulent boundary layers, the velocity profiles (the variation of boundary layer velocity with height above the surface) should be compared under conditions which could produce either laminar or turbulent flow. The typical laminar and turbulent pro­files are shown in figure 1.24. The velocity profile of the turbulent boundary layer shows a much sharper initial change of velocity but a greater height (or boundary layer thickness) required to reach the free stream velocity. As a result of these differences, a comparison will show:

(1) The turbulent boundary layer has a fuller velocity profile and has higher local velocities immediately adjacent to the sur­face. The turbulent boundary layer has higher kinetic energy in the airflow next to the surface.

(2) At the surface, the laminar boundary layer has the less rapid change of velocity with distance above the plate. Since the shearing stress is proportional to the velocity gradient, the lower velocity gradient of the laminar boundary layer is evidence of a lower friction drag on the surface. If the conditions of flow were such that either a turbulent or a laminar boundary layer could exist, the laminar skin friction would be about one-third that for turbulent flow.

The low friction drag of the laminar bound­ary layer makes it quite desirable. However, the transition tends to take place in a natural fashion and limit the extensive development of the laminar boundary layer.

REYNOLDS NUMBER. Whether a lam­inar or turbulent boundary layer exists depends on the combined effects of velocity, viscosity, distance from the leading edge, density, etc. The effect of the most important factors is combined in a dimensionless parameter called "Reynolds Number, RN." The Reynolds Number is a dimensionless ratio which por­trays the relative magnitude of dynamic and viscous forces in the flow.

where

RN= Reynolds Number, dimensionless

V— velocity, ft. per sec.

at= distance from leading edge, ft.

v = kinematic viscosity, sq. ft. per sec.

While the actual magnitude of the Reynolds Number has no physical significance, the quantity is used as an index to predict and correlate various phenomena of viscous fluid flow. When the RN is low, viscous or fric­tion forces predominate; when the RN is high, dynamic or inertia forces predominate. The effect of the variables in the equation for Reynolds Number should be understood. The RN varies directly with velocity and distance back from the leading edge and inversely with kinematic viscosity. High RN’s are obtained with large chord surfaces, high velocities, and low altitude; low RN’s result from small chord surfaces, low velocities, and high altitudes— high altitudes producing high values for kine­matic viscosity.

The most direct use of Reynolds Number is the indexing or correlating the skin friction drag of a surface. Figure 1.25 illustrates the variation of the friction drag of a smooth, flat plate with a Reynolds Number which is based on the length or chord of the plate. The graph shows separate lines of drag coeffi­cient if the flow should be entirely laminar or entirely turbulent. The two curves for lam­inar and turbulent friction drag illustrate the relative magnitude of friction drag coefficient if either type of boundary layer could exist. The drag coefficients for either laminar or tur­bulent flow decrease with increasing RN since the velocity gradient decreases as the boundary layer thickens.

FRICTION DRAG OF A SMOOTH
FLAT PLATE

FRICTION EFFECTS

CONVENTIONAL AND LAMINAR
FLOW SECTIONS

FRICTION EFFECTS

TRANSITION


FRICTION EFFECTSFRICTION EFFECTS

If the surface of the plate is smooth and the original airstream has no turbulence, the plate at low Reynolds Numbers will exist with pure laminar flow. When the RN is increased to approximately 530,000, transition occurs on the plate and the flow is partly turbulent. Once transition takes place, the drag coefficient of the plate increases from the laminar curve to the turbulent curve. As the RN approaches very high values (20 to 50 million) the drag curve of the plate approaches and nearly equals the values for the turbulent curve. At such high RN the boundary layer is predominantly turbulent with very little laminar flow—the transition point is very close to the leading edge. While the smooth, flat plate is not ex­actly representative of the typical airfoil, basic fluid friction phenomena are illustrated. At RN less than a half million the boundary layer will be entirely laminar unless there is extreme surface roughness or turbulence induced in the airstream. Reynolds Numbers between one and five million produce boundary layer flow which is partly laminar and partly turbulent. At RN above ten million the boundary layer characteristics are predominantly turbulent.

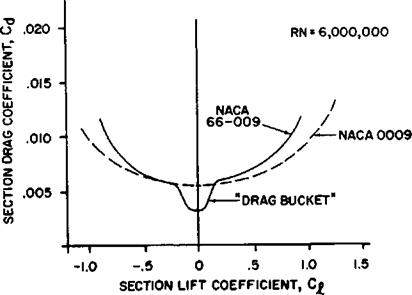
In order to obtain low drag sections, the transition from laminar to turbulent must be delayed so that a greater portion of the sur­face will be influenced by the laminar bound­ary layer. The conventional, low speed air­foil shapes are characterized by minimum pressure points very close to the leading edge. Since high local velocities enhance early transition, very little surface is covered by the laminar boundary layer. A comparison of two 9 percent thick symmetrical airfoils is presented in figure 1.25- One section is the “conventional” NACA 0009 section which has a minimum pressure point at approxi­mately 10 percent chord at zero lift. The other section is the NACA 66-009 which has a minimum pressure point at approximately 60 percent chord at zero lift. The lower local velocities at the leading edge and the favor­able pressure gradient of the NACA 664)09 delay the transition to some point farther aft on the chord. The subsequent reduction in friction drag at the low angles of attack ac­counts for the “drag bucket" shown on the graphs of ct and ct for these sections. Of course, the advantages of the laminar flow airfoil are apparent only for the smooth airfoil since surface roughness or waviness may pre­clude extensive development of a laminar boundary layer.

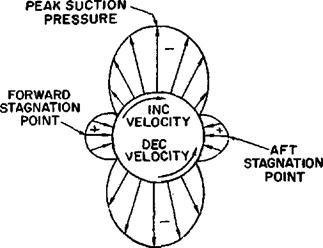
AIRFLOW SEPARATION. The character of the boundary layer on an aerodynamic surface is greatly influenced by the pressure gradient. In order to study this effect, the pressure distribution of a cylinder in a perfect fluid is repeated in figure 1.26. The airflows depict a local velocity of zero at the forward stagnation point and a maximum local velocity at the extreme surface. The airflow moves from the hieh oositive oressure to the minimum

л. J.

pressure point—a favorable pressure gradient (high to low). As the air moves from the extreme surface aft, the local velocity decreases to zero at the aft stagnation point. The static pressure increases from the minimum (or max­imum suction) to the high positive pressure at the aft stagnation point—an adverse pres­sure gradient (low to high).

The action of the pressure gradient is such that the favorable pressure gradient assists the boundary layer while the adverse pressure gradient impedes the flow of the boundary layer. The effect of an adverse pressure gradi­ent is illustrated by the segment X-Y of figure

1.26. A corollary of the skin friction drag is the continual reduction of boundary layer energy as flow continues aft on a surface. ‘ The velocity profiles of the boundary layer are shown on segment Х-У of figure 1.26. In the area of adverse pressure gradient the bound­ary layer flow is impeded and tends to show a reduction in velocity next to the surface. If the boundary layer does not have sufficient kinetic energy in the presence of the adverse pressure gradient, the lower levels of the boundary layer may stagnate prematurely.

SHOCK WAVE INDUCED
FLOW SEPARATION

NAVWEPS 00-80T-80 BASIC AERODYNAMICS

Premature stagnation of the boundary layer means that all subsequent airflow will overrun this point and the boundary layer will separate from the surface. Surface flow which is aft of the separation point will indicate a local flow direction forward toward the separation point— a flow reversal. If separation occurs the posi­tive pressures are not recovered and form drag results. The points of separation on any aero­dynamic surface may be noted by the reverse flow area. Tufts of cloth or string tacked to the surface will lie streamlined in an area of unseparated flow but will lie forward in an area behind the separation point.

The basic feature of airflow separation is stagnation of the lower levels of the boundary layer. Airflow separation results when the lower levels of the boundary layer do not have sufficient kinetic energy in the presence of an adverse pressure gradient. The most outstanding cases of air­flow separation are shown in figure 1.26. An airfoil at some high angle of attack creates a pressure gradient on the upper surface too severe to allow the boundary layer to adhere to the surface. When the airflow does not adhere to the surface near the leading edge the high suction pressures are lost and stall occurs. When the shock wave forms on the upper surface of a wing at high subsonic speeds, the increase of static pressure through the shock wave creates a very strong obstacle for the boundary layer. If the shock wave is sufficiently strong, separation will follow and “compressibility buffet’’ will result from the turbulent wake or separated flow.

In order to prevent separation of a boundary layer in the presence of an adverse pressure gradient, the boundary layer must have the highest possible kinetic energy. If a choice is available, the turbulent boundary layer would be preferable to the laminar boundary layer because the turbulent velocity profile shows higher local velocities next to the surface. The most effective high lift devices (slots, slotted flaps, BUT) utilize various techniques to increase the kinetic energy of the upper sur­face boundary layer to withstand the more severe pressure gradients common to the higher lift coefficients. Extreme surface roughness on full scale aircraft (due to surface damage, heavy frost, etc.) causes higher skin friction and greater energy loss in the boundary layer. The lower energy boundary layer may cause a noticeable change in CL ^ and stall speed. In the same sense, vortex generators applied to the surfaces of a high speed airplane may allay compressibility buffet to some degree. The function of the vortex generators is to create a strong vortex which introduces high velocity, high energy air next to the surface to reduce or delay the shock induced separation. These examples serve as a reminder that separation is the result of premature stagnation of the boundary layer—insufficient kinetic energy in the presence of an adverse pressure gradient.

SCALE EFFECT. Since the boundary layer friction and kinetic energy are dependent on the characteristics of the boundary layer, Reynolds Number is important in correlating aerodynamic characteristics. The variation of the aerodynamic characteristics with Reynolds Number is termed “scale effect” and is ex­tremely important in correlating wind tunnel test data of scale models with the actual flight characteristics of the full size aircraft. The two most important section characteristics affected by scale effects are drag and maximum lift—the effect on pitching moments usually being negligible. From the known variation of boundary layer characteristics with Rey­nolds Number, certain general effects may be anticipated. With increasing Reynolds Num­ber, it may be expected that the section maxi­mum lift coefficient will increase (from the higher energy turbulent boundary layer) and that the section drag coefficient will decrease (similar to that of the smooth plate). These effects are illustrated by the graphs of figure

1.27.

The characteristics depicted in figure 1.27 are for the NACA 4412 airfoil (4 percent

a0 , DEGREES C£

camber at 40 percent chord, 12 percent thick­ness at 30 percent chord)—a fairly typical “conventional" airfoil section. The lift curve show a steady increase in гг_м with increasing RN. However, note that a smaller change in Ci occurs between Reynolds Numbers of 6.0 and 9.0 million than occurs between 0.1 and

3.0 million. In other words, greater changes in ci occur in the range of Reynolds Num­bers where the laminar (low energy) boundary layer predominates. The drag curves for the section show essentially the same feature—the greatest variations occur at very low Reynolds Numbers. Typical full scale Reynolds Num­bers for aircraft in flight may be 3 to 500 million where the boundary layer is predominately turbulent. Scale model tests may involve Reynolds Numbers of 0.1 to 5 million where the boundary layer be predominately laminar. Hence, the “scale” corrections are very neces­sary to correlate the principal aerodynamic characteristics.

The very large changes in aerodynamic characteristics at low Reynolds Numbers are due in great part to the low energy laminar boundary layer typical of low Reynolds Num­bers. Low Reynolds Numbers are the result of some combination of low velocity, small

size, and high kinematic viscosity =

Thus, small surfaces, low flight speeds, or very high altitudes can provide the regime of low Reynolds Numbers. One interesting phenom­enon associated with low RN is the high form drag due to separation of the low energy boundary layer. The ordinary golf ball oper­ates at low RN and would have very high form drag without dimpling. The surface roughness from dimpling disturbs the laminar boundary layer forcing a premature transition to turbulent. The forced turbulence in the boundary layer reduces the form drag by pro­viding a higher energy boundary layer to allay separation. Essentially the same effect can be produced on a model airplane wing by roughening the leading edge—the turbulent boundary layer obtained may reduce the form drag due to separation. In each instance, the forced transition will be beneficial if the reduc­tion in form drag is greater than the increase in skin friction. Of course, this possibility exists only at low Reynolds Numbers.

In a similar sense, “trip" wires or small surface protuberances on a wind tunnel model may be used to force transition of the boundary layer and simulate the effect of higher Reynolds Numbers.

DEVELOPMENT OF AERODYNAMIC PITCHING MOMENTS

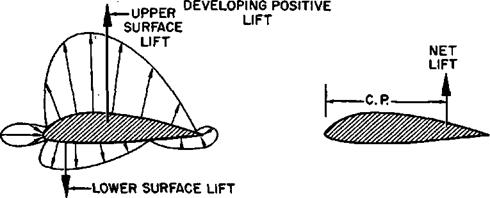
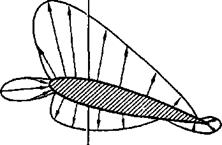
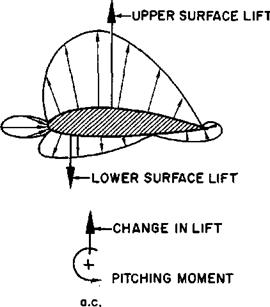
The distribution of pressure over a surface is the source of the aerodynamic moments as well as the aerodynamic forces. A typical example of this fact is the pressure distribution acting on the cambered airfoil of figure 1.21. The upper surface has pressures distributed which produce the upper surface lift; the lower surface has pressures distributed which pro­duce the lower surface lift. Of course, the net lift produced by the airfoil is difference between the lifts on the upper and lower sur­faces. The point along the chord where the distributed lift is effectively concentrated is termed the “center of pressure, c. p." The center of pressure is essentially the “center of gravity” of the distributed lift pressure and the location of the c. p. is a function of camber and section lift coefficient.

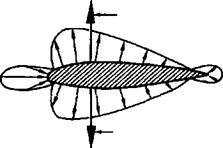
Another aerodynamic reference point is the “aerodynamic center, a. c.” The aerodynamic center is defined as the point along the chord where all changes in lift effectively take place. To visualize the existence of such a point, notice the change in pressure distribution with angle of attack for the symmetrical airfoil of figure 1.21. When at zero lift, the upper and lower surface lifts are equal and located at the same point. With an increase in angle of attack, the upper surface lift increases while the lower surface lift decreases. The – change of lift has taken place with no change in the center of pressure—a characteristic of sym­metrical airfoils.

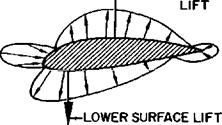
Next, consider the cambered airfoil of figure 1.21 at zero lift. To produce zero lift, the upper and lower surface lifts must be equal. One difference noted from the symmetrical air­foil is that the upper and lower surface lifts are not opposite one another. While no net lift exists on the airfoil, the couple produced by the upper and lower surface lifts creates a nose down moment. As the angle of attack is in­creased, the upper surface lift increases while the lower surface lift decreases. While a change in lift has taken place, no change in moment takes place about the point where the lift change occurs. Since the moment about the aerodynamic center is the product of a force (lift at the c. pJ) and a lever arm (distance from c. p. to an increase in lift moves the center of pressure toward the aero­dynamic center.

It should be noted that the symmetrical air­foil at zero lift has no pitching moment about the aerodynamic center because the upper and

CAMBERED AIRFOIL

DEVELOPMENT OF AERODYNAMIC PITCHING MOMENTS


Подпись: CAMBERED AIRFOIL AT ZERO LIFT SYMMETRICAL AIRFOIL
AT ZERO LIFT

A*—UPPER SURFACE

DEVELOPMENT OF AERODYNAMIC PITCHING MOMENTS


UPPER SURFACE LIFT


LOWER SURFACE LIFT


DEVELOPMENT OF AERODYNAMIC PITCHING MOMENTS

SYMMETRICAL AIRFOIL
AT POSITIVE LIFT

CAMBERED AIRFOIL AT POSITIVE LIFT
A-UPPER SURFACE LIFT

DEVELOPMENT OF AERODYNAMIC PITCHING MOMENTS

LOWER SURFACE LIFT


CHANGE IN LIFT


+


o. c.


DEVELOPMENT OF AERODYNAMIC PITCHING MOMENTSDEVELOPMENT OF AERODYNAMIC PITCHING MOMENTS

lower surface lifts act along the same vertical line. An increase in . lift on the symmetrical airfoil produces no change in this situation and the center of pressure remains fixed at the aero­dynamic center.

The location of the aerodynamic center of an airfoil is not affected by camber, thickness, and angle of attack. In fact, two-dimensional in­compressible airfoil theory will predict the aerodynamic center at the 25 percent chord point for any airfoil regardless of camber, thickness, and angle of attack. Actual airfoils, which are subject to real fluid flow, may not have the lift due to angle of attack concentrated at the exact 25 percent chord point. However, the actual location of the aerodynamic center for various sections is rarely forward of 23 percent or aft of 27 percent chord point.

The moment about the aerodynamic center has its source in the relative pressure distribu­tion and requires application of the coefficient form of expression for proper evaluation. The moment about the aerodynamic center is ex­pressed by the following equation :

АІВ. С.=CMa e qSc

where

e = moment about the aerodynamic center, a. c., ft.-lbs.

CM = coefficient of moment about the a. c.

a. c,

q=dynamic pressure, psf T=wing area, sq ft. c=chord, ft.

The moment coefficient used in this equation is the dimensionless ratio of the moment pressure to dynamic pressure moment and is a function

r h/ia. c.

мал— q$c

of the shape of the airfoil mean camber line. Figure 1.22 shows the moment coefficient,

cmae versus lift coefficient for several repre­sentative sections. The sign convention ap­plied to moment coefficients is that the nose-up moment is positive.

The NACA 0009 airfoil is a symmetrical sec­tion of 9 percent maximum thickness. Since the mean line of this airfoil has no camber, the coefficient of moment about the aerody­namic center is zero, i. e., the c. p. is at the a. c. The departure from zero стл, е, occurs only as the airfoil approaches maximum lift and the stall produces a moment change in the negative (nose-down) direction. The NACA 4412 and 63i~412 sections have noticeable positive cam­ber which cause relatively large moments about the aerodynamic center. Notice that for each section shown in figure 1.22, the fmeie. is constant for all lift coefficients less than ci.

max

The NACA 23012 airfoil is a very efficient conventional section which has been used on many airplanes. One of the features of the section is a relatively high with only a small c„a e The pitching moment coefficients | for this section are shown on figure 1.22 along with the effect of various type flaps added to the basic section. Large amounts of camber applied well aft on the chord cause large nega­tive moment coefficients. This fact is illus­trated by the large negative moment coeffi­cients produced by the 30° deflection of a 25 percent chord flap.

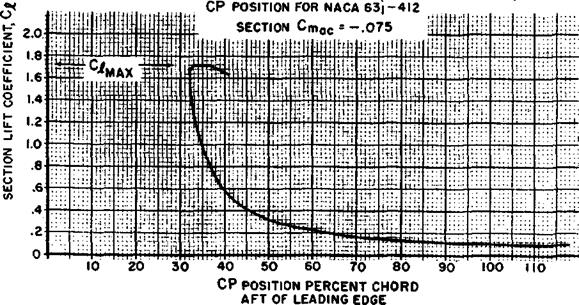
The cma e is a quantity determined by the shape of the mean-camber line. Symmetrical airfoils have zero c„ac and the c. p. remains at the a. c. in unstalled flight. The airfoil with positive camber will have a negative cmae which means the c. p. is behind the a. c. Since ther,^ is constant in unstalled flight a certain relationship between lift coefficient and center of pressure can be evolved. An example of this relationship is shown in figure 1.22 for the NACA 63i~412 airfoil by a plot of c. p. versus Cj. Note that at low lift coefficients the center of pressure is well aft—even past the trailing edge—and an increase in ct moves the c. p. for­ward toward the ax. The c. p. approaches the

DEVELOPMENT OF AERODYNAMIC PITCHING MOMENTS

DEVELOPMENT OF AERODYNAMIC PITCHING MOMENTS

CHANGE IN LIFT DUE TO UPGUST

DEVELOPMENT OF AERODYNAMIC PITCHING MOMENTS


CHANGE IN LIFT DUE TO UPGUST

DEVELOPMENT OF AERODYNAMIC PITCHING MOMENTS


DEVELOPMENT OF AERODYNAMIC PITCHING MOMENTS

Figure 1.23. Application to Stability


ax. as a limit but as stall occurs, the drop in suction near the leading edge, cause the c. p. to move aft.

Of course, if the airfoil has negative camber, or a strongly reflexed trailing edge, the moment about the aerodynamic center will be positive. In this case, the location of the aerodynamic center will be unchanged and will remain at the quarter-chord position.

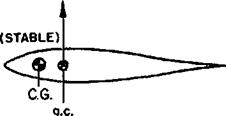
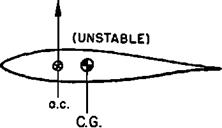
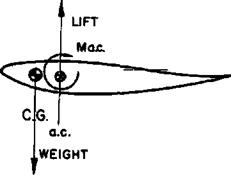
The aerodynamic center is the point on the chord where the coefficients of moment arc constant—the point where aJl changes in lift take place. The aerodynamic center is an ex­tremely important aerodynamic reference point and the most direct application is to the longi­tudinal stability of an airplane. To simplify the problem assume that the airplane is a tailless or flying wing type. In order for this type airplane to have longitudinal stability, the center of gravity must be ahead of the
aerodynamic center. This very necessary fea~ ture can be visualized from the illustrations of figure 1.23.

If the two symmetrical airfoils are subject to an upgust, an increase in lift will take place at the ax. If the c. g. is ahead of the ax., the change in lift creates a nose down moment about the c. g. which tends to return the air­foil to the equilibrium angle of attack. This stable, "weathercocking” tendency to return to equilibrium is a very necessary feature in any airplane. If the c. g. is aft of the ax., the change in lift due to the upgust takes place at the a. c. and creates a nose up moment about the c. g. This nose up moment tends to displace the airplane farther from the equilibrium and is unstable—the airplane is similar to a ball balanced on a peak. Hence, to have a stable airplane, the c. g. must be located ahead of the airplane a. c.

An additional requirement of stability is that the airplane must stabilize and be trimmed for flight at positive lift. When the c. g. is located ahead of a. c., the weight acting at the c. g. is supported by the lift developed by the section. Negative camber is required to pro­duce the positive moment about the aerody­namic center which brings about equilibrium or balance at positive lift.

Supersonic flow produces important changes in the aerodynamic characteristics of sections. The aerodynamic center of airfoils in subsonic flow is located at the 25 percent chord point. As the airfoil is subject to supersonic flow, the aerodynamic center changes to the 50 percent chord point. Thus, the airplane in transonic flight can experience large changes in longitu­dinal stability because of the large changes in the position of the aerodynamic center.

HIGH LIFT DEVICES

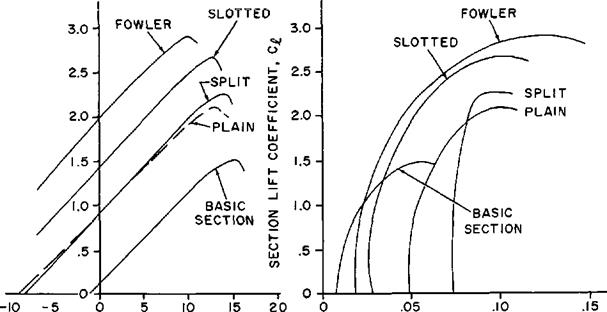
There are many different types of high lift devices used to increase the maximum lift co­efficient for low speed flight. The high lift devices applied to the trailing edge of a section consist of a flap which is usually 15 to 25 per­cent of the chord. The deflection of a flap produces the effect of a large amount of camber added well aft on the chord. The principal types of flaps are shown applied to a basic sec­tion of airfoil. The effect of a 30° deflection of a 25 percent chord flap is shown on the lift and drag curves of figure 1.17.

BASIC SECTION

HIGH LIFT DEVICES


PLAIN FLAP SPLIT FLAP

HIGH LIFT DEVICES


FOWLER FLAP

HIGH LIFT DEVICES


SLOTTED FLAP

HIGH LIFT DEVICES


EFFECT ON SECTION-LIFT AND DRAG
CHARACTERISTICS OF A 25% CHORD
FLAP DEFLECTED 30°

HIGH LIFT DEVICES

Подпись: SECTION LIFT COEFFICIENT, C£

SECTION ANGLE OF ATTACK SECTION DRAG COEFFICIENT

o0l DEGREES Cd

Figure 1.17. Flap Configurations

Revised Jonuory 1965

The plain flap shown in figure 1.17 is a simple hinged portion of the trailing edge. The effect of the camber added well aft on the chord causes a significant increase in ctmai. In addi­tion, the zero lift angle changes to a more negative value and the drag increases greatly. The split flap shown in figure 1.17 consist of plate deflected from the lower surface of the section and produces a slightly greater change in Ci than the plain flap. However, a much larger change in drag results from the great turbulent wake produced by this type flap. The greater drag may not be such a disadvan­tage when it is realized that it may be advan­tageous to accomplish steeper landing ap­proaches over obstacles or require higher power from the engine during approach (to minimize engine acceleration time for waveoff).

The slotted flap is similar to the plain flap but the gap between the main section and flap leading edge is given specific contours. High energy air from the lower surface is ducted to the flap upper surface. The high energy air from the slot accelerates the upper surface boundary layer and delays airflow separation to some higher lift coefficient. The slotted flap can cause much greater increases in clmi than the plain or split flap and section drags are much lower.

The Fowler flap arrangement is similar to the slotted flap. The difference is that the de­flected flap segment is moved aft along a set of tracks which increases the chord and effects an increase in wing area. The Fowler flap is characterized by large increases in clmax with minimum changes in drag. .

One additional factor requiring consider­ation in a comparison of flap types is the aero­dynamic twisting moments caused by the flap. Positive camber produces a nose down twisting moment—especially great when large camber is used well aft on the chord (an obvious implication is that flaps are not prac­tical on a flying wing or tailless airplane). The deflection of a flap causes large nose down moments which create important twisting loads on the structure and pitching moments that must be controlled with the horizontal tail. Unfortunately, the flap types producing the greatest increases in clmax usually cause the greatest twisting moments. The Fowler flap causes the greatest change in twisting moment while the split flap causes the least. This factor-along with mechanical complexity of the installation—may complicate the choice of a flap configuration.

The effectiveness of flaps on a wing con­figuration depend on many different factors. One important factor is the amount of the wing area affected by the flaps. Since a certain amount of the span is reserved for ailerons, the actual wing maximum lift prop­erties will be less than that of the flapped two-dimensional section. If the basic wing has a low thickness, any type of flap will be less effective than on a wing of greater thick­ness. Sweepback of the wing can cause an additional significant reduction in the effec­tiveness of flaps.

High lift devices applied to the leading edge of a section consist of slots, slats, and small amounts of local camber. The fixed slot in a wing conducts flow of high energy air into the boundary layer on the upper surface and delays airflow separation to some higher angle of attack and lift coefficient. Since the slot alone effects no change in camber, the higher maximum lift coefficient will be obtained at a higher angle of attack, i. e., the slot simply delays stall to a higher angle of attack. An automatic slot arrangement consists of a leading edge segment (slat) which is free to move on tracks. At low йngles of attack the slat is held flush against the leading edge by the high positive local pressures. When the section is at high angles of attack, the high local suction pressures at the leading edge create a chordwise force forward to actuate the slat. The slot formed then allows the section to continue to a higher angle of attack and produce а сгтах greater than that of the

FIXED SL^ f

HIGH LIFT DEVICES


AUTOMATIC SLOT

HIGH LIFT DEVICES


BOUNDARY LAYER CONTROL BY UPPER SURFACE SUCTION

HIGH LIFT DEVICES


HIGH LIFT DEVICES
BOUNDARY LAYER CONTROL
BY FLAP AUGMENTATION

SECTION ANGLE OF ATTACK SECTION ANGLE OF ATTACK

a0, DEGREES a0, DEGREES

Figure 1.13. Effect of Slots and Boundary Layer Control


basic section. The effect of a fixed slot on the lift characteristics is shown in figure 1.18.

Slots and slats can produce significant in­creases in cXmu but the increased angle of attack for maximum lift can be a disadvantage. If slots were the only high lift device on the wing, the high take off and landing angles of attack may complicate the design of the landing gear. For this reason slots or slats are usually used in conjunction with flaps since the flaps provide reduction in the maxi­mum lift angle of attack. The use of a slot has two important advantages: there is only a negligible change in the pitching moment due to the slot and no significant change in section drag at low angles of attack. In fact, the slotted section will have less drag than the basic section near the maximum lift angle for the basic section.

The slot-slat device finds great application in modern airplane configurations. The tail­less airplane configuration can utilize only the high lift devices which have negligible effect on the pitching moments. The slot and slat are often used to increase the cimai in high speed flight when compressibility effects are con­siderable. The small change in twisting mo­ment is a favorable feature for any high lift device to be used at high speed. Leading edge high lift devices are more effective on the highly swept wing than trailing edge flaps since slats are quite powerful in controlling the flow pattern. Small amounts of local camber added to the leading edge as a high lift device is most effective on wings of very low thick­ness and sharp leading edges. Most usually the slope of the leading edge high lift device is used to control the spanwise lift distribution on the wing.

‘Boundary laytr control devices are additional means of increasing the maximum lift coeffi­cient of a section. The thin layer of airflow adjacent to the surface of an airfoil shows re­duced local velocities from the effect of skin friction. When at high angles of attack this boundary layer on the upper surface tends to stagnate and come to a stop. If this happens the airflow will separate from the surface and stall occurs. Boundary layer control for high lift applications features various devices to maintain high velocity in the boundary layer to allay separation of the airflow. This con­trol of the boundary layer kinetic energy can be accomplished in two ways. One method is the application of a suction through ports to draw off low energy boundary layer and replace it with high velocity air from outside the boundary layer. The effect of surface suction boundary layer control on lift characteristics is typified by figure 1.18. Increasing surface suction produces greater maximum lift coeffi­cients which occur at higher angles of attack. The effect is similar to that of a slot because the slot is essentially a boundary layer control device ducting high energy air to the upper surface.

Another method of boundary layer control is accomplished by injecting a high speed jet of air into the boundary layer. This method produces essentially the same results as the suction method and is the more practical in­stallation. The suction type BLC requires the installation of a separate pump while the ‘ ‘blown’ ’ BLC system can utilize the high pres­sure source of a jet engine compressor. The typical installation of a high pressure BLC system would be the augmentation of a de­flected flap. Since any boundary layer control tends to increase the angle of attack for maxi­mum lift, it is important to combine the bound­ary layer control with flaps since the flap de­flection tends to reduce the angle of attack for maximum lift.

OPERATION OF HIGH LIFT DEVICES. The management of the high lift devices on an airplane is an important factor in flying opera­tions, The devices which are actuated auto­matically—such as automatic slats and slots— are usually of little concern and cause little complication since relatively small changes in drag and pitching moments take place. How­ever, the flaps must be properly managed by the pilot to take advantage of the capability

Подпись: NAVWEPS 00—80T—80 BASIC AERODYNAMICS

HIGH LIFT DEVICESHIGH LIFT DEVICES

Figure 1.19. Effect of Flaps on Airplane Characteristics


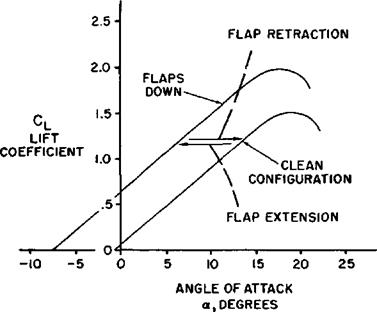
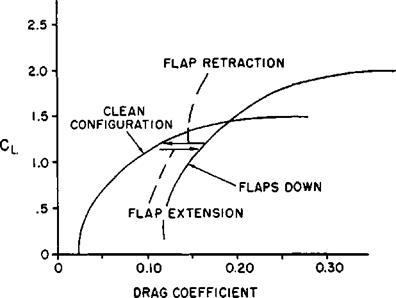
of such a device. To illustrate a few principles of flap management, figure 1.19 presents the lift and drag curves of a typical airplane in the clean and flap down configurations.

In order to appreciate some of the factors involved in flap management, assume that the airplane has just taken off and the flaps are extended. The pilot should not completely retract the flaps until the airplane has sufficient speed. If the flaps are retracted prematurely at insufficient airspeed, maximum lift coeffi­cient of the clean configuration may not be able to support the airplane and the airplane will sink or stall. Of course, this same factor must be considered for intermediate flap posi­tions between fully retracted and fully ex­tended. Assume that the airplane is allowed to gain speed and reduce the flight lift coeffi­cient to the point of flap retraction indicated on figure 1.19. As the configuration is altered from the "cluttered” to the clean configura­tion, three important changes take place:

(1) The reduction in camber by flap re­traction changes the wing pitching moment and—for the majority of airplanes—requires retrimming to balance the nose up moment change. Some airplanes feature an automat­ic retrimming which is programmed with flap deflection.

(2) The retraction of flaps shown on figure 1.19 causes a reduction of drag coeffi­cient at that lift coefficient. This drag reduction improves the acceleration of the airplane.

(3) The retraction of flaps requires an increase in angle of attack to maintain the same lift coefficient. Thus, if airplane accel­eration is low through the flap retraction speed range, angle of attack must be in­creased to prevent the airplane from sinking. This situation is typical after takeoff when gross weight, density altitude, and tempera­ture are high. However, some aircraft have such high acceleration through the flap re­traction speed that the rapid gain in air­speed requires much less noticeable attitude change.

When the flaps are lowered for landing essen­tially the same items must be considered. Ex­tending the flaps will cause these changes to take place:

(1) Lowering the flaps requires retrim­ming to balance the nose down moment change.

(2) The increase in drag requires a higher power setting to maintain airspeed and altitude.

(3) The angle of attack required to pro­duce the same lift coefficient is less, e. g., flap extension tends to cause the airplane to "balloon.”

An additional factor which must be consid­ered when rapidly accelerating after takeoff, or when lowering the flaps for landing, is the limit airspeed for flap extension. Excessive airspeeds in the flap down configuration may cause structural damage.

In many aircraft the effect of intermediate flap deflection is of primary importance in certain critical operating conditions. Small initial deflections of the flap cause noticeable changes in Cwithout large changes in drag coefficient. This feature is especially true of the airplane equipped with slotted or Fowler flaps (refer to fig. 1.17). Large flap deflections past 30° to 35° do not create the same rate of change of Cl^ but do cause greater changes in CD■ A fact true of most airplanes is that the first 50 percent of flap deflection causes more than half of the total change in Cl^ and the last 50 percent of flap deflection causes more than half of the total change in CD.

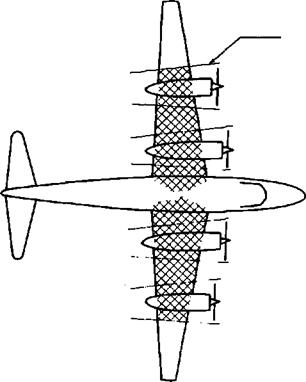
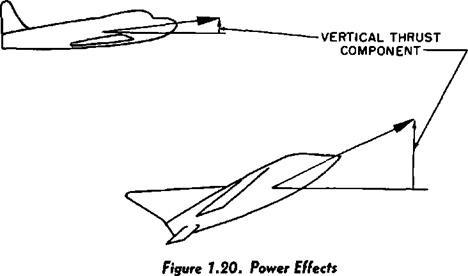
The effect of power on the stall speed of an airplane is determined by many factors. The most important factors affecting this relation­ship are powerplant type (prop or jet), thrust- to-weight ratio, and inclination of the thrust vector at maximum lift. The effect of the propeller is illustrated in figure 1.20. The slipstream velocity behind the propeller is different from the free stream velocity depend­ing on the thrust developed. Thus, when the propeller driven airplane is at low airspeeds

INDUCED FLOW FROM PROPELLER SLIPSTREAM


HIGH LIFT DEVICESHIGH LIFT DEVICES

NAVWEPS 00-80T-80

BASIC aerodynamics

and high power, the dynamic pressure in the shaded area can be much greater than the free stream and this causes considerably greater lift than at zero thrust. At high power con­ditions the induced flow also causes an effect similar to boundary layer control and increases the maximum lift angle of attack. The typical four-engine propeller driven airplane may have 60 to 80 percent of the wing area affected by the induced flow and power effects on stall speeds may be considerable. Also, the lift of the airplane at a given angle of attack and air­speed will be greatly affected. Suppose the airplane shown is in the process of landing flare from a power-on approach. If there is a sharp, sudden reduction of power, the air­plane may drop suddenly because of the reduced lift.

The typical jet aircraft docs not experience the induced flow velocities encountered in propeller driven airplanes, thus the only sig­nificant factor is the vertical component of thrust. Since this vertical component con­tributes to supporting the airplane, less aero­dynamic lift is required to hold the airplane in flight. If the thrust is small and the thrust inclination is slight at maximum lift angle, only negligible changes in stall speed will re­sult. On the other hand, if the thrust is very great and is given a large inclination at maxi­mum lift angle, the effect on stall speed can be very large. One important relationship remains—since there is very little induced flow from the jet, the angle of attack at stall is essentially the same power-on or power-off.

FLIGHT AT HIGH LIFT CONDITIONS

It is frequently stated that the career Naval Aviator spends more than half his life “below a thousand feet and a hundred knots.” Re­gardless of the implications of such a state­ment, the thought does connote the relation­ship of minimum flying speeds and carrier aviation. Only in Naval Aviation is there such importance assigned to precision control of the aircraft at high lift conditions. Safe operation in carrier aviation demands precision control of the airplane at high lift conditions.

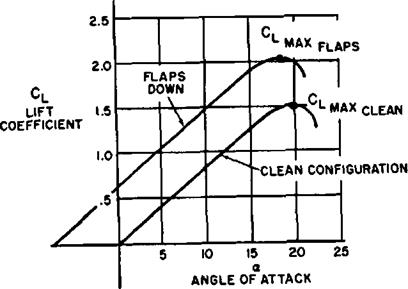
The aerodynamic lift characteristics of an airplane are portrayed by the curve of lift coefficient versus angle of attack. Such a curve is illustrated in figure 1.15 for a specific airplane in the clean and flap down configura­tions. A given aerodynamic configuration ex­periences increases in lift coefficient with in­creases in angle of attack until the maximum lift coefficient is obtained. A further increase in angle of attack produces stall and the lift coefficient then decreases. Since the maximum lift coefficient corresponds to the minimum speed available in flight, it is an important point of reference. The stall speed of the air­craft in level flight is related by the equation:

W

oS where

stall speed, knots TAS W= gross weight, lbs.

CLmax=airplane maximum lift coefficient 0=altitude density ratio T=wing area, sq. ft.

This equation illustrates the effect on stall speed of weight and wing area (or wing load­ing, WjS’), maximum lift coefficient, and alti­tude. If the stall speed is desired in EAS, the density ratio will be that for sea level (or= 1.000).

EFFECT OF WEIGHT. Modern configu­rations of airplanes are characterized by a large percent of the maximum gross weight being
fuel. Hence, the gross weight and stall speed of the airplane can vary considerably through­out the flight. The effect of only weight on stall speed can be expressed by a modified form of the stall speed equation where density ratio, CLmax, and wing area are held constant.

F

V wx

where

Vtl = stall speed corresponding to some gross weight, Wi

Vl2= stall speed corresponding to a dif­ferent gross weight, W2

As an illustration of this equation, assume that a particular airplane has a stall speed of 100 knots at a gross weight of 10,000 lbs. The stall speeds of this same airplane at other gross weights would be:

Gross weight% lbs. Stall speed, knots EAS

10,0 100

11,000 lOOX^/-^—-=105

V 10,000

12,0 110

14,400 120

9,000 95

8,100 90

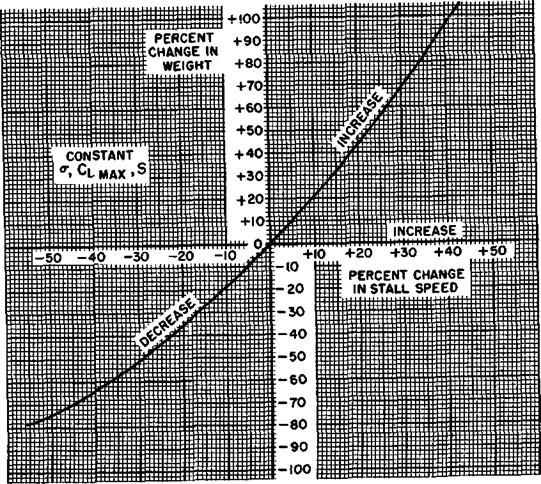
Figure 1.15 illustrates the effect of weight on stall speed on a percentage basis and will be valid for any airplane. Many specific condi­tions of flight are accomplished at certain fixed angles of attack and lift coefficients. The effect of weight on a percentage basis on the speeds for any specific lift coefficient and angle of attack is identical. Note that at small variations of weight, a rule of thumb may express the effect of weight on stall speed— “a 2 percent change in weight causes a 1 per­cent change in stall speed.”

EFFECT OF MANEUVERING FLIGHT. Turning flight and maneuvers produce an effect on stall speed which is similar to the effect of weight. Inspection of the chart on figure 1.16 shows the forces acting on an airplane in a steady turn. Any steady turn requires that the vertical component of lift be equal to

EFFECT OF FLAPS

FLIGHT AT HIGH LIFT CONDITIONS

EFFECT OF WEIGHT ON STALL SPEED

FLIGHT AT HIGH LIFT CONDITIONS

Figure 1.15. Flight at High Lift Conditions

weight of the airplane and the horizontal com­ponent of lift be equal to the centrifugal force. Thus, the aircraft in a steady turn develops a lift greater than weight and experiences in­creased stall speeds.

Trigonometric relationships allow deter­mination of the effect of bank angle on stall speed and load factor. The load factor, », is the proportion between lift and weight and is determined by:

L

n=W

1

n=—– 7

COS Ф

where

»=load factor (or “G”) cos Ф = cosine of the bank angle, ф (phi)

Typical values of load factor determined by this relationship are:

ф_, 0° 15° 30° 43° 60° 75 5°

я. .1.00 1.035 1.154 1.414 2.000 4.000
The stall speed in a turn can be determined by:
У. ф=У, фі

where

У, Ф=stall speed at some bank angle ф V, = stall speed for wing level, lift-equal – weight flight

n = load factor corresponding to the bank angle

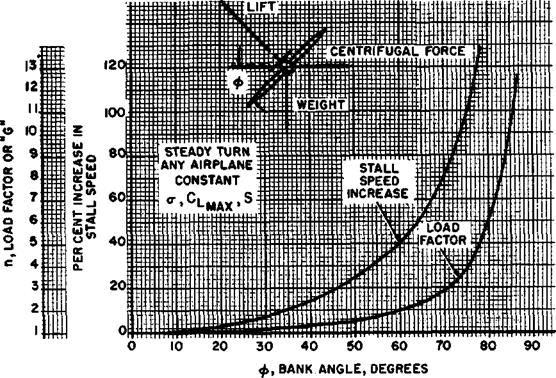
The percent increase in stall speed in a mm is shown on figure 1.16. Since this chart is predi­cated on a steady turn and constant CLmax, the figures are valid for any airplane. The chart shows that no appreciable change in load fac­tor or stall speed occurs at bank angles less than 30°. Above 45° of bank the increase in load factor and stall speed is quite rapid. This fact emphasizes the need for avoiding steep turns at low airspeeds—a flight condition common to stall-spin accidents.

EFFECT OF HIGH LIFT DEVICES. The primary purpose of high lift devices (flaps, slots, slats, etc.) is to increase the CLm<a of the airplane and reduce the stall speed. The take­off and landing speeds are consequently re­duced. The effect of a typical high lift device is shown by the airplane lift curves of figure 1.15 and is summarized here:

Configuration

“forC‘№

1.5

20°

2.0

18.5°

The principal effect of the extension of flaps is to increase the CLmax and reduce the angle of attack for any given lift coefficient. The in­crease in Czmax afforded by flap deflection re­duces the stall speed in a certain proportion, the effect described by the equation:

where

V,/=stall speed with flaps down

V,=stall speed without flaps

Cbm=maximum lift coefficient of the clean configuration

CT, mf— maximum lift coefficient with flaps down

For example, assume the airplane described by the lift curves of figure 1.15 has a stall speed of 100 knots at the landing weight in the clean configuration. If the flaps are lowered the reduced stall speed is reduced to:

V.,= 100X^5

= 86.5 knots

FLIGHT AT HIGH LIFT CONDITIONS

EFFECT OF C, ON STALL SPEED lMAX


FLIGHT AT HIGH LIFT CONDITIONS

Revised Jatn/шу 1965


Thus, with the higher lift coefficient available, less dynamic pressure is required to provide the necessary lift.

Because of the stated variation of stall speed with CimaI) large changes in CLmax are necessary to produce significant changes in stall speed. This effect is illustrated by the graph in figure 1.16 and certain typical values are shown below:

Percent increase in Cj^………………….. 2 10 50 100 300

Percent reduction in stall speed.. 1 5 18 29 50

The contribution of the high lift devices must be considerable to cause large reduction in stall speed. The most elaborate combination of flaps, slots, slats, and boundary layer con­trol throughout the span of the wing would be required to increase CLmgx by 300 percent. A common case is that of a typical propeller driven transport which experiences a 70 per­cent increase in CLma by full flap deflection. A typical single engine jet fighter with a thin swept wing obtains a 20 percent increase in Cim by full flap deflection. Thin airfoil sec­tions with sweepback impose distinct limita­tions on the effectiveness of flaps and the 20 percent increase in CLmgx by flaps is a typical— if not high—value for such a configuration.

One factor common to maximum lift condi­tion is the angle of attack and pressure distri­bution. The maximum lift coefficient of a particular wing configuration is obtained at one angle of attack and one pressure distribu­tion. Weight, bank angle, load factor, density altitude, and airspeed have no direct effect on the stall angle of attack. This fact is sufficient justification for the use of angle of attack indi­cators and stall warning devices which sense pressure distribution on the wing. During flight maneuvers, landing approach, takeoff, turns, etc. the airplane will stall if the critical angle of attack is exceeded. The airspeed at which stall occurs will be determined by weight, load factor, and altitude but the stall angle of attack is unaffected. At any particu­lar altitude, the indicated stall speed is a func­tion of weight and load factor. An increase in altitude will produce a decrease in density and increase the true airspeed at stall. Also, an increase in altitude will alter compressibility and viscosity effects and, generally speaking, cause the indicated stall speed to increase. This particular consideration is usually sig­nificant only above altitudes of 20,000 ft.

Recovery from stall involves a very simple concept. Since stall is precipitated by an excessive angle of attack, the angle of attack must be decreased. This is a fundamental princi­ple which is common to any airplane.

An airplane may be designed to be “stall – proof” simply by reducing the effectiveness of the elevators. If the elevators are not power­ful enough to hold the airplane to high angles of attack, the airplane cannot be stalled in any condition of flight. Such a requirement for a tactical military airplane would seriously re­duce performance. High lift coefficients near the maximum are required for high maneuver­ability and low landing and takeoff speeds. Hence, the Naval Aviator must appreciate the effect of the many variables affecting the stall speed and regard “attitude flying,” angle of attack indicators, and stall warning devices as techniques which allow more precise control of the airplane at high lift conditions.

Aerodynamic FORCE COEFFICIENT

The aerodynamic forces of lift and drag depend on the combined effect of many different vari­ables. The important single variables could be:

(1) Airstream velocity

(2) Air density

(3) Shape or profile of the surface

(4) Angle of attack

(5) Surface area

(6) Compressibility effects

(7) Viscosity effects

If the effects of viscosity and compressibility are not of immediate importance, the remain­ing items caq be combined for consideration. Since the major aerodynamic forces are the result of various pressures distributed on a surface, the surface area will be a major factor. Dynamic pressure of the airstream is another common denominator of aerodynamic forces and is a major factor since the magnitude of a pressure distribution depends on the source energy of the free stream. The remaining major factor is the relative pressure distribution

existing on the surface. Of course, the ve­locity distribution, and resulting pressure dis­tribution, is determined by the shape or pro­file of the surface and the angle of attack. Thus, any aerodynamic force can be repre­sented as the product of three major factors: the surface area of the object the dynamic pressure of the airstream the coefficient or index of force determined by the relative pressure distribution This relationship is expressed by the following equation:

F=CyqS

where

F = aerodynamic force, lbs.

CF=coefficient of aerodynamic force q=dynamic pressure, psf

=bv*

S= surface area, sq. ft.

In order to fully appreciate the importance of the aerodynamic force coefficient, CF, the above equation is rearranged to alternate forms:

Aerodynamic FORCE COEFFICIENT

C,= *£

1

In this form, the aerodynamic force coefficient is appreciated as the aerodynamic force per surface area and dynamic pressure. In other words, the force coefficient is a dimensionless ratio between the average aerodynamic pres­sure (aerodynamic force‘per area) and the air – stream dynamic pressure. All the aerodynamic forces of lift and drag are studied bn this basis— the common denominator in each case being surface area, and dynamic pressure. By such a definition, a "lift coefficient” would be the ratio between lift pressure and dynamic pres­sure; a "drag coefficient” would be the ratio between drag pressure and. dynamic pressure. The use of the coefficient form of an aero­dynamic force is necessary since the force coefficient is:

(1) An index of the aerodynamic force independent of area, density, and velocity.

It is derived from the relative pressure and velocity distribution.

(2) Influenced only by the shape of the surface and angle of attack since these factors determine the pressure distribution.

(3) An index which allows evaluation of the effects of compressibility and viscosity. Since the effects of area, density, and velocity are obviated by the coefficient form, com­pressibility and viscosity effects can be separated for study.

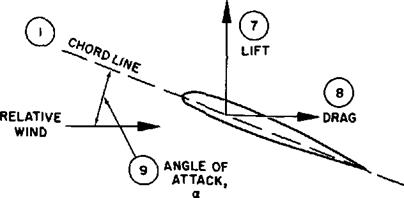
THE BASIC LIFT EQUATION. Lift has been defined as the net force developed per­pendicular to the relative wind. The aero­dynamic force of lift on an airplane results from the generation of a pressure distribution on the wing. This lift force is described by the following equation:

L^CtfS

where

L=lift, lbs.

Cl = lift coefficient. q—dynamic pressure, psf

-h>v*

wing surface area, sq. ft.

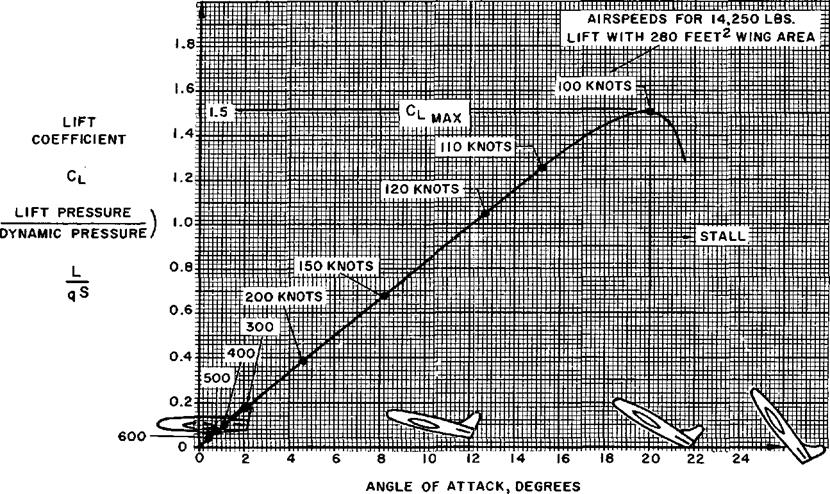
The lift coefficient used in this equation is the ratio of the lift pressure and dynamic pressure and is a function of the shape of the wing and angle of attack. If the lift coefficient of a conventional airplane wing planform were plotted versus angle of attack, the result would be typical of the graph of figure 1.11. Since the effects of speed, density, area, weight, alti­tude, etc., are eliminated by the coefficient form, an indication of the true lift capability is ob­tained. Each angle of attack produces a par­ticular lift coefficient since the angle of attack is the controlling factor in the pressure dis­tribution. Lift coefficient increases with angle of attack up to the maximum lift coefficient, Сйпах, and, as angle of attack is increased be­yond the maximum lift angle, the airflow is unable to adhere to the upper surface. The airflow then separates from the upper surface and stall occurs.

INTERPRETATION OF THE LIFT EQUA­TION. Several important relationships are

Подпись: NAVWEPS 00—ВОТ—80 BASIC AERODYNAMICS

Aerodynamic FORCE COEFFICIENT

а

Figure 1.11. Typical Lift Characteristics


Подпись: <rV2Подпись: Cr.cSПодпись: F. = 17.2Подпись: WПодпись: aSAerodynamic FORCE COEFFICIENTПодпись: whereПодпись: •~n4Подпись: 2Aerodynamic FORCE COEFFICIENT

derived from study of the basic lift equation and the typical wing lift curve. One impor­tant fact to be appreciated is that the airplane shown in figure 1.11 stalls at the same angle of attack regardless of weight, dynamic pres­sure, bank angle, etc. Of course, the stall speed of the aircraft will be affected by weight, bank angle, and other factors since the product of dynamic pressure, wing area, and lift co­efficient must produce the required lift. A rearrangement of the basic lift equation de­fines this relationship.

Я the airplane is flown in steady, level flight at sea level with lift equal to weight the stall speed would be:

Thus, a sea level airspeed (or EAS) of 100 knots would provide the dynamic pressure necessary at maximum lift to produce 14,250 lbs. of lift. If the airplane were operated at a higher weight, a higher dynamic pressure would be required to furnish rhe greater lift and a higher stall speed would result. If the airplane vere placed in a steep turn, the greater lift required in the turn would increase the stall speed. If the airplane were flown at a higher density altitude the TAS at stall would increase. However, one factor common to each of these conditions is that the angle of attack at CLmax is the зяте. 11 is important to realize that stall warning devices must sense angle of attack (a) or pressure distribution (related to Ci).

Another important fact related by the basic lift equation and lift curve is variation of angle of attack and lift coefficient with airspeed. Suppose that the example airplane is flown in steady, wing level flight at various airspeeds with lift equal to the weight. It is obvious that an increase in airspeed above the stall speed will require a corresponding decrease in lift coefficient and angle of attack to maintain steady, lift-equal-weight flight. The exact relationship of lift coefficient and airspeed is evolved from the basic lift equation assuming constant lift (equal to weight) and equivalent airspeeds.

Aerodynamic FORCE COEFFICIENT

The example airplane was specified to have:

Weight = 14,250 lbs.

C,„=15

F,= 100 knots EAS

The following table depicts the lift coefficients and angles of attack at various airspeeds in steady flight.

Aerodynamic FORCE COEFFICIENT

V, knots

CL ҐУ. у ~v)

CL

a

100……………………….

1.000

1.50

20.0°

uo…………………………

.826

1.24

15.2°

120……………………….

.694

1.04

12.7°

150 ………………………

.444

.67

8.2°

200……………………….

.250

.38

4.6°

300 ………………………

• 111

.17

2.1°

400 ………………………

.063

.09

1.1°

500……………………….

.040

.06

.7°

600……………………….

.028

.04

.5°

Note that for the conditions of steady flight, each airspeed requires a specific angle of attack and lift coefficient. This fact provides a fun­damental concept of flying technique: Angle of attack is the primary control of airspeed in steady flight. Of course, the control stick or wheel allows the pilot to control the angle of attack and, thus, control the airspeed in steady flight. In the same sense, the throttle controls the output of the powerplant and allows the pilot to control rate of climb and descent at various airspeeds.

The real believers of these concepts are pro­fessional instrument pilots, LSO’s, and glider pilots.- The glider pilot (or flameout enthusi­ast) has no recourse but to control airspeed by angle of attack and accept whatever rate of descent is incurred at the various airspeeds. The LSO must become quite proficient at judg­ing the flight path and angle of attack of the airplane in the pattern. The more complete visual reference field available to the LSO allows him to judge the angle of attack of the airplane more accurately than the pilot. When the airplane approaches the LSO, the precise judgment of airspeed is by the angle of attack rather than the rate of closure. If the LSO sees the airplane on the desired flight path but with too low an angle of attack, the airspeed is too high; if the angle of attack is too high, the airspeed is too low and the air­plane is approaching the stall. The mirror landing system coupled with an angle of attack indicator is an obvious refinement. The mir­ror indicates the desired flight path and the angle of attack indicator allows precision con­trol of the airspeed. The accomplished instru­ment pilot is the devotee of ‘“attitude” flying technique—his creed being ‘‘attitude plus power equals performance.” During a GCA approach, the professional instrument pilot controls airspeed with stick (angle of attack) and rate of descent with power adjustment.

Maneuvering flight and certain transient conditions of flight tend to complicate the relationship of angle of attack and airspeed. However, the majority of flight and, certainly, the most critical regime of flight (takeoff, ap­proach, and landing), is conducted in essen­tially steady flight condition.

AIRFOIL LIFT CHARACTERISTICS. Air­foil section properties differ from wing or airplane properties because of the effect of the planform. Actually, the wing may have vari­ous airfoil sections from root to tip with taper, twist, sweepback and local flow components in a spanwise direction. The resulting aero­dynamic properties of the wing are determined by the action of each section along the span and the three-dimensional flow. Airfoil sec­tion properties are derived from the basic shape or profile in two-dimensional flow and the force coefficients are given a notation of lower case letters. For example, a wing or airplane lift coefficient is CL while an airfoil section lift coefficient is termed ct. Also, wing angle of attack is a while section angle of attack is differentiated by the use of a0. The study of section properties allows an objective consider­ation of the effects of camber, thickness, etc.

The lift characteristics of five illustrative airfoil sections are shown in figure 1.12. The section lift coefficient, ci, is plotted versus section angle of attack, «о, for five standard NACA airfoil profiles. One characteristic fea­ture of all airfoil sections is that the slope of the various lift curves is essentially the same. At low lift coefficients, the section lift coeffi­cient increases approximately 0.1 for each degree increase in angle of attack. For each of the airfoils shown, a 5° change in angle of

Подпись:
SECTION ANGLE OF ATTACK
®0>DEGREES

attack would produce an approximate 0,5 change in lift coefficient. Evidently, lift curve slope is not a factor important in the selection of an airfoil.

An important lift property affected by the airfoil shape is the section maximum lift co­efficient, ci. The effect of airfoil shape on ci can be appreciated by comparison of the lift curves for the five airfoils of figure 1.12. TheNACA airfoils 63ЧЮ6, 63ЧЮ9, and 63i-012 are symmetrical sections of a basic thickness distribution but maximum thicknesses of 6, 9, and 12 percent respectively. The effect of thickness on ci is obvious from an inspec­tion of these curves:

Section

“°f0r4na,

NACA 6ЯЮ6……………………………. ;…………

0.82

9.0°

IvJACA fiVOOQ……………………………………

1.10

10.5°

NACA 63,-012 ………………………………………

1.40

13.8°

The 12-percent section has a ctwa approxi­mately 70 percent greater than the 6-percent thick section. In addition, the thicker airfoils have greater benefit from the use of various high lift devices.

The effect of camber is illustrated by the lift curves of the NACA 4412 and 63i-412 sections. The NACA 4412 section is a 12 percent thick airfoil which has 4 percent maximum camber located at 40 percent of the chord. The NACA 63i-412 airfoil has the same thickness and thickness distribution as the 63r~012 but camber added to give a “design” lift coefficient (ci for minimum section drag) of 0.4. The lift curves for these two airfoils show that camber has a beneficial effect on Cimax.

Section

ao for ci

щах

N АСА 63,-012 (sy mmettkal)……… ■…………

1,40

13.8° 15.2°

NACA 63i-412 (Gunbered)……………………

1.73

An additional effect of camber is the change in zero lift angle. While the symmetrical sections have zero lift at zero angle of attack, the sections with positive camber have nega­tive angles for zero lift.

The importance of maximum lift coefficient is obvious. If the maximum lift coefficient is high, the stall speed will be low. However, the high thickness and camber necessary for high section maximum lift coefficients may produce low critical Mach numbers and large twisting moments at high speed. In other words, a high maximum lift coefficient is just one of the many features desired of an airfoil section.

DRAG CHARACTERISTICS. Drag is the net aerodynamic force parallel to the relative wind and its source is the pressure distribution and skin friction on the surface. Large, thick bluff bodies in an airstream show a predomi­nance of form drag due to the unbalanced pres­sure distribution. However, streamlined bodies with smooth contours show a predomi­nance of drag due to skin friction. In a fashion similar to other aerodynamic forces, drag forces may be considered in the form of a coefficient which is independent of dynamic pressure and surface area. The basic drag equation is as follows:

D=CDqS

where

D = drag, lbs.

Co^drag coefficient q= dynamic pressure, psf

= ^5 ^ ІП knots’ TAS)

L=wing surface area, sq. ft.

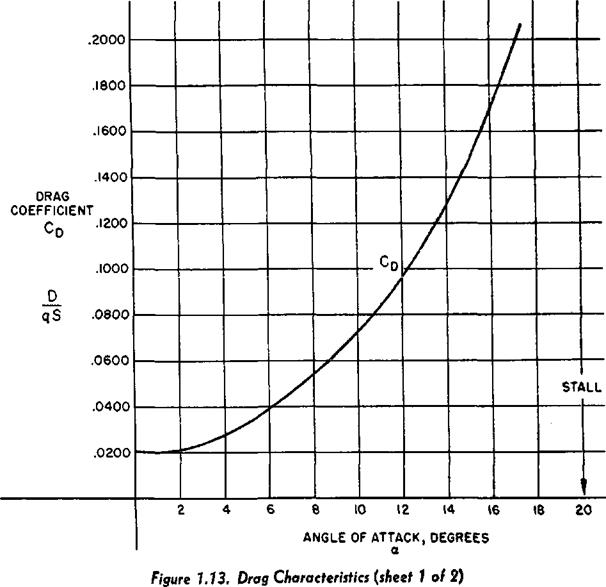
The force of drag is shown as the product of dynamic pressure, surface area, and drag co­efficient, Cn. The drag coefficient in this equation is similar to any other aerodynamic force coefficient—it is the ratio of drag pres­sure to dynamic pressure. If the drag co­efficient of a conventional airplane were plotted versus angle of attack, the result would be typical of the graph shown in figure 1.13. At low angles of attack the drag coefficient is low and small changes in angle of attack create only slight changes in drag coefficient. At

Aerodynamic FORCE COEFFICIENT

_jjo


Подпись: ANGLE OF ATTACK, DEGREES и Figure 1.13. Orag Characteristics (sheet 2 of 2)

о

О


Aerodynamic FORCE COEFFICIENT

Подпись: efficient and angle of attack. Type airplane: (L/D) «« High performance sailplane 25—40 Typical patrol or transport 12-20 High performance bomber 20-25 Propeller powered trainer 10-15 Jet trainer 14-16 Transonic fighter or attack 10-13 Supersonic fighter or attack 4-9 (subsonic)

higher angles of attack the drag coefficient is much greater and small changes in angle of attack cause significant changes in drag. As stall occurs, a large increase in drag takes place.

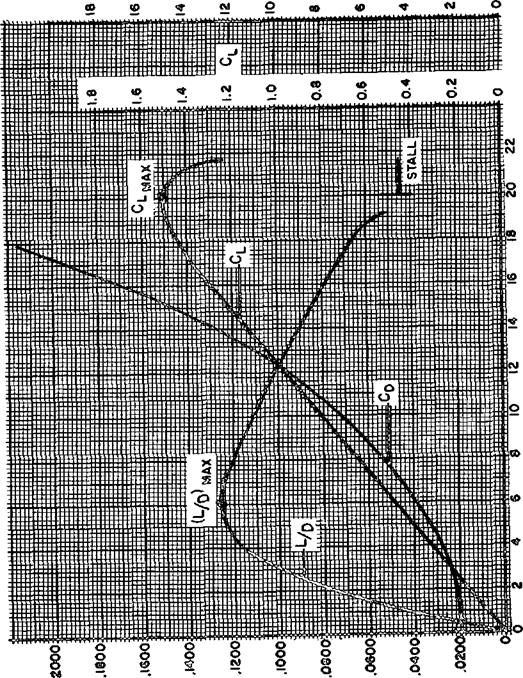
A factor more important in airplane per­formance considerations is the lift-drag ratio, LjD. With the lift and drag data available for the airplane, the proportions of CL and CD can be calculated for each specific angle of attack. The resulting plot of lift-drag ratio with angle of attack shows that LjD increases to some maximum then decreases at the higher lift coefficients and angles of attack. Note that the maximum lift-drag ratio, (L/D)max, occurs at one specific angle of attack and lift coeffi­cient. If the airplane is operated in steady flight at (L/L>)mai, the total drag is at a mini­mum. Any angle of attack lower or higher than that for (L/X))moi reduces the lift-drag ratio and consequently increases the total drag for a given airplane lift.

The airplane depicted by the curves of Figure 1.13 has a maximum lift-drag ratio of 12.5 at an angle of attack of 6°. Suppose this airplane is operated in steady flight at a gross weight of 12,500 lbs. If flown at the airspeed and angle of attack corresponding to (L/D)max, the drag would be 1,000 lbs. Any higher or lower airspeed would produce a drag greater than 1,000 lbs. Of course, this same airplane could be operated at higher or lower gross weights and the same maximum lift-drag ratio of 12.5 could be obtained at the same angle of attack of 6°. However, a change’ in gross weight would require a change in airspeed to support the new weight at the same lift co­

The configuration of an airplane has a great effect on the lift-drag ratio. Typical values of (LjDax are listed for various types of airplanes. While the high performance sail­plane may have extremely high lift-drag ratios, such an aircraft has no real economic or tactical purpose. The supersonic fighter may have seemingly low lift-drag ratios in subsonic flight but the airplane configurations required for supersonic flight (and high [LjD]’* at high Mach numbers) precipitate this situa­tion.

Many important items of airplane perform­ance are obtained in flight at (LjD’)max. Typi­cal performance conditions which occur at (LjD’)max are:

maximum endurance of jet powered air­planes

maximum range of propeller driven air­planes

maximum climb апф for jet powered air­planes

maximum power-off glide range, jet or prop

The most immediately interesting of these items is the power-off glide range of an air­plane. By examining the forces acting on an airplane during a glide, it can be shown that the glide ratio is numerically equal to the lift-drag ratio. For example, if the airplane in a glide has an (L/D) of 15, each mile of alti­tude is traded for 15 miles of horizontal dis­tance. Such a fact implies that the airplane should be flown at (LjD’)max to obtain the greatest glide distance.

An unbelievable feature of gliding perform­ance is the effect of airplane gross weight. Since the maximum lift-drag ratio of a given airplane is an intrinsic property of the aero­dynamic configuration, gross weight will not affect the gliding performance. If a typical jet trainer has an (L/D)^ of 15, the aircraft | can obtain a maximum of 15 miles horizontal distance for each mile of altitude. This would be true of this particular airplane at any gross

Revised January 1965

weight if the airplane is flown at the angle of attack for. Of course, the gross

weight would affect the glide airspeed neces­sary for this particular angle of attack but the glide ratio would be unaffected.

AIRFOIL DRAG CHARACTERISTICS. The total drag of an airplane is composed of the drags of the individual components and the forces caused by interference between these components. The drag of an airplane con­figuration must include the various drags due to lift, form, friction, interference, leakage, etc. To appreciate the factors which affect the drag of an airplane configuration, it is most logical to consider the factors which affect the drag of airfoil sections. In order to allow an objective consideration of the effects of thickness, camber, etc., the properties of two-dimensional sections must be studied. Airfoil section properties are derived from the basic profile in two-dimensional, flow and are provided the lower case shorthand notation to distinguish them from wing or airplane properties, c. g., wing or airplane drag coeffi­cient is CD while airfoil section drag coefficient is cd.
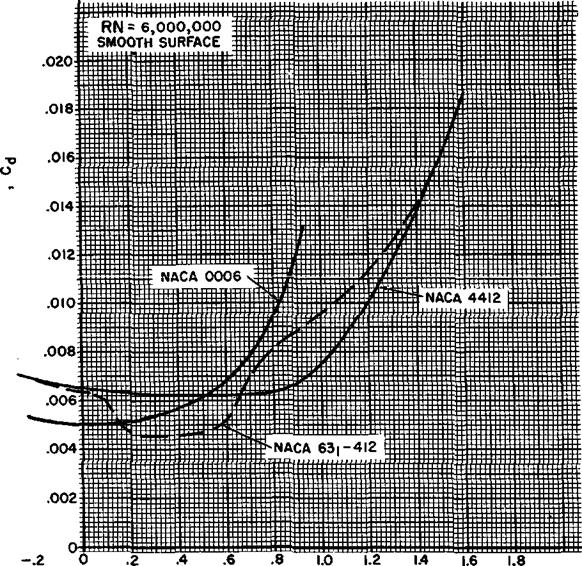
The drag characteristics of three illustrative airfoil sections are shown in figure 1.14. The section drag coefficient, cd, is plotted versus the section lift coefficient, Ci. The drag on the airfoil section is composed of pressure drag and skin friction. When the airfoil is at low lift coefficients, the drag due to skin friction predominates. The drag curve for a conven­tional airfoil tends to be quite shallow in this region since there is very little variation of skin friction with angle of attack. When the airfoil is at high lift coefficients, form or pressure drag predominates and the drag co­efficient varies rapidly with lift coefficient. The NACA 0006 is a thin symmetrical profile which has a maximum thickness of 6 percent located at 30 percent of the chord. This section shows a typical variation of cd and ci.

The NACA 4412 section is a 12 percent thick airfoil with 4 percent maximum camber at 40 percent chord. When this section is com­pared with the NACA 0006 section the effect of camber can be appreciated. At low lift coefficients the thm, symmetrical section has much lower drag. However, at lift coeffi­cients above 0.5 the thicker, cambered section has the lower drag. Thus, proper camber and thickness can improve the lift-drag ratio of the section.

The NACA 63i-412 is a cambered 12 percent thick airfoil of the “laminar flow” type. This airfoil is shaped to produce a design lift coefficient of 0.4. Notice that the drag curve of this airfoil has distinct aberrations with very low drag coefficients near the lift coeffi­cient of 0.4. This airfoil profile has its camber and thickness distributed to produce very low uniform velocity on the forward surface (mini­mum pressure point well aft) at this lift coeffi­cient. The resulting pressure and velocity distribution enhance extensive laminar flow in the boundary layer and greatly reduce the skin friction drag. The benefit of the laminar flow is appreciated by comparing the minimum drag of this airfoil with an airfoil which has one-half the maximum thickness—the NACA 0006.

The choice of an airfoil section will depend on the consideration of’many different factors. While the of the section is an important quality, a more appropriate factor for con­sideration is the maximum lift coefficient of the section when various high lift devices are applied. Trailing edge flaps and leading edge high lift devices are applied to increase the clmax for low speed performance. Thus, an appropriate factor for comparison is the ratio of section drag coefficient to section maximum lift coefficient with flaps—cdjclmf. When this quantity is corrected for compressibility, a preliminary selection of an airfoil section is possible. The airfoil having the lowest value of eje^ at the design flight condition (en­durance, range, high speed, etc.) will create the least section drag for a given design stall speed.

(DATA FROM NACA REPORT NO. 824)


Подпись: SECTION DRAG COEFFICIENT

Aerodynamic FORCE COEFFICIENT

SECTION LIFT COEFFICIENT

Figure 1.14. Drag Characteristics of Typical Airfoil Sections


Подпись: V,= 17.2Aerodynamic FORCE COEFFICIENTПодпись: max

DEVELOPMENT OF AERODYNAMIC FORCES

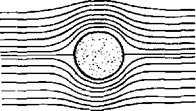
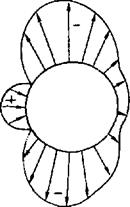
The typical airflow patterns exemplify the relationship of static pressure and velocity defined by Bernoulli. Any object placed in an airstream will have the air to impact or stag­nate at some point near the leading edge. The pressure at this point of stagnation will be an absolute static pressure equal to the total pres­sure of the airstream. In other words, the static pressure at the stagnation point will be greater than the atmospheric pressure by the amount of the dynamic pressure of the air­stream. As the flow divides and proceeds around the object, the increases in local ve­locity produce decreases in static pressure. This procedure of flow is best illustrated by the flow patterns and pressure distributions of figure 1.7.

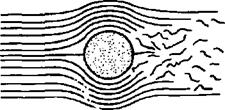
STREAMLINE PATTERN AND PRES­SURE DISTRIBUTION. The flow pattern of the cylinder of figure 1.7 is characterized by the streamlines which denote the local flow direction. Velocity distribution is noted by the streamline pattern since the streamlines effect a boundary of flow, and the airflow between the streamlines is similar to flow in a closed tube. When the streamlines contract and are close together, high local velocities exist; when the streamlines expand and are far apart, low local velocities exist. At the

DEVELOPMENT OF AERODYNAMIC FORCES

PRESSURE DISTRIBUTION ON A ‘.V )ER


DEVELOPMENT OF AERODYNAMIC FORCESDEVELOPMENT OF AERODYNAMIC FORCESDEVELOPMENT OF AERODYNAMIC FORCES

NEGLECTING FRICTION CONSIDERING FRICTION EFFECTS

DEVELOPMENT OF AERODYNAMIC FORCES
(PERFECT FLUID) (VISCOUS FLOW)

Figure 1.7. Streamline Pattern and Pressure Distribution


forward stagnation point the local velocity is zero and the maximum positive pressure re­sults. As the flow proceeds from the forward stagnation point the velocity increases as shown by the change in streamlines. The local velocities reach a maximum at the upper and lower extremities and a peak suction pres­sure is produced at these points on the cylinder. (Note: Positive pressures are pressures above atmospheric and negative or suction pressures are less than atmospheric.) As the flow continues aft from the peak suction pressure, the diverging streamlines indicate decreasing local velocities and increasing local pressures. If friction and compressibility effects are not considered, the velocity would decrease to zero at the aft stagnation point and the full stagna­tion pressure would be recovered. The pressure distribution for the cylinder in perfect fluid flow would be symmetrical and no net force (lift or drag) would result. Of course, the relationship between static pressure and Veloc­ity along the surface is defined by Bernoulli’s equation.

The flow pattern for the cylinder in an actual fluid demonstrates the effect of friction or viscosity. The viscosity of air produces a thin layer of retarded flow immediately adjacent to the surface. The energy expended in this “boundary layer” can alter the pressure dis­tribution and destroy the symmetry of the pattern. The force unbalance caused by the change in pressure distribution creates a drag force which is in addition to the drag due to skin friction.

The streamline pattern for the symmetrical airfoil of figure 1.7 again provides the basis for the velocity and pressure distribution. At the leading edge the streamlines are widely diverged in the vicinity of the positive pres­sures. The maximum local velocities and suction (or negative) pressures exist where the streamlines are the closest together. One notable difference between the flow on the cylinder and the airfoil is that the maximum velocity and minimum pressure points on the

airfoil do not necessarily occur at the point of maximum thickness. However, a similarity does exist in that the minimum pressure points correspond to the points where the streamlines are closest together and this condition exists when the streamlines are forced to the great­est curvature. .

GENERATION OF LIFT. An important phenomenon associated with the production of lift by an airfoil is the “circulation” im­parted to the airstream. The best practical illustration of this phenomenon is shown in figure 1.8 by the streamlines and pressure dis­tributions existing on cylinders in an airstream. The cylinder without circulation has a sym­metrical streamline pattern and a pressure dis­tribution which creates no net lift. If the cylinder is given a clockwise rotation and induces a rotational or circulatory flow, a dis­tinct change takes place in the streamline pat­tern and pressure distribution. The velocities due to the vortex of circulatory flow cause increased local velocity on the upper surface of the cylinder and decreased local velocity on the lower surface of the cylinder. Also, the circulatory flow produces an upwash immedi­ately ahead and downwash immediately be­hind the cylinder and both fore and aft stagna­tion points are lowered.

The effect of the addition of circulatory flow is appreciated by the change in the pressure distribution on the cylinder. The increased local velocity on the upper surface causes an increase in upper surface suction while the decreased local velocity on the lower surface causes a decrease in lower surface suction. As a result, the cylinder with circulation will produce a net lift. This mechanically induced circulation—called Magnus effect—illustrates the relationship between circulation and lift and is important to golfers, baseball and tennis players as well as pilots and aerodynamicists. The curvature of the flight path of a golf ball or baseball requires an unbalance of force which is created by rotation of the ball. The pitcher that can accurately control a powerful

DEVELOPMENT OF AERODYNAMIC FORCES

ROTATING CYLINDER


AIRFOIL LIFT
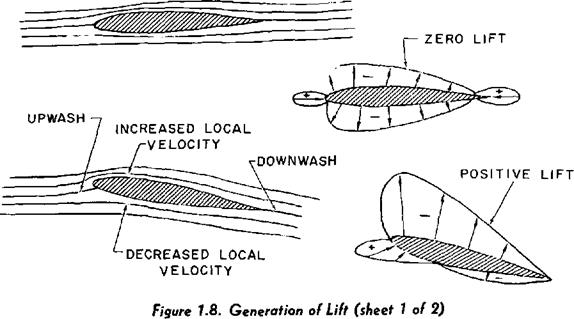
 

DEVELOPMENT OF AERODYNAMIC FORCES

DEVELOPMENT OF AERODYNAMIC FORCES

Figure 1.8. Generation of Lift (sheet 2 of 2)

BASIC AIRFOIL SHAPE AND ANGLE OF ATTACK
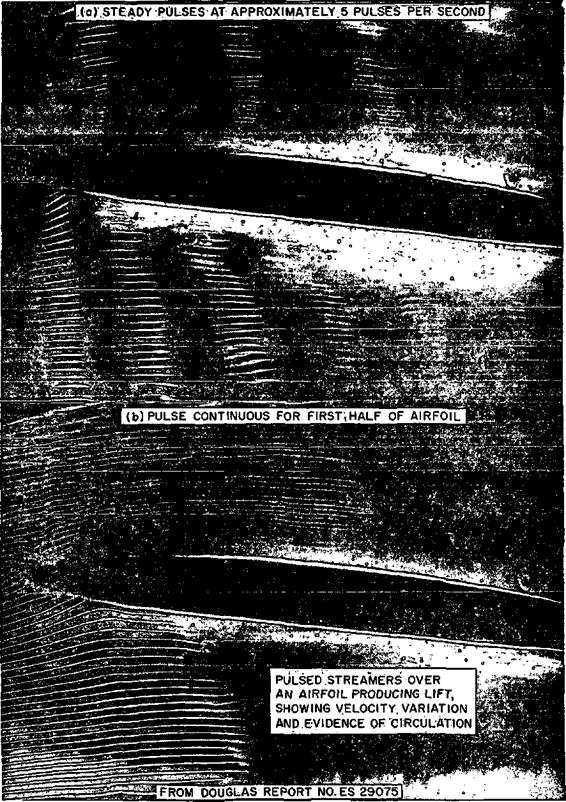
DEVELOPMENT OF AERODYNAMIC FORCES

ORIGINAL ANGLE OF ATTACK AND DYNAMIC PRESSURE, q

DEVELOPMENT OF AERODYNAMIC FORCES


ORIGINAL ANGLE OF ATTACK AND DYNAMIC PRESSURE BUT ONE-HALF ORIGINAL SIZE

DEVELOPMENT OF AERODYNAMIC FORCES


DEVELOPMENT OF AERODYNAMIC FORCES

AIRFOIL SHAPE AND ANGLE OF ATTACK DEFINE
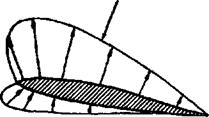
RELATIVE PRESSURE DISTRIBUTION

Figure 1.9. Airfoil Pressure Distribution


rotation will be quite a “curve ball artist" the golfer that cannot control the lateral mo­tion of the club face striking the golf ball will impart an uncontrollable spin and have trouble with a “hook” or "slice.”

While a rotating cylinder can produce a net lift from the circulatory flow, the method is relatively inefficient and only serves to point out the relationship between lift and circula-, tion. An airfoil is capable of producing lift with relatively high efficiency and the process is illustrated in figure 1.8. If a symmetrical airfoil is placed at zero angle of attack to the airstream, the streamline pattern and pressure distribution give evidence of zero lift. How­ever, if the airfoil is given a positive angle of attack, changes occur in the streamline pattern and pressure distribution similar to changes caused by the addition of circulation to the cylinder. The positive angle of attack causes increased velocity on the upper surface with an increase in upper surface suction while the decreased velocity on the lower surface causes a decrease in lower surface suction. Also, upwash is generated ahead of the airfoil, the forward stagnation point moves under the leading edge, and a downwash is evident aft of the airfoil. The pressure distribution on the airfoil now provides a net force perpendicu­lar to the airstream—lift.

The generation of lift by an airfoil is depend­ent upon the airfoil being able to create circu­lation in the airstream and develop the lifting, pressure distribution on the surface. In all cases, the generated lift will be the net force caused by the distribution of pressure over the upper and lower surfaces of the airfoil. At low angles of attack, suction pressures usually will exist on both upper and lower surfaces but the upper surface suction must be greater for positive lift. At high angles of attack near that for maximum lift, a positive pressure will exist on the lower surface but this will account for approximately one-third the net lift.

The effect of free stream density and velocity is a necessary consideration when studying the development of the various aerodynamic forces. Suppose that a particular shape of airfoil is fixed at a particular angle to the airstream. The relativ» velocity and pressure distribution will be determined by the shape of the airfoil and the angle to the airstream. The effect of varying the airfoil size, air density and air­speed is shown in figure 1.9. If the same air­foil shape is placed at the same angle to an airstream with twice as great a dynamic pres­sure the magnitude of the pressure distribution will be twice as great but the relative shape of the pressure distribution will be the same. With twice as great a pressure existing over the surface, all aerodynamic forces and mo­ments will double. If a half-size airfoil is placed at the same angle to the original air­stream, the magnitude of the pressure distri­bution is the same as the original airfoil and again the relative shape of the pressure dis­tribution is identical. The same pressure act­ing on the half-size surface would reduce all aerodynamic forces to one-half that of the original. This similarity of flow patterns means that the stagnation point occurs at the same place, the peak suction pressure occurs at the same place, and the actual magnitude of the aerodynamic forces and moments depends upon the airstream dynamic pressure and the surface area. This concept is extremely im­portant when attempting to separate and ana­lyze the most important factors affecting the development of aerodynamic forces.

AIRFOIL TERMINOLOGY. Since the shape of an airfoil and the inclination to the airstream are so important in determining the pressure distribution, it is necessary to properly define the airfoil terminology. Figure 1.10 shows a typical airfoil and illustrates the various items of airfoil terminology
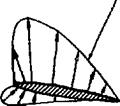
(1) The chord line is a straight line connect­ing the leading and trailing edges of the airfoil.

DEVELOPMENT OF AERODYNAMIC FORCES

DEVELOPMENT OF AERODYNAMIC FORCES

Figure 1.10. Airfoil Terminology

Подпись: Revised January 1965

(2) The chord is the characteristic dimen­sion of the airfoil.

(3) The mean-camber line is a line drawn halfway between the upper and lower sur­faces. Actually, the chord line connects the ends of the mean-camber line.

(4) The shape of the mean-camber line is very important in determining the aerody­namic characteristics of an airfoil section. The maximum camber (displacement of the mean line from the chord line) and the loca­tion of the maximum camber help to define the shape of the mean-camber line. These quantities are expressed as fractions or per­cent of the basic chord dimension. A typi­cal low speed airfoil may have a maximum camber of 4 percent located 40 percent aft of the leading edge.

(3) The thickness and thickness distribu­tion of the profile are important properties of a section. The maximum thickness and location of maximum thickness define thick­ness and distribution of thickness and are expressed as fractions or percent of the chord. A typical low speed airfoil may have a. maximum thickness of 12 percent located 30 percent aft of the leading edge.

(6) The leading edge radius of the airfoil is the radius of curvature given the leading edge shape. It is the radius of the circle centered on a line tangent to the leading edge camber and connecting tangency points of upper and lower surfaces with the leading edge. Typi­cal leading edge radii are zero (knife edge) to 1 or 2 percent.

(7) The lift produced by an airfoil is the net force produced perpendicular to the rela­tive wind.

(8) The drag incurred by an airfoil is the net force produced parallel to the relative wind.

(9) The angle of attack is the angle between the chord line and the relative wind. Angle of attack is given the shorthand notation a (alpha). Of course, it is important to dif-

I ferentiate between pitch attitude angle and

angle of attack. Regardless of the condi­tion of flight, the instantaneous flight path of the surface determines the direction of the oncoming relative wind and the angle of attack is the angle between the instantaneous relative wind and the chord line. To respect the definition of angle of attack, visualize the flight path of the aircraft during a loop and appreciate that the relative wind is defined by the flight path at any point dur­ing the maneuver.

Notice that the description of an airfoil profile is by dimensions which are fractions or percent of the basic chord dimension. Thus, when an airfoil, profile is specified a relative shape is described. (Notb: A numerical sys­tem of designating airfoil profiles originated by the National Advisory Committee for Aero­nautics [NACA] is used to describe the main geometric features and certain aerodynamic orooerties. NACA Report No. 824 will pro­vide the detail of this system.)

BERNOULLI’S PRINCIPLE AND SUBSONIC AIRFLOW

All of the external aerodynamic forces on a surface are the result of air pressure or air fric­tion. Friction effects are generally confined to a. thin layer of air in the immediate vicinity of the surface and friction forces are not the pre­dominating aerodynamic forces. Therefore,

ICAO STANDARD ATMOSPHERE [1]

ALTITUDE

FT.

density

RATIO

O’

ІТ-

PRESSURE

RATIO

8

TEMPER­

ATURE

"F

TEMPER­

ATURE

RATIO

в

SPEED

OF

SOUND

a

KNOTS

KINEMATIC

VISCOSITY

V

FT^SEC

0

t.0000

1.0000

1.0000

59.00

1.0000

661.7

.000158

IOOO

0.971 1

0.9854

0.9644

55.43

0.9931

659.5

.000161

2000

09428

0.9710

0 9298

51 .87

0 9862

657.2

.000165

3000

0.9151

0.9566

0.8962

48.30

0.9794

654.9

.000169

4000

0.8881

0.9424

0.8637

44.74

0.9725

652.6

.000174

5000

0.8617

0.9283

0.8320

41.(7

0.9656

650.3

.000178

6000

0.8359

0.9143

0.8014

37.60

0.9587

647.9

.000182

7000

0.8106

0.9004

0.7716

34.04

0.9519

645.6

.000187

8000

0.7860

0.8866

0.7428

30.47

0.9450

643.3

.000192

9000

0.7620

0.8729

0.7148

26.90

0.9381

640.9

.000197

10000

0.7385

0-8593

0.6877

23.34

0.9312

638.6

.000202

15000

0.6292

0.7932

0.5643

5.51

0.8969

626.7

.000229

20000

0.5328

0.7299

0.4595

—12.32

0.8625

614.6

.000262

25000

0.4481

0.6694

0.3711

-30.15

0.8281

602.2

.000302

30000

0.3741

0.6117

0.2970

-47.98

0.7937

589 5

,000349

35000

0.3099

0.5567

0.2353

-65.82

0.7594

576.6

.000405

* 36089

0.2971

0.5450

0.2234

-69.70

0.7519

573.8

.000419

40000

0.2462

0.4962

0.1851

-69.70

0.7519

573.8

.000506

45000

0.1936

0.4400

0.1455

-69,70

0.7519

573.8

.000643

50000

0.1522

0.3902

0.1 145

-69.70

0.7519

573.8

.000818

55000

0.1 197

0.3460

0.0900

-69.70

0.7519

573.8

.001040

60000

‘ 0.0941

0.3068

0.0708

-69.70

0.7519

573.8

.001323

65000

0.0740

0.2721

0.0557

-69.70

0.7519

573.8

.001682

70000

0.0582

0.2413

0.0438

-69.70

0.7519

573.8

.002139

75000

0.0458

0.2140

0.0344

-69.70

0.7519

573.8

.002721

80000

0.0360

0.(897

0.0271

-69.70

0.7519

573.8

.003460

85000

0.0280

0.1673

0.0213

-64.80

0.7613

577.4

.004499

90000

0.0217

0.1472

0.0168

-56.57

0.7772

583.4

.00591

95000

0.0169

0.1299

0.0134

-48.34

0.7931

589.3

.00772

100000

0.0132

0.1149

0.0107

-40.11

0.8089

595.2

.01004

Подпись: K.E. ft.3 K.E.

the pressure forces created on an aerodynamic surface can be studied in a simple form which at first neglects the effect of friction and vis­cosity of the airflow. The most appropriate means of visualizing the effect of airflow and the resulting aerodynamic pressures is to study the fluid flow within a closed tube.

Suppose a stream of air is flowing through the tube shown in figure 1.2. The airflow at station 1 in the tube has a certain velocity, static pressure, and density. As the airstream approaches the constriction at station 2 certain changes must take place. Since the airflow is enclosed within the tube, the mass flow at any point along the tube must be the same and the velocity, pressure, or density must change to accommodate this continuity of flow.

BERNOULLI’S EQUATION. A distin­guishing feature of subsonic airflow is that changes in pressure and velocity take place with small and negligible changes in density. For this reason the study of subsonic airflow can be simplified by neglecting the variation of density in the flow and assuming the flow to be incompressible. Of course, at high flow speeds which approach the speed of sound, the flow must be considered as compressible and “compressibility effects” taken into account. However, if the flow through the tube of figure 1.2 is considered subsonic, the density of the airstream is essentially constant at all sta­tions along the length.

If the density of the flow remains constant, static pressure and velocity are the variable quantities. As the flow approaches the con­striction of station 2 the velocity must increase to maintain the same mass flow. As – the velocity increases the static pressure will de­crease and the decrease in static pressure which accompanies the increase in velocity can be verified in two ways:

(1) Newton’s laws of motion state the requirement of an unbalanced force to pro­duce an acceleration (velocity change). If the airstream experiences an increase in veloc­ity approaching the constriction, there must
be an unbalance of force to provide the ac­celeration. Since there is only air within the tube, the unbalance of force is provided by the static pressure at station 1 being greater than the static pressure at the constriction, station 2.

(2) The total energy of the air stream in the tube is unchanged. However, the air – stream energy may be in two forms. The airstream may have a potential energy which is related by the static pressure and a kinetic energy by virtue of mass and motion. As the total energy is unchanged, an increase in velocity (kinetic energy) will be accompa­nied by a decrease in static pressure (poten­tial energy). This situation is analagous to a ball rolling along a smooth surface. As the ball rolls downhill, the potential energy due to position is exchanged for kinetic energy of motion. If friction were negli­gible, the change of potential energy would equal the change in kinetic energy. This is also the case for the airflow within the tube. The relationship of static pressure and veloc­ity is maintained throughout the length of the tube. As the flow moves past the constriction toward station 3, the velocity decreases and the static pressure increases.

The Bernoulli equation for incompressible flow is most readily explained by accounting for the energy of the airflow within the tube. As the airstream has no energy added or sub­tracted at any point, the sum of the potential ^rid kinetic energy must be constant. The kinetic energy of an object is found by: K. E.^’AMV*

where K.£. = kinetic energy, ft.-lbs. M=mass, slugs V= velocity, ft./sec.

The kinetic energy of a cubic foot of air is:

where = kinetic energy per cu. ft., psf p=air density, slugs per cu. ft. H^air velocity, ft./sec.

BERNOULLI’S PRINCIPLE AND SUBSONIC AIRFLOW

I

I

BERNOULLI’S PRINCIPLE AND SUBSONIC AIRFLOW


H e p + q

■■ –


PE + KE » CONSTANT Figure 1.2. AirflowWithin a Tube


BERNOULLI’S PRINCIPLE AND SUBSONIC AIRFLOW

If the potential energy is represented by the static pressure, p, the sum of the potential and kinetic energy is the total pressure of the air – stream.

H=p+%PV*

where H = total pressure, psf (sometimes re­ferred to as “head” pressure) p — static pressure, psf. p = density, slugs per cu. ft.

V= velocity, ft./sec.

This equation is the Bernoulli equation for incompressible flow. It is important to ap­preciate that the term y2pV2 has the units of pressure, psf. This term is one of the most important in all aerodynamics and appears so frequently that it is given the name “dynamic pressure” and the shorthand notation “q" ■ q=dynamic pressure, psf = %pV*

With this definition it could be said that the sum of static and dynamic pressure in the flow tube remains constant.

Figure 1.3 illustrates the variation of static, dynamic, and total pressure of air flowing through a closed tube. Note that the total pressure is constant throughout the length and any change in dynamic pressure produces the same magnitude change in static pressure.

The dynamic pressure of a free airstream is the one common denominator of all aero­dynamic forces and moments. Dynamic pres­sure represents the kinetic energy of the free airstream and is a factor relating the capability for producing changes in static pressure on a surface. As defined, the dynamic pressure varies directly as the density and the square of the velocity. Typical values of dynamic pres­sure, q, are shown in table 1-1 for various true airspeeds in the standard atmosphere. Notice that the dynamic pressure at some fixed veloc­ity varies directly with the density ratio at any altitude. Also, appreciate the fact that at an altitude of 40,000 feet (where the density ratio, <r, is 0.2462) it is necessary to have a true air velocity twice that at sea level in order to product the same dynamic pressure.

TABLE 1-1. Effect of Speed and Altitude on Dynamic Pressure

Velocity

(knots)

True air speed

(ft./sec.)

Dynamic pressure, qy psf

Sea level

10,000

ft.

20,000

ft.

30,000

ft.

40,000

ft.

tr =

1.000

0.7385

0.5328

0.3741

0.2462)

100

169

33.9

25.0

18.1

12.7

8.4

200

338

135.6

100.2

72.3

50.7

33.4

300

507

305

225

163

114

75.0

400

676

542

400

269

203

133

500

845

847

625

451

317

208

600

1,013

1, 221

902

651

457

300

where j= dynamic pressure, psf

p=air density, slugs per cu. ft.

K=air velocity, ft. per sec. or £=.00339<rV“

where a= density ratio

V – true velocity, knots

0.00339= constant which allows use of knots as velocity units and chc altitude density ratio ati alternate form is

£=—2 (0.00339=™’)

q 295 295/

AIRSPEED MEASUREMENT. If a sym­metrically shaped object were placed in a moving airstream, the flow pattern typical of figure 1.4 would result. The airstream at the very nose of the object would stagnate and the relative flow velocity at this point would be zero. The airflow ahead of the object pos­sesses some certain dynamic pressure and ambient static pressure. At the very nose of the object the local velocity will drop to zero and the airstream dynamic pressure will be converted into an increase in static pressure at the stagnation point. In other words, there will exist a static pressure at the stagnation point which is equal to the airstream total pressure—ambient static pressure plus dynamic pressure.

Around the surface of the object the airflow will divide and the local velocity will increase from zero at the stagnation point to some maximum on the sides of the object. If fric­tion and viscosity effects are neglected, the

BERNOULLI’S PRINCIPLE AND SUBSONIC AIRFLOW

AFT STAGNATION POINT


BERNOULLI’S PRINCIPLE AND SUBSONIC AIRFLOW

FORWARD STAGNATION
POINT

AIRSTREAM AHEAD
HAS AMBIENT STATIC
PRESSURE AND DYNAMIC
PRESSURE

STAGNATION PRESSURE
IS AIRSTREAM TOTAL
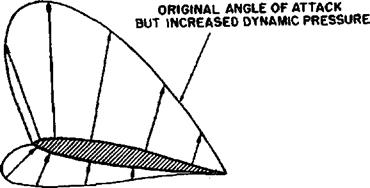
PRESSURE

P+Q

Figure 1.4. Flow Pattern on a Symmetrical Object


surface airflow continues to the aft stagnation point where the local velocity is again zero. The important point of this example of aero­dynamic flow is existence of the stagnation point. The change in airflow static pressure which takes place at the stagnation point is equal to the free stream dynamic pressure, q.

The measurement of free stream dynamic pressure is fundamental to the indication of airspeed. In fact, airspeed indicators are sim­ply pressure gauges which measure dynamic pressure related to various airspeeds. Typical airspeed measuring systems are illustrated in figure 1.5. The pitot head has no internal flow velocity and the pressure in the pitot tube is equal to the total pressure of the airstream. The purpose of the static ports is to sense the true static pressure of the free airstream. The total pressure and static pressure lines are attached to a differential pressure gauge and the net pressure indicated is the dynamic
pressure, q. The pressure gauge is then cali­brated to indicate flight speed in the standard sea level air mass. For example, a dynamic pressure of 305 psf would be realized at a sea level flight speed of 300 knots.

Actually there can be many conditions of flight where the airspeed indicator does not truly reflect the actual velocity through the air mass. The corrections that must be applied are many and listed in sequence below:

(1) The indicated airspeed (IAS) is the actual instrument indication for some given flight condition. Factors such as an altitude other than standard sea level, errors of the instrument and errors due to the installation, compressibility, etc. may create great vari­ance between this instrument indication and the actual flight speed.

(2) The calibrated airspeed (CAS) is the result of correcting IAS for errors of the

PITOT-STATIC SYSTEM PITOT WITH SEPARATE

Подпись: STATIC PRESSURE, H-p = q

STATIC SOURCE

Figure. 1.5. Airspeed Measurement


instrument and errors due to position or lo­cation of the installation. The instrument error must be small by design of the equip­ment and is usually negligible in equipment which is properly maintained and cared for. The position error of the installation must be small in the range of airspeeds involving critical performance conditions. Position errors are most usually confined to the static source in that the actual static pressure sensed at the static port may be different from the free airstream static pressure. When the aircraft is operated through a large range of angles of attack, the static pressure distribution varies quite greatly and it becomes quite difficult to minimize the static source error. In most instances a compensating group of static sources may be combined to reduce the position error. In order to appreciate the magnitude of this problem, at flight speed near 100 knots a

0. 05 psi position error is an airspeed error of 10 knots. A typical variation of air­speed system position error is illustrated in figure 1.6.

(Ъ) The equivalent airspeed (EAS) is the result of correcting the (CAS) for compressi­bility effects. At high flight speeds the stagnation pressure recovered in the pitot tube is not representative of the airstream dynamic pressure due to a magnification by compressibility. Compressibility of the airflow produces a stagnation pressure in the pitot which is greater than if the flow were incompressible. As a result, the air­speed indication is given an erroneous mag­nification. The standard airspeed indicator is calibrated to read correct when at standard sea level conditions and thus has a com­pressibility correction appropriate for these conditions. However, when the aircraft is operating above standard sea level altitude,

імміїміїимміігттмітіїн-жштніпііііішшниіімттіннжн**

100 200 300 400 500 600

CALIBRATED AIRSPEED, KNOTS

TYPICAL POSITION ERROR CORRECTION

BERNOULLI’S PRINCIPLE AND SUBSONIC AIRFLOW


Подпись: AIRSPEED AIRSPEED POSITION COMPRESSIBILITY CORRECTION ERROR CORRECTION ДVC, KNOTS AV і, К NOTS

COMPRESSIBILITY CORRECTION

BERNOULLI’S PRINCIPLE AND SUBSONIC AIRFLOW


25,000


20,000


Ї

c

ч

A


15,000


Подпись: DENSITY ALTITUDE-FT.

10,000


4

A

КО

О


5000


,JO


> z S2 > n <

>% m ™ я т»

О о -<

z СО

І?

n g

«л О


-5000


BERNOULLI’S PRINCIPLE AND SUBSONIC AIRFLOW

Подпись:

condition.

(4) The true airspeed (TAS) results when the EAS is corrected for density altitude. Since the airspeed indicator is calibrated for the dynamic pressures corresponding to airspeeds at standard sea level conditions, variations in air density must be accounted for. To relate EAS and TAS requires con­sideration that the EAS coupled with stand­ard sea level density produces the same dy­namic pressure as the TAS goupled with the

л лАіч л 1 л > и J ЛЛ 11 4 4- тт – rtf А rt /-«<4 d ( f < rsr*

All UL. llblt}’ A/A UUU.

From this reasoning, it can be shown that:

(TASyP = (EASy p о

or, TAS=EAS.

J-

V p

TAS= EAS

l

Vff

where TAT=true airspeed

EAS= equivalent airspeed p = actual air density Po = standard sea level air density <r = altitude density ratio, p/p0

The result shows that the TAS is a function of EAS and density altitude. Figure 1.6 shows a chart of density altitude as a function of pressure altitude and temperature. Each par­ticular density altitude fixes the proportion between TAS and EAS. The use of a naviga­tion computer requires setting appropriate values of pressure altitude and temperature on the scales which then fixes the proportion be­tween the scales of TAS and EAS (or TAS and CAS when compressibility corrections are applicable).

Thus, the airspeed indicator system measures dynamic pressure and will relate true flight velocity when instrument, position, compress­ibility, and density corrections are applied. These corrections are quite necessary for ac­curate determination of true airspeed and accurate navigation.

Bernoulli’s principle and the concepts of static, dynamic, and total pressure are the basis of aerodynamic fundamentals. The pressure distribution caused by the variation of local static and dynamic pressures on a surface is the source of the major aerodynamic forces and moment.

BASIC AERODYNAMICS

In order to understand the characteristics of his aircraft and develop precision flying tech­niques, the Naval Aviator must be familiar with the fundamentals of aerodynamics. There are certain physical laws which describe the behavior of airflow and define the various aerodynamic forces and moments acting on a surface. These principles of aerodynamics pro­vide the foundations for good, precise flying techniques.

WING AND AIRFOIL FORCES

PROPERTIES OF THE ATMOSPHERE

The aerodynamic forces and moments acting on a surface are due in great part to the prop­erties of the air mass in which the surface is operating. The composition of the earth’s atmosphere by volume is approximately 78 percent nitrogen, 21 percent oxygen, and 1Подпись: density ratio £ Po a percent water vapor, argon, carbon dioxide, etc. For the majority of all aerodynamic con­siderations air is considered as a uniform mixture of these gases. The usual quantities used to define the properties of an air mass are as follows:
STATIC PRESSURE. The absolute static pressure of the air is a property of primary importance. The static pressure of the air at any altitude results from the mass of air supported above that level. At standard sea level conditions the static pressure of the air is 2,116 psf Cor 14.7 psi, 29-92 in. Hg, etc.) and at 40,000 feet altitude this static pressure decreases to approximately 19 percent of the sea level value. The shorthand notation for the ambient static pressure is “p” and the standard sea level static pressure is given the subscript "0" for zero altitude, p0. A more usual reference in aerodynamics and perform­ance is the proportion of the ambient static pressure and the standard sea level static pressure. This static pressure ratio is assigned the shorthand notation of 8 (delta).

Altitude pressure ratio

_____ Ambient static pressure

Standard sea level static pressure

5 = p/po

Many items of gas turbine engine perform­ance are directly related to some parameter involving the altitude pressure ratio.

TEMPERATURE. The absolute tempera­ture of the air is another important property. The ordinary temperature measurement by the Centigrade scale has a’datum at the freezing point of water but absolute zero temperature is obtained at a temperature of —273° Centi­grade. Thus, the standard sea level tempera­ture of 15° C. is an absolute temperature of 288°. This scale of absolute temperature using the Centigrade increments is the Kelvin scale, e. g., 0 K. The shorthand notation for the ambient air temperature is “T” and the stand­ard sea level air temperature of 288° K. is signified by T0. The more usual reference is
the proportion of the ambient air temperature and the standard sea level air temperature. This temperature ratio is assigned the short­hand notation of в (theta).

Temperature ratio

Ambient air temperature ""Standard sea level air temperature e=T/r0 „ C°+273

Many items of compressibility effects and jet engine performance involve consideration of the temperature ratio.

DENSITY. The density of the air is a prop­erty of greatest importance in the study of aerodynamics. The density of air is simply the mass of air per cubic foot of volume and is a direct measure of the quantity of matter in each cubic foot of air. Air at standard sea level conditions weighs 0.0765 pounds per cubic foot and has a density of 0.002378 slugs per cubic foot. At an altitude of 40,000 feet the air density is approximately 25 percent of the sea level value.

The shorthand notation used for air density is p (rho) and the standard sea level air density is then po. In many parts of aerodynamics it is very convenient to consider the proportion of the ambient air density and standard sea level air density. This density ratio is assigned the shorthand notation of cr (sigma).

, . . ambient air density

ensity ratio stan(jar(j sea level air density

<r = p/po

A general gas law defines the relationship of pressure temperature, and density when there is no change of state or heat transfer. Simply stated this would be "density varies directly with pressure, inversely with temperature." Using the properties previously defined,

_ pressure ratio temperature ratio

-да

=&/e


BASIC AERODYNAMICS

This relationship has great application in aerodynamics and is quite fundamental and necessary in certain parts of airplane perform­ance.

VISCOSITY. The viscosity of the air is important in scale and friction effects. The coefficient of absolute viscosity is the propor­tion between the shearing stress and velocity gradient for a fluid flow. The viscosity of gases is unusual in that the viscosity is gen­erally a function of temperature alone and an increase in temperature increases the viscosity. The coefficient of absolute viscosity is assigned the shorthand notation ц (mu). Since many parts of aerodynamics involve consideration of viscosity and density, a more usual form of viscosity measure is the proportion of the co­efficient of absolute viscosity and density. This combination is termed the “kinematic viscosity” and is noted by v (nu).

kinematic viscosity

coefficient of absolute viscosity
density

v = n/p

The kinematic viscosity of air at standard sea level conditions is 0.0001576 square feet per second. At an altitude of 40,000 feet the kinematic viscosity is increased to 0.0005059 square foot per second.

In order to provide a common denominator for comparison of various aircraft, a standard atmosphere has been adopted. The standard atmosphere actually represents the mean or average properties of the atmosphere. Figure 1.1 illustrates the variation of the most im­portant properties of the air throughout the standard atmosphere. Notice that the lapse rate is constant in the troposphere and the stratosphere begins with the isothermal region.

Since all aircraft performance is compared and evaluated in the environment of the stand­ard atmosphere, all of the aircraft instrumenta­tion is calibrated for the standard atmosphere.

Thus, certain corrections must apply to the instrumentation as well as the aircraft per­formance if the operating conditions do not fit the standard atmosphere. In order to prop­erly account for the nonstandard atmosphere certain terms must be defined. Pressure altitude is the altitude in the standard atmosphere corresponding to a particular pressure. The aircraft altimeter is essentially a sensitive barometer calibrated to indicate altitude in the standard atmosphere. If the altimeter is set for 29-92 in. Hg the altitude indicated is the pressure altitude—the altitude in the stand­ard atmosphere corresponding to the sensed pressure. Of course, this indicated pressure altitude may not be the actual height above sea level due to variations in temperature, lapse rate, atmospheric pressure, and possible errors in the sensed pressure.

The more appropriate term for correlating aerodynamic performance in the nonstandard atmosphere is density altitude—the altitude in the standard atmosphere corresponding to a particular value of air density. The computa­tion of density altitude must certainly involve consideration of pressure (pressure altitude) and temperature. Figure 1.6 illustrates the manner in which pressure altitude and tem­perature combine to produce a certain density altitude. This chart is quite standard in use and is usually included in the performance section of the flight handbook. Many subject areas of aerodynamics and aircraft performance will emphasize density altitude and temperature as the most important factors requiring con­sideration.

AVIATORS

The purpose of this textbook is to present the elements of applied aerodynamics and aeronautical engineering which relate directly to the problems of flying operations. All Naval Aviators possess a natural interest in the basic aerodynamic factors which affect the performance of all aircraft. Due. to the increasing complexity of modern aircraft, this natural interest must be applied to develop a sound understanding of basic engineering principles and an appreciation of some of the more advanced problems of aerodynamics and engineering. The safety and effectiveness of flying operations will depend greatly on the under­standing and appreciation of how and why an airplane flies. The principles of aerodynamics will provide the foundations for developing exacting and precise flying techniques and operational procedures.

The content of this textbook has been arranged to provide as com­plete as possible a reference for all phases of flying in Naval Aviation. Hence, the text material is applicable to the problems of flight train­ing, transition training, and general flying operations. The manner of presentation throughout the text has been designed to provide the elements of both theory and application and will allow either directed or unassisted study. As a result, the text material will be applicable to supplement formal class lectures and briefings and provide reading material as a background for training and flying operations.

Much of the specialized mathematical detail of aerodynamics has been omitted wherever it was considered unnecessary in the field of flying operations. Also, many of the basic assumptions and limita­tions of certain parts of aerodynamic theory have been omitted for the sake of simplicity and clarity of presentation. In order to contend with these specific shortcomings, the Naval Aviator should rely on the assistance of certain specially qualified individuals within Naval Avia­tion. For example, graduate aeronautical engineers, graduates of the Test Pilot Training School at the Naval Air Test Center, graduates of the Naval Aviation Safety Officers Course, and technical representatives of the manufacturers are qualified to assist in interpreting and applying the more difficult parts of aerodynamics and aeronautical engineering. To be sure, the specialized qualifications of these individuals should be utilized wherever possible.

NAVWEPS 00-80T-80 PREFACE

The majority of aircraft accidents are due to some type of error of the pilot. This fact has been true in the past and, unfortunately, most probably will be true in the future. Each Naval Aviator should strive to arm himself with knowledge, training, and exacting, professional attitudes and techniques. The fundamentals of aerodynamics as pre­sented in this text will provide the knowledge and background for safe and effective flying operations. The flight handbooks for the air­craft will provide the particular techniques, procedures, and operating data which are necessary for each aircraft. Diligent study and continu­ous training are necessary to develop the professional skills and tech­niques for successful flying operations.

The author takes this opportunity to express appreciation to those who have assisted in the preparation of the manuscript. In particular, thanks are due to Mr. J. E. Fairchild for his assistance with the por­tions dealing with helicopter aerodynamics and roll coupling phenom­ena, Also, thanks are due to Mr. J. F. Detwiler and Mr. E. Dimitruk for their review of the text material.

’ Hugh Harrison Hurt, Jr.

August 1959

University of Southern California

Los Angeles. Calif.

— * О > ‘

CHAPTER I: BASIC AERODYNAMICS


9