Category BASIC AERODYNAMICS

Aerodynamic Efficiency

Hoerner defined the aerodynamic efficiency as the following ratio:

П aero= aerodynamic efficiency = -^йіі (9.2)

where the useful drag is the part that is either useful (as in the induced drag) or necessary (or unavoidable). For the Bf-109G, the result is naero = 0.4, or 40 per­cent. This indicates that “greater than half the total drag of this airplane could theoretically be avoided by extremely clean design and faultless construction of the skin and details.” However, the amount of labor and time (and, therefore, expense) to accomplish this would be significant. What Hoerner described is typ­ical of the concentration on drag reduction used in the design and construction of world-class, high-performance sailplanes. Such efforts result in high costs due to the required labor-intensive procedures. For example, a competitive racing-class (i. e., 15 meter span with camber-changing flaps) sailplane can cost more than $150,000.

Hoerner demonstrated that if the Bf-109 were to be redesigned such that the ratio of “useful” to total drag were to be increased to unity, the top speed would increase from 610 to 800 km/hr! The benefit of such a speed increase in terms of the mission of this fighter is obvious. However, we always must ask the question: How much does it cost to reduce the drag? Clearly, in the case of the Bf-109G, the

answer was apparently “too much.” The aircraft performance was increased over its service life mainly by increases in engine horsepower, although minor improve­ments resulted from drag reduction. For example, the tail struts, squared wing tips, and large undercowl radiator found in earlier versions of the Messerschmitt 109 were modified to lower the drag to the levels demonstrated herein for the G version.

Empennage (Tail Surfaces) Drag Area

The horizontal (i. e., outside the fuselage) and vertical tail-surface areas are 25 and 11 ft2, respectively. Again assuming the rough camouflage paint, the skin – friction drag coefficient is estimated to be Cf = 0.004. Correcting for the thick­ness effect, the gaps at the control-surface hinge lines, and the interference drag at the junctions between the fuselage and the tail surfaces, the total parasite drag area for the empennage is:

(D/q)empennage = 0.360 ft2.

parasite

Because the horizontal tail produces lift at some trim conditions (usually nega­tive lift in high-speed flight), a correction for induced drag is necessary. It is small because the lift coefficient needed to accomplish the required downward trim force is small. An estimate is:

(D/q)empennage = 0.010 ft2.

induced

Therefore, the total empennage-drag area is approximately 0.370 ft2.

Summary of BF-109G Drag Calculation; Comparison to Measured Drag

If the various estimated drag-area terms are summed, the total contributions to the overall airplane drag are as fo. llows:

overall parasite – drag area = (D/ q)parasite = 5.277 overall induced – drag area = (D / q)induced = 0.430

Total airplane – drag area = (D /g)total = 5.707

The results are shown graphically in Figure 9.3. The total estimated drag area based on the assumption of incompressible flow is somewhat lower than the value of 6.2 deduced from actual level-flight performance data. Why is there a discrepancy? It appears that every possible drag contribution was taken into account. Hoerner explained this in terms of compressibility effects. Notice that at 22,000 ft., the speed of sound is 295 m/s (try using the standard atmosphere program to verify this), so that the flight Mach number under these conditions is about:

MM = 0.58,

which indicates that conditions clearly are pushing the upper bound of the subsonic approximation. Hoerner estimated by means of the Prandtl-Glauert compress­ibility correction (Liepmann and Roshko, 2001) that there should be about a 10 per­cent drag increase because of compressibility, which accounts for the discrepancy between the calculated and measured drag results. The results show that the aerody­namic performance for a complete airplane with all of its imperfections realistically can be predicted if care is taken with all of the details. A student who wants to learn this process should examine Hoerner’s book even though it may seem dated; it is

Empennage (Tail Surfaces) Drag Area Empennage (Tail Surfaces) Drag Area
Подпись: Figure 9.3. Drag summary for Bf-109G.

difficult to find a better summary of the practical approach to drag estimation. If this is supplemented with modern information covering the high-speed (i. e., high – subsonic, transonic, supersonic, and hypersonic) flight regimes, then a powerful performance-prediction tool can be devised. Such tools are an important design resource in the aerospace industry. Each company and government laboratory has preferred methods for carrying out analyses such as we reviewed herein.

Drag Due to Lift

The methods used in Chapter 6 are applicable here. The lift coefficient for level, unaccelerated flight follows directly from the information in Table 9.1 because the lift must equal the weight. We find:

W

CL = W = 021.

L qS

Then, the induced-drag coefficient is found from:

Подпись:C CL (0.21)2

CDi KeAR n(0.98)5.8

where the effective AR was reduced by Hoerner from 6.1 to 5.8 to account for planform losses related to the wing-tips shape. Thus, the drag area representing the induced drag is:

(drag area)mduced = CDiS = 0.42 ft2.

Adjustment of the AR represents an unusual method for handling the effect of the planform shape. The departure from the ideal (i. e., elliptic) lift distri­bution usually is accounted for entirely by the efficiency factor, e. Hoerner used a value of 0.98, which appears too large—although it may have been the value for which the designers were striving. If the actual AR is used in the formula

and the efficiency factor is adjusted (assuming that the final calculated induced – drag coefficient is correct), then we find that e should be 0.93. This seems to be in reasonable agreement with values of span efficiency based on the work of Glauert and others for straight-tapered wings with rounded tips.

1. Wing Contribution to Parasite Drag

Parasite drag on the wing is the sum of the profile drag, skin friction, drag due to flow separation in various gaps (i. g., around the landing-gear fairings), and sur­face imperfections (e. g., protruding rivet and bolt heads). The drag areas for each is summarized in Table 9.2. In estimating the skin-friction drag, Hoerner noted that the sheet-metal gaps behind the leading-edge slats (which opened automati­cally at low speed to improve stalling characteristics) render the boundary-layer flow fully turbulent. He also indicated that the camouflage paint used for these aircraft exhibited a roughness height on the order of 1 mil. With this in mind, he then estimated that the skin-friction drag coefficient is Cf = 0.0035, which is considerably larger than an estimate (0.0028) assuming a smooth surface with a Re number of 1.1 x 10⁷. The projected surface area of the part of the wing out­side of the fuselage is adjusted by a factor of 1.28 to account for the influence of the wing-section thickness. These considerations lead to the skin-friction drag area shown in the table. Most of the table entries are based on drag data from wind-tunnel tests simulating each type of drag source or surface imperfection. Hoerner’s book is a useful compendium of such data, with practical techniques for application in drag estimation.

2. Fuselage Drag

In estimating the skin friction drag, the boundary layer is assumed to be every where turbulent due to the propeller slipstream. Again, the rough cam­ouflage-paint surface is taken into account. This yields a skin-friction coefficient of Cf = 0.0025. Account also must be taken of various appendages, as listed in Table 9.3.

The fuselage wetted area is 250 ft2, so the basic drag area for the fuselage is 0.625 ft2. This must be adjusted to account for rivet and bolt heads and the dynamic-pressure increase along the fuselage sides (Hoerner multiplied the result by 1.07 to account for this). Therefore, the adjusted drag area is 1.75 ft2, as shown in Table 9.3.

A various “appendages” must be accounted for in the drag estimate. Table 9.3 shows the estimates for the canopy, tail wheel, and antenna components. The canopy has numerous edges around the window panes so that the drag of the canopy is almost double that of the same shape without these irregularities. Again, the estimates are based on wind-tunnel studies of many different shapes. A correction must be added to account for the increase in dynamic pressure because the fuselage flow field is within the slipstream of the propeller. Hoerner estimated that there is a 10 percent increase in q, as indicated in Table 9.3.

3. Engine Installation Drag

Some of these effects are due to fuselage appendages and usually are included with the fuselage drag; others are additions to the wing drag. Hoerner chose to include them in a detailed estimate of the drag caused by the various air scoops for the radiators and oil coolers, as well as exhaust stacks needed for the engine installation, as tabulated in Table 9.4. The high-drag contribution from the two

Table 9.2. Contributions to Bf-109G wing pvarasite drag (Hoerner, 1993.)

Drag Source

Drag Area, ft2

Wing skin friction (turbulent, rough surface)

1.350

Surface imperfections common to both upper and lower surfaces:

Aileron gaps

0.018

Aileron hinges

0.030

Aileron balance weights

0.027

Side gaps on slots

0.090

Side gaps at ailerons and flaps

0.030

Pitot-static tube

0.010

Position lights at wing tips

0.002

Upper-wing side blisters

0.020

Holes around landing gear

0.140

Subtotal

0.367

Upper-wing surface imperfections:

0.011 (1.16)*

0.013

Lower-wing surface imperfections:

Lateral sheet-metal edges (29 ft)

0.013

Lateral surface gaps (36 ft)

0.038

Longitudinal sheet edges (50 ft)

0.001

Bolt heads (500)

0.004

Flush rivet heads (3,500)

0.002

Sheet-metal blisters (e. g., over cannons.)

0.007

Subtotal

0.075(1.42)*

0.107

Additional skin friction due to surface imperfections:

0.090

Total Wing-Parasite Drag Area:

1.927

* Factors in parentheses are corrections for dynamic pressure on upper and lower-wing surfaces above the freestream reference value.

wing-mounted radiators, according to Hoerner, is due to “poor aerodynamic design and considerable internal leakage.” Much work was accomplished more recently by NACA (and later NASA), as well as the aircraft industry, in reducing drag of air intakes, motivated mainly by the advent of jet propulsion. Compress­ibility effects are important in the design process for high-speed flight.

Table 9.3. Contributions to Bf-109G fuselage-parasite drag (Hoerner, 1993)

Drag Source

Drag Area, ft2

Fuselage skin friction (based on wetted area)

0.750

Fuselage appendages:

Canopy

0.120

Tail wheel

0.290

Antenna mast

0.030

Antenna wires, etc.

0.030

Direction finder

0.050

Gun installation

0.030

Other irregularities

0.080

Subtotal

0.630

Wing/fuselage interference

0.220

Total

1.600

Correction for increase in dynamic pressure due to propeller slipstream (q

is 10 percent higher

on

fuselage and wing fillets); therefore, multiply 1.6 by 1.1=1.75

Total Fuselage-Parasite Drag Area:

1.750

Table 9.4. Contributions to Bf-109G engine-installation drag

Drag Source

Drag Area, ft2

Engine appendages:

Fuselage appendages:

Carburetor air scoop

0.067

Intake momentum drag

0.080

Exhaust stacks

0.056

Oil cooler

0.168

Ventilation openings

0.100

Wing radiators

0.660

Subtotal

1.131

Correction for increase in dynamic pressure due to propeller slipstream (q higher on engine parts); therefore, multiply 1.131 X 1.1 = 1.24

is 10 percent

Total Engine-Installation Drag Area:

1.240

Equivalent Drag Area

Hoerner use the drag area as a convenient means to represent the relative drag of the various airplane components. These are summed at the end of the analysis to determine overall drag. It is necessary to understand that this sum must include corrections to account for the interference drag created by the influence of one element on another. An important source of such drag is the interference between the fuselage and the wing. The smooth fairing, or fillet, at the juncture of the fuselage and wing of the Bf-109 was intended to reduce this drag contribution to a practical minimum. Drag area is defined as:

(drag areaX = D = (CdS )i, (9.1)

where q is the dynamic pressure, Di is the drag of the component i, and S is an appro­priate reference area. Notice that depending on the component, different reference areas may be used. When working with aerodynamic surfaces such as the wing and empennage, the planform area almost always is used. For other parts, the projected frontal area often is used. Thus, use of this drag area combines the area and the related drag coefficient in a way that prevents errors in applying the results in a sum­mation to determine the complete vehicle drag.

In defining the overall drag, the usual convention is to use the projected wing area, S, as the reference. S is the area found by extending the wing planform to the fuselage centerline. Hoerner stated that the maximum speed of the 1944 Bf-109G was 610 km/hr (380 mph) at an altitude of about 22,000 feet. This corresponds to an effective dynamic pressure of:

The thrust of the Daimler Benz DB605 (i. e., 12-cylinder, inverted “V” engine) plus the jet thrust from the ejector exhaust stacks was about 1,140 lbf. Therefore, because the drag is equal to the thrust in unaccelerated level flight, the overall drag area of the Bf-109G was:

(drag area)total =£ (QS); = 6.2 ft2.

i

Because the projected wing area (S = 172 ft2 for the Bf-109G) usually is used in describing the overall aerodynamic performance, the resultant overall drag coefficient is CD = 0.036 at the stated flight condition. We follow Hoerner in com­piling a breakdown of all drag sources that contribute to this total. It is important to follow the analysis, because many of the concepts developed in previous chapters are reviewed and an understanding of the capabilities as well as the limitations of the analysis are demonstrated. Will careful application of all that has been learned give a total drag area in fair agreement with the one from experimental flight data? We shall now proceed to find out.

Drag and Lift Estimation on an Actual Airplane

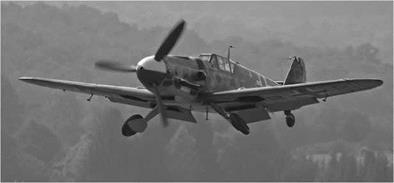
We consider what must be done to predict the aerodynamic performance of a flight vehicle that operates in the subsonic speed range (e. g., a World War II fighter). The Messerschmitt Bf-109G, shown in Fig. 9.2, was subjected to a long period of aerodynamic and powerplant refinement during its operational history. What we review briefly here is an elegant analysis by the famous aerodynamicist, Dr. Sighard Hoerner, who was involved in the refinement and testing of the Bf-109 in Germany in the 1940s (Hoerner, 1993).

To achieve a realistic assessment of the drag, it is clear that we must include the following:

• skin friction and profile drag on the fuselage

• skin friction and profile drag on the wing and tail surfaces

• induced drag

• drag due to surface imperfections such as bolt heads, rivet heads, sheet-metal blis­ters housing cannon components, aileron gaps, gaps around landing-gear wells, Pitot tube mounting, and sheet-metal lap joints and edges.

• drag of engine components such as air scoop, exhaust stacks, oil cooler, wing radi­ators, and ventilation openings

• interference drag due to tail wheel, antenna mast, canopy, and gun installation

Drag and Lift Estimation on an Actual Airplane

Figure 9.2. Messerschmitt Bf-109G.

Table 9.1. Messerschmitt Bf-109G aerodynamic configuration

Total wing area

S = 172 ft2

Wing span

b = 32 ft

Aspect ratio

AR = 6.1

Overall length

1 = 29 ft

Gross weight

W = 6,700 lbf

Wing loading

W/S = 39 lbf/ft2

Maximum cruising speed

V max = 610 km/hr

Maximum power (at 22,000 ft)

P = 1,200 hp

The various contributions usually are separated into two groups: those directly due to the production of lift (i. e., the induced drag) and those not associated with the production of lift (i. e., the parasite drag). As we analyze the Bf-109G, we carefully distinguish between, these two types of drag. This is not always an easy task, because clearly, the tail surfaces and even the fuselage may contribute to the generation of lift.

Only the high-speed configuration with the landing gear and flaps retracted is considered here. To fully evaluate the performance and other qualities of the aircraft, other configurations covering the entire speed range must be analyzed similarly. For example, the configuration needed for landing or takeoff, with the flaps and landing gear deployed, involves an additional set of drag elements and related assumptions. We begin by examining the drag characteristics of the Bf-109G. Table 9.1 describes the aerodynamic configuration of this aircraft for high-speed flight at operational altitude.

Experimental Verification of Lift and Drag on a Flight Vehicle

It should be clear from this discussion that predicting the behavior of the flow field and the resulting forces and moments for a complete flight vehicle using analytical or computational models is an involved process. The time may not be far off when this can be accomplished by fully three-dimensional computations on supercom­puters. However, even if this were possible, there still would be the need to verify the results by actual testing of the vehicle. Consider that in such testing, many environ­ments must be represented. That is, to fully map out the aerodynamic performance, it is necessary to cover a range of speeds, fluid densities, and possibly even atmos­pheric temperatures that are compatible with design specifications and intended use of the vehicle.

Several methods are used to verify predictions made by application of analytical and computational models. Those most often used are as follows:

• Wind-tunnel testing using scale models or, when possible, the full-sized vehicle

• Full-scale (or scale-model) flight testing

Testing of models or even the full-scale vehicle in a wind tunnel (i. e., for flight or land vehicles) or a water channel or basin (i. e., for watercraft) is a routine part of the design procedure. The tests provide direct verification of the predictions but usually also introduce an additional set of unknowns. For example, was the test carried out with full static and dynamic similarity to the full-scale prototype? That is, in addition to a precise representation of the geometry, are the Re numbers and Mach-number ranges appropriate? Other similarity parameters such as the Froude number also must be matched in some cases (e. g., testing of boats).

To see how important such questions may be, we examine the sensitivity of the airfoil measurements in Chapter 5 to the test Re numbers. It is clear that this type of testing may provide confidence in our predictions, but it does not completely verify them.

The second method—testing with a full-scale prototype of the vehicle in the intended operational environment—is often considered the only truly reli­able verification method. However, many uncertainties still must be addressed in interpreting test results. For example, in flight testing, we must ask questions such as: Were the test instruments properly calibrated? Were atmospheric dis­turbances such as turbulence present that would influence the test data? Was there a patina of squashed insects layering the leading edges? And so on, ad infinitum.

Prediction of Lift and Drag on a Flight Vehicle

We treat aerodynamic forces as though they could be separate entities acting on various components, such as wings and bodies. For example, we show that the drag on a wing consists of several parts, including profile drag contributed by the pressure forces over the surfaces; skin-friction drag due to viscous interactions on the sur­faces; and induced drag, which largely is due to three-dimensional effects involving vortices produced near the wing tips in the process of lift generation. It is implied that when these effects act in unison, our estimates can be combined in a simple, linearly additive way to determine the characteristics of the complete aerodynamic assembly. However, it is not clear that these models are dependable when the wing is attached to a fuselage or when nacelles containing engines, fuel, or external stores are attached to the wing. Is there some type of mutual influence or interference among the components? What happens if the surfaces are degraded by the presence of rivet heads or lap joints in the skin? What happens if the tail surfaces lie in the wake of the wing? What changes in the flow-field results when a propulsion system is operating? What happens if turbulent eddies from a separated flow in one component enter the otherwise laminar flow on another? There is a seemingly endless list of such ques­tions: Some were adequately addressed in the past in a practical manner; some await satisfactory resolution.

We now must ask questions regarding the application of basic aerodynamic ana­lyses of the type presented in this textbook to a complete aircraft or watercraft (i. e., a boat or submarine) or, perhaps, even ground vehicles. Such questions immediately invoke specialized answers; generalities are difficult to make. However, we attempt to set the stage for the student’s further studies in this important area. A short but useful bibliography is included to aid in the process of reducing the basics to a form that can be applied in solving real problems.

The Main Assumption

We now emphasize a key assumption made in deriving all of these important results: The flow field is incompressible; density variations are ignored. This asumption may not seem important until we realize that it leads to strict limitations in the domain of applicability of the results herein, especially in terms of speed range of an aero­dynamic vehicle. We put these limitations in perspective by examining the speeds of various common flight vehicles with the object of determining which classes of vehicles are governed by the analyses carried out to this point.

We show in previous chapters that aerodynamic performance often can be described in terms of the cost in drag associated with the production of lift. Lift is the main output of the aerodynamic system and it is used directly in countering gravitational forces, thereby rendering atmospheric flight possible. We demon­strate in Chapter 1 that a useful figure-of-merit for aerodynamic performance is the L/D ratio.

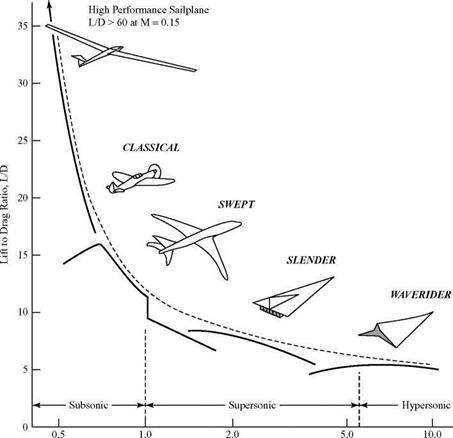
Consider the effect of speed on the achievable L/D ratio by an optimally designed flight vehicle. Figure 9.1 is a typical presentation of such information. The horizontal axis covers speeds from the lowest possible (corresponding perhaps to a man-powered aircraft) to the highest velocities for atmospheric flight vehicles that may nearly reach the speed required for earth orbit. The Mach number (i. e., dimensionless speed) is used to reflect the velocity on the horizontal axis because it directly reflects the importance of compressibility.

Several useful observations should be apparent on inspection of Fig. 9.1. The first is that there is a definite optimal aerodynamic configuration associated with each speed range. We classify those in the manner suggested by Kuchemann. It may be disappointing to see that all of our labors are applicable only in the lower part of the subsonic speed range (i. e., to “classical” airplane configurations) and appropriate only in the speed range up to approximately 400 mph (640 km/hr). We refer to this as the speed range for the classical aircraft-design configuration because, indeed, it is the earliest and most common type and still absorbs a major effort by aircraft designers.

For emphasis, it is crucial to understand that the aerodynamic models devel­oped thus far apply only to low speeds (i. e., up to about 600 km/hr)—that is, to flight Mach numbers less than, say, 0.6. The aerodynamic performance of a classical airplane shape falls off drastically at higher speeds, and it may not even be capable of stable flight due to shifting of the center of pressure as compressibility effects become important. It is clear, then, that there is much to accomplish if we are to understand the design process for high-speed aircraft. Fortunately, as demonstrated for the low-speed range, there exists a multitude of powerful simplifying assump­tions and “ingenious abstractions and approximations” of the type we already use up to this point for incompressible flows.

The Main Assumption

Flight Mach Number, M (logarithmic scale) Figure 9.1. Effect of flight Mach number on aircraft performance.

It remains to explain in more detail how we can use what we have learned in the pre­diction of performance and in the practical analysis and design of efficient, classical flight vehicles. Many of these applications of aerodynamics qualify for textbooks in their own right; therefore, only an introduction is possible here. The subjects of vehicle performance, stability and control, and so on, most often are treated in separate courses. Students will find in their study of those subjects that a thorough understanding of the aerodynamic principles examined herein is indispensable. Stu­dents may find it useful as we start this discussion to review Chapter 1 to examine the photographs and descriptions of classical subsonic aircraft.

Incompressible Aerodynamics: Summary

Подпись: 9It is now becoming clear that it is also mistaken to assume that computers could pro­duce optimum designs in an empirical manner: it cannot be carried out in practice.

D. Kuchemann “The Aerodynamic Design of Aircraft” Pergamon Press, 1978

9.1 Introduction

The preceding eight chapters take wholesale advantage of the assumption that the flow field for low-speed flight is incompressible. This allows considerable sim­plification in the formulation of the governing equations and in the solution of key aerodynamic problems. However, results of the calculations are limited in an important way that is emphasized in this summary chapter. What we attempt to do here is:

0. Summarize the most important elements of the first eight chapters.

1. Demonstrate how the results are incorporated in actual vehicle design.

2. Define the limits of application of the results.

Modeling of Airflows

What is accomplished to this point is the application of basic fluid mechanics in con­structing detailed models for the airflow over aerodynamic surfaces (e. g., wings and bodies) at speeds low enough that compressibility effects do not seriously affect the results. These models are intended to provide accurate estimates of the aerodynamic forces and moments needed in solving the basic problem of aerodynamics as it was defined in Chapter 1. Although there is much discussion centered on the application of modern computational tools, for the most part, we rely on simplified mathemat­ical representations. We try to emphasize the role of valid, simplifying assumptions in arriving at useful representations for the airflow. As Kuchemann described the pro­cess in his famous book on the aerodynamic design of aircraft (Kuchemann, 1978), “. . . the most drastic simplifying assumptions must be made before we can even
think about the flow of gases and arrive at equations which are amenable to treat­ment. Our whole science lives on highly idealized concepts and ingenious abstrac­tions and approximations.” First-class examples of this approach are demonstrated in this book, including Prandtl’s elegant models describing the creation of lift by an airfoil, three-dimensional wing theory, and boundary-layer flows. These provide the backbone of the subject of aerodynamics.

Turbulent Flow

A fully developed turbulent boundary layer is a region of large-scale velocity fluctu­ations (i. e., up to 10 percent fluctuations about a mean value). The flow is chaotic and irregular. Thus, although the external mean flow at the outer edge of the boundary layer is steady, the boundary-layer flow is unsteady. There is no chance—even with modern computers—of being able to predict the turbulent-flow behavior at a fixed point in the boundary layer as a function of time. However, experiments have shown that the turbulent fluctuations in the boundary layer are random, so that a time – averaged approach may be used. Thus, we focus on being able to predict what hap­pens “on the average” at a point within the turbulent boundary layer. As in the laminar-boundary-layer problem, our goal is to be able to predict the growth and velocity profile of an incompressible, turbulent boundary layer. To accomplish this, the first step is to derive the appropriate differential equations and then seek solu­tions for them.

Time-Averaged Boundary-Layer Equations

We could begin by developing the time-averaged Navier-Stokes equations and then apply the boundary-layer approximations (i. e., d/x << 1, and so on). However, we choose instead to derive the time-averaged, boundary-layer equations of continuity and momentum directly from the laminar-boundary-layer equations. As before, we use an airfoil coordinate system (x, y, z), where x is the streamwise direction, y is the transverse direction, and z is normal to the surface. Based on experimental measure­ments, it is assumed that the turbulent flow is characterized by random fluctuations about a mean. Thus, we let:

U = U + u’; V = V + v’; W = W + w’, (8.120)

where:

U ^ instantaneous velocity

U ^ mean velocity

u’ ^ turbulent fluctuation,

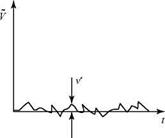
and so on. Now, if a fast-response instrument were used to measure the instan­taneous velocity components at a fixed point in a two-dimensional boundary layer, the output would look like Fig. 8.32, which recognizes that in a two-dimensional flow, the transverse mean velocity, V, is zero (although the fluctuations in the transverse direction are not).

Because the velocity fluctuations are random, a mean-velocity component in any direction may be defined as the integral of the instantaneous velocity com­ponent over a time interval t = T, where T is a long-enough interval so that the value of the integral is independent of time. Thus,

U = — J Udt and U = – J u ‘dt = 0, (8.121)

Turbulent Flow

T 0 T 0

Подпись: WПодпись:Turbulent Floww

t

W

jL

Turbulent Flow Подпись: (8.122)

where the bar over the u’ denotes a time average. Likewise, V = 0 and W = 0 These equations are stating that, because there is an equal likelihood that U is positive or negative at any instant, a summing of the value of U over a long time interval T is zero. However, the time average of the squares of the velocity fluctuations (to appear later in the boundary-layer equations) is not zero; in fact, it is positive. This follows if we imagine that at each instant of time, the value of u is measured and the value squared. Whether u’ is instantaneously positive or negative, the square is posi­tive and the sum of the squared quantities over time is not be zero. Thus,

Be careful when writing (or reading) the time-averaged notation. Thus,

u’2 Ф u’2.

The time average of the cross-products of velocity fluctuations in general is not zero. However, in a two-dimensional boundary layer:

Подпись:T

Подпись: T(8.123)

0 (a fact that is needed later), whereas:

u’v’ = v’ w’ = 0.

Подпись: (a) Turbulent Flow Подпись: a + b.

Before proceeding to time-average the defining boundary-layer equations, the following rules are needed, which follow from the definition of mean value. If A is a mean quantity, a and b are fluctuating quantities, and t is any Cartesian or time coordinate, then:

___ — t — T

Подпись: (b)

Подпись: (c) Turbulent Flow Подпись: da э!. Подпись: (8.124)

Aa = t j (Aa)dt = (A t j (a)dt = Aa.

We proceed now to substitute instantaneous velocity components into the laminar boundary-layer equations for continuity and x-momentum, Eq. 8.37, with the steady – flow velocity components (u, w) in Eq. 8.37 replaced by the instantaneous velocity components (U, W). Because the flow now is unsteady, a d/dt term must be added to the steady-flow momentum equation in Eq. 8.37. If the velocity field within the boundary layer is unsteady, then pressure fluctuations must exist as well. Thus, we also replace the steady pressure p by the instantaneous pressure p = P + p’, where P is the mean value of the pressure and p’ is the pressure fluctuation. As with the velocity fluctuations, p’ = 0 . Finally, because the flow is incompressible, r = constant. Then, Eq. 8.37 becomes:

We now time-average these two equations over a suitably long time interval T so that the equations reflect what is happening in the boundary layer on the average. The process begins by taking the average of both sides of each equation; that is, Eqs. 8.118 and 8.120 are rewritten with an overbar above each side. Then, by appealing to Eq. 8.117a, the two sides are expanded and then decomposed into the time average of each term. Thus,

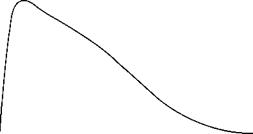
the control volume (left side) is equal to the net pressure and viscous forces acting on the control surface (right side). In this equation, the time-averaged momentum flux is that due to mean velocity (first term on the left side) and fluctuating velo­cities (second term on the left side). Now, say that there is a change in the pressure and viscous forces that leads to an increase in overall momentum flux. Any corre­sponding increase in the momentum flux due to velocity fluctuations must reduce the effect of the force change on the time-averaged momentum flux due to the mean velocities. Thus, the turbulence term has the same role as a stress; namely, it tends to extract momentum associated with the mean flow. The turbulence-momentum term in Eq. 8.124 then is moved conventionally to the other side of the equation and considered as a stress. It is called an apparent stress or a Reynolds stress. Be careful: The term (ри’и/) is physically not a stress; however, mathematically, it is considered to play the role of a stress. The term (pu’w’) is an apparent shear stress. The term

(ри2) neglected in Eq. 8.12 is an apparent normal stress. As in the molecular – viscosity case studied previously, the apparent normal stress is negligible compared to the apparent shear stress.

Rewriting Eq. 8.121 and moving the apparent shear-stress term in Eq. 8.124 to the right side, the turbulent boundary-layer equations are:
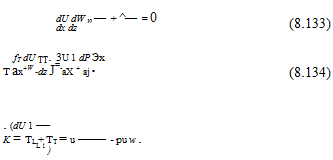
Подпись:where:

In turbulent flows, tt >> tl, except near the surface, where tt approaches zero.

Inspection of Eqs. 8.125 and 8.126 shows that the solution of these equations is problematic. There now is an extra unknown, pu’ w’, with no information on how to find it. Unfortunately, it is not a property of the fluid but rather a property of the turbulence. Hence, we expect this unknown to have different values within the boundary layer (Fig. 8.33) and also for different turbulent shear flows (e. g., for a boundary-layer flow and for a free-shear layer). Specifying the turbulent-shear – stress term is called the closure problem, meaning that it must be modeled empiri­cally. This is discussed, when solutions are addressed.

Turbulent Flow Подпись: 2 p Подпись: u'2 + v'2 + w'2 Подпись: (8.135)

A final comment on the turbulent boundary layer: The mean turbulent kinetic energy per unit volume in the boundary layer is defined as:

Large-scale eddies in the boundary layer extract kinetic energy from the freestream. This kinetic energy becomes increasingly more randomly distributed as it is trans­ferred to increasingly smaller eddies. Ultimately, it is dissipated as thermal energy (i. e., heat) at the molecular level.

У

Подпись: 0s

The quality of the freestream flow in a “low-turbulence” wind tunnel often is defined as the magnitude of the freestream turbulent intensity,

Turbulent FlowTurbulent Flow

Подпись: Uw'
Подпись: Figure 8.33. Variation of turbulent shear stress through a turbulent boundary layer.

(8.136)

If a wind tunnel is to be used for turbulence research, the turbulent intensity of the

freestream flow in the test section should be only a few hundredths of 1 percent.