Category Dynamics of. Atmospheric Flight

RESPONSE TO ELEVATOR INPUT

For the conventional case of cruising flight of airplanes, (5.14,2) can be used for the response to elevator by setting ДQT^ = 0. We shall first make some simplifying assumptions, i. e. that ocr = 0, that the reference flight path is horizontal, soye = 0, and that all oiGDV, GLV, GmV, Gj^ are negligible. It is assumed further that deflecting the elevator can change the lift and moment, but not the drag, so that ACDc = 0, ACLc = Gj^ Ade and AGmc = Gmi Ad„. Then (5.14,2) reduces to

(10.2,1)

Подпись:The aerodynamic transfer functions on the r. h.s well enough by (see Sec. 5.14)

= °LS

Подпись:G/iia ‘ ■ Gma “I – sGm^

and Gm-a is furthermore frequently neglected.

Подпись: P Подпись: Ad, Подпись: (10.2,3)

Let the 4×4 matrix on the l. h.s. of (10.2,1) be denoted P. Then (10.2,1) may be compactly written

RESPONSE TO ELEVATOR INPUT
Подпись: (10.2,5)

The above elements of G do not exhaust the transfer functions of interest. Other response quantities may be wanted—for example, the flight-path angle and the normal load factor. The former is given by у = в — a, so that

Gyd = Ова ~ &*а (10-2,7)

The latter (see Sec. 6.10) is

L

n = —

W

and is unity in the reference condition. The perturbation in n is

An = — = — (ACL + 2Gl AV) (10.2,8)

wcWe L L*

to first order. ACL is conveniently expressed in terms of the state variables as

= glv AF + 6La Да + djJ[ + GLSA6e

RESPONSE TO ELEVATOR INPUT Подпись: An Me Подпись: -L [{GLV + 2CL)GVS + dLxGaS + <M«+ ёы] (io.2,9) bwe

After substituting in the Laplace transform of (10.2,8), and dividing by A6e we get

The preceding equations can be used directly for machine computation of frequency response functions, which basically requires only routine operations on matrices with complex coefficients; an example of this appli­cation is given below. However, for analysis one needs the literal expressions for the various transfer functions, and in some applications one must also find their inverse (the impulse response functions). This is not a practical analytical procedure for the complete system, even with the simplified equation (10.2,1). For obtaining exact solutions for the impulse response or step response, the preferred method is to solve the original differential equations on a digital or analog computer. For analytical work associated with control system design, approximate forms of the transfer functions may be quite useful (refs. 9.4 and 9.5).

We can find approximate transfer functions by using the short-period and phugoid approximations given in Sec. 9.2 as a guide. These would be expected to be useful for inputs whose spectral representations are limited to certain frequency bands appropriate to the mode in question.

LATERAL CONTROL

The lateral controls (the aileron and rudder) on a conventional airplane have three principal functions.

1. To provide trim in the presence of asymmetric thrust associated with power plant failure.

2. To provide corrections for unwanted motions associated with atmos­pheric turbulence or other random events.

3. To provide for turning maneuvers—i. e. rotation of the velocity vector in a horizontal plane.

The first two of these purposes are served by having the controls generate aerodynamic moments about the x and z axes—rolling and yawing moments. For the third a force must be provided that has a component normal to V and in the horizontal plane. This is, of course, the component L sin ф of the lift when the airplane is banked at angle ф. In the equation of motion this appears as the sin ф term in (5.9,6). Thus the lateral controls (principally the aileron) produce turns as a secondary result of controlling ф.

Ordinarily, the long-term responses to deflection of the aileron and rudder are very complicated, with all the lateral degrees of freedom being excited by each. Solution of the complete equations of motion is the only way to appreciate these fully. Certain useful approximations of lower order are however available.

LONGITUDINAL CONTROL

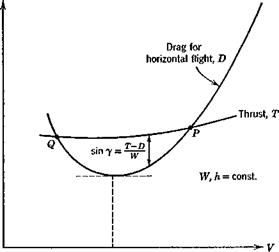
The two principal quantities that need to be controlled in symmetric flight are the speed and the flight-path angle, that is to say, the vehicle’s velocity vector. To achieve this obviously entails the ability to apply control forces both parallel and perpendicular to the flight path. The former is provided by thrust or drag control, and the latter by lift control via elevator deflection or wing flaps. It is evident from simple physical reasoning (or from the equations of motion) that the main initial response to opening the throttle (increasing the thrust) is a forward acceleration, i. e. control of speed. The main initial response to elevator deflection is a rotation in pitch, with subsequent change in angle of attack and lift, and hence the development of y, a rate of change of flight-path angle. When the transients that follow such control actions have ultimately died away, the new steady state that results can be found in the conventional way used in performance analysis. Fig. 10.1 shows the basic relations. The steady speed V at which the airplane flies is governed by the lift coefficient, which is in turn fixed by the elevator angle—see (6.4,13). Hence a constant 6e implies a fixed V. The flight-path angle у at any given speed is determined, as shown in Fig. 10.1, by the thrust. Thus the ultimate result of moving the throttle at fixed elevator angle (when the thrust line passes through the C. G.) is a change in у without change in speed. But we saw above that the initial response to throttle is a change in speed—hence the short-term and long-term effects of this control are quite contrary. Likewise we saw that the main initial effect of moving the elevator is to rotate the vehicle and influence y, whereas the ultimate effect at fixed throttle is to change both speed and y. The short-term and long-term effects of elevator motion are therefore also quite different. The total picture of longitudinal control is clearly far from simple, and the transients that connect the initial and final responses require investigation. We shall see in the

LONGITUDINAL CONTROL

Fig. 10.1 Basic performance graph.

following that these are dominated by the long-period, lightly damped phugoid oscillation, and that the final steady state with step inputs is reached only after a long time. These matters are explored more fully in the following sections.

LONGITUDINAL CHARACTERISTICS OF A STOL AIRPLANE

The curves of Figs. 9.4 and 9.5 show that the characteristic modes of an airplane vary markedly with speed, i. e. with the equilibrium weight coefficient CWe. In particular, the two characteristic periods begin to approach one another as CWe becomes large. It is of interest to explore this range more fully by considering an STOL airplane, operating in the “powered-lift” region for which Cw may be much larger. To this end the data given in ref. 7.11, part of which is shown in Fig. 7.6, has been used to obtain a representative set of coefficients for 2.0 < Cff( < 5.0. The flight condition assumed is horizontal steady flight, so that C% = 0 (see Fig. 7.66). (The particular data used from the reference was that for the aircraft with a large tail in the high position, it = 0, and df = 45°.) From the given curves, and from cross-plots of the coefficients CL, CD, and Cm vs. GT at constant a, the data in Table 9.3 was derived for the equilibrium condition. Smooth curves were used for interpolation. Since this is not a tilt-wing airplane, aT is not large in the eases considered, and has been assumed to be zero.

Basic Data for STOL Airplane

Table 9.3

°we

GTe

CL

■Ьа

CD f

V

3CL

dCT

dCD

dCT

d(JT

2.0

0.53

5.75

1.19

.500

.705

.285

-.090

2.5

0.72

6.20

1.80

.475

.790

.328

-.070

3.0

0.90

6.65

2.41

.450

.875

.370

-.050

3.5

1.09

7.10

3.02

.424 .

.955

.411

-.030

4.0

1.28

7.55

3.63

.398

1.025

.450

-.010

4.5

1.46

8.00

4.24

.371

1.097

.488

+ .010

5.0

1.65

8.45

4.85

.346

1.165

.525

+ .030

%hn = .30 – CmJCLx

LONGITUDINAL CHARACTERISTICS OF A STOL AIRPLANE

Since aeroelastic and compressibility effects are negligible at the low speeds of STOL flight the required speed derivatives are given by (see Table 7.1)

For a propeller-driven airplane, the value of CTy is given by (7.8,6), and an examination of the data on ц for a typical constant-speed propeller at low speedf showed that (VJrje)(drildV)e is close to unity. Hence we have used GTy = —2GTe in this example.

Using the formulae of Table 7.1, the following estimates were made of the q and ot derivatives:

CLq=U, Gm<i = —17.9, = 5.5, <^=-13

Finally the following inertial and geometric characteristics were assumed:

W = 40,000 lb, S = 1000 ft2, A = 5.42, c = 13.60 ft H = 76.8, ly = 385, h = .30

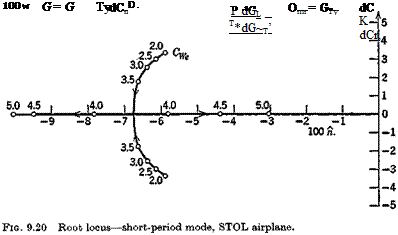
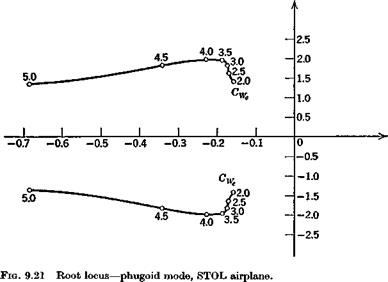
With the above data, the coefficients of the system matrix (9.1,1) were evaluated, and its eigenvalues and eigenvectors calculated. The main results are shown on Figs. 9.20 to 9.24. Figures 9.20 and 9.21 show the loci of the roots as Gw varies between 2 and 5. The effect of GWe is seen to be large on both modes, the short-period mode becoming nonoscillatory at a value of Cw somewhat greater than 3.5, and the damping of the phugoid increasing

f The De Havilland Buffalo airplane. .

loo 5

LONGITUDINAL CHARACTERISTICS OF A STOL AIRPLANE


LONGITUDINAL CHARACTERISTICS OF A STOL AIRPLANE

LONGITUDINAL CHARACTERISTICS OF A STOL AIRPLANE

LONGITUDINAL CHARACTERISTICS OF A STOL AIRPLANE

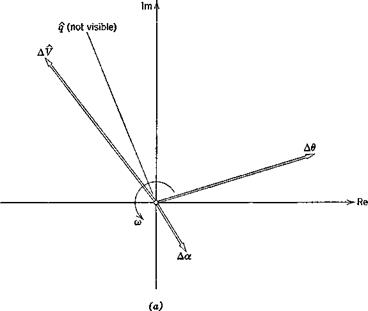
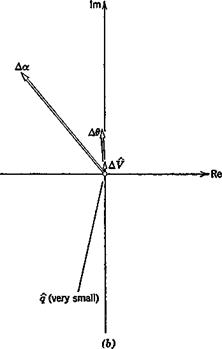
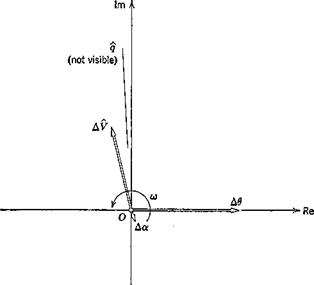
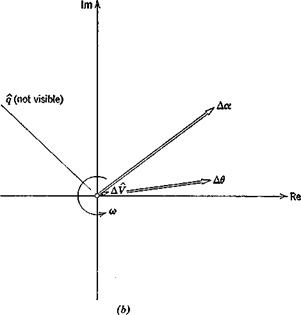
Fig. 9.24 (a) STOL airplane, vector diagram of phugoid mode. Gw — 3.5. (6) Short-

period mode. GWe = 3.5.

LONGITUDINAL CHARACTERISTICS OF A STOL AIRPLANE

Fig. 9.24 (Grntd.)

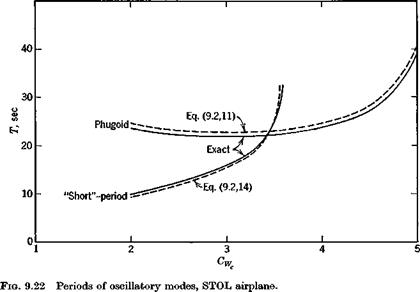
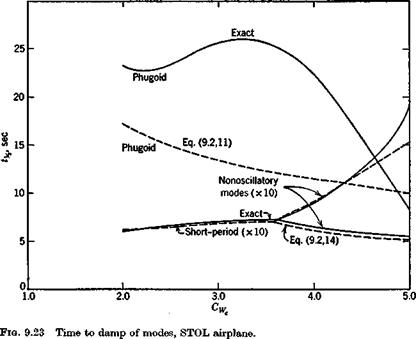
rapidly at the same time. Figure 9.22 shows the two periods, and that they actually cross over at Cw == 3.4. The concept of the phugoid as a “long” period oscillation is evidently not applicable in this situation! The approxi­mations (9.2,11) to the phugoid, and (9.2,14) to the pitching mode are also shown for comparison. It is seen that they give the two periods quite well, and that (9.2,14) also depicts quite accurately the damping of the pitching oscillation and of the two nonperiodic modes into which it degenerates at high GWf. The phugoid damping, however, is not at all well predicted by the approximate solution, and (9.2,9) gives even larger discrepancies for both period and damping. Figure 9.23 shows the damping times for the modes, and they are all seen to be heavily damped over the whole range.

The eigenvectors for the two modes are shown on Fig. 9.24 for GWe = 3.5, the condition of nearly equal periods. The relative configurations of the vectors are seen to be quite similar to those for the jet transport at Gw =1.8 (Fig. 9.6), but the magnitudes of Да in the phugoid, and Д^ in the short – period mode are appreciably larger.

Copyrighted Materials

Copyright © 2000 Dover Publications Retrieved from www knovel. com


From the system theory presented in Chapter 3 we see that it is convenient to classify vehicle motion according to whether it is free or forced. Chapter 9 was devoted to a discussion of a number of examples of the former, and in this chapter we give some illustrations of the latter. The particular cases studied here are those in which the motion results from nonautonomous actuation of the controls. That is, we exclude those in which the controls are moved in response to the vehicle motion in accordance with a prescribed law, as by an autopilot. Such motions are the subject matter of Chapter 11. We should recall as well that for linear/invariant systems (Sec. 3.4) there is really only one fundamental response problem The impulse response, the step response, and the frequency response are all explicitly related, and the convolution theorem (3.4,41) and (3.4,43) enables the response to any arbitrary control variation to he calculated from a knowledge of either the impulse response or the step response.

In the examples that follow, we consider the response of an airplane to actuation of its principal controls, the throttle and the three aerodynamic control surfaces. The examples include both step and frequency response, and both linear and nonlinear cases.

As shown in Chapter 3, the basic item needed for computing frequency

response, and for formulating response problems analytically is the transfer function that relates the relevant responses and inputs. In the present context the input is the control vector. The required transfer functions can be found either from the standard first-order form of the differential equations of motion, in which case they are given by (3.2,23), or from the Laplace transforms of the equations (5.11,8 to 10) or (5.14,1 to 3). There is an essential theoretical difference between the two methods, since the former implies the representation of the aerodynamic forces by means of aerodynamic derivatives, and the latter allows (but does not require) the use of exact linear aerodynamics (see Sec. 5.11). Practically, there is only a difference between the responses calculated by the two approaches when the aero­dynamic control surfaces are moved very rapidly.

EFFECT OF SPEED DERIVATIVES

In the preceding examples, all the speed derivatives except GTfr were assumed to be zero. Now speed effects are highly dependent on the con­figuration, and for subsonic airplanes result from both aeroelastic and com­pressibility effects. They vary widely from one vehicle to another, and can change rapidly with Mach number (implying that the small-disturbance theory is very restricted in that case). It is not therefore feasible to give

EFFECT OF SPEED DERIVATIVES

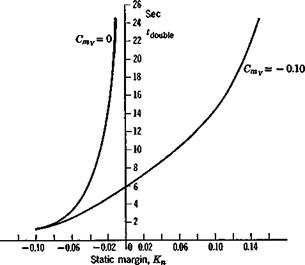
Fig. 9.19 Time to double of the divergent mode.

any generally useful results for speed effects. There is one point, however, which is worth exploring, and that is the effect of Gmp on the roots. Equation

(9.3,3) shows that this derivative can affect the static stability, negative values producing a reduction in the stability boundary hs [see (6.4,26)]. To illustrate this, the value of Cmp has been set equal to —.10 in (9.1,1) and the eigenvalues found for the same range of Kn as used in the previous example. This value of Gmp is quite representative of what may occur at high subsonic Mach number. The root loci obtained look much like those presented in Fig. 9.18. The short-period mode is changed only slightly, but the phugoid has an important difference; namely, the divergent branch DE crosses the axis at Kn = .20 instead of at zero. Thus there is an unstable divergence over the whole of the C. G. range used in the example. The nature of this divergence is seen in Fig. 9.19, which shows the time to double amplitude. The divergence associated with this value of Cm is not very rapid for reasonable design values of Kn, i. e. Kn > .03, for then double > 8 sec and the airplane would not be unmanageable. The unstable mode is one involving primarily the speed and flight-path angle (of opposite sign) so that it represents either a climb at increasing climb angle and decreasing speed, or a dive of increasing speed and dive angle. The latter is what was called a “compressibility dive” at the end of World War II. The nonlinear features rapidly take over control of these motions as Д7 increases. For the climb divergence, the reduction of speed and Mach number take the vehicle back toward the incompressible regime and a reduction in Cmy whereas the dive case leads to increasing M and possibly an aggravation of the divergence.

EFFECT OF STATIC MARGIN

It was indicated in Chapter 6 that the single most important aerodynamic characteristic for longitudinal stability is the pitch stiffness Gm^, and that it varies strongly with the C. G. position, i. e.

Gma = GfJh – hn)

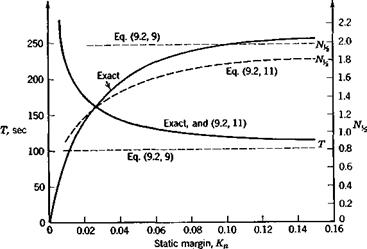
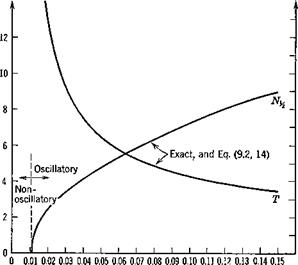
where the static margin is Kn = hn — h. The effect of this parameter is demonstrated by using (9.1,1) with variable Kn. The results for all other data the same as in Sec. 9.1 are shown on Figs. 9.16 to 9.19. Figure 9.16 shows that the phugoid period and damping vary rapidly at low static margin, and that the approximation (9.2,9), which does not include the effect of the pitch stiffness, is useful only at large Kn. Approximation (9.2,11), however, gives the trends with Kn quite well. The period goes to infinity, and Ni^ to zero at a value of Kn slightly greater than zero. Figure 9.17 shows the variation of the short-period roots. These too vary strongly with pitch stiffness, the mode becoming nonoscillatory at Kn slightly less than.01.

EFFECT OF STATIC MARGIN

Fig. 9.16 Variation of period and damping of phugoid mode with static margin.

0.26

Подпись:Подпись: NHПодпись:Подпись:EFFECT OF STATIC MARGIN0.24

0. 22

0. 20

0.18

0.16

0.14

0. 12

0.10

0.08

0.06

0.04

0.02

0

The approximation of (9.2,14) is seen to be excellent over the whole oscillatory range.

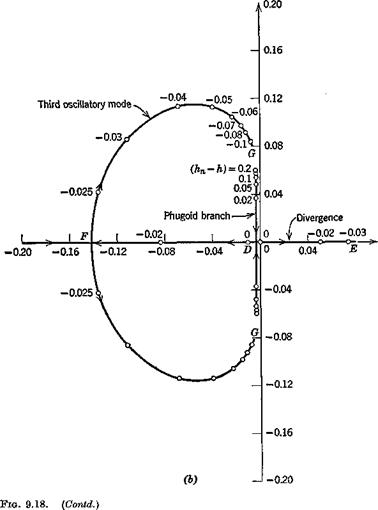
Additional insight into the behavior of the modes is obtained from the root-locus plots of Fig. 9.18. Figure 9.18a shows that the damping n of the short-period mode remains essentially constant as Kn decreases, while the fre­quency со decreases to zero at Kn between.01 and.02 (point A). The root locus then splits into a pair of real roots, branches A В and AG of the locus. These represent damped aperiodic modes, or subsidences. Figure 9.186 shows that the phugoid mode behaves similarly as the C. G. is moved backwards towards the neutral point. At point D, when the C. G. is just forward of the N. P., the oscillatory phugoid also degenerates into a pair of aperiodic modes, the branches DF and DE of the locus. DF is a subsidence and that portion of DE to the right of the origin represents a divergence—i. e. the airplane is statically unstable when Kn is negative.

The behavior of the roots is quite interesting for h > hn + .02. The branch AB of the short-period mode and the branch DF of the phugoid “collide” at F when the C. G. is between 2 and 2|-% of c behind the N. P. A new oscil­latory mode then appears corresponding to the branches FG of the locus. This is a stable oscillation whose damping and period are intermediate between those of the two parent modes. The eigenvector for this mode shows that all three degrees of freedom Д F, Да, Дв are significantly excited, and
hence there is no simple approximation to it. Since the range of C. G. positions in which this mode occurs is that for which there is already one unstable root (DE), it is of academic interest only.

It was shown in Sec. 9.3 that the criterion for static stability is (9.3,3). The calculations presented in Fig. 9.186 verify this conclusion, since in the example Cmy = 0 and the criterion reduces to Kn > 0. When the C. G. is aft of the N. P. the rate of divergence of the unstable mode is as shown in Fig. 9.19 (curve for Cmy = 0). The time to double rapidly decreases with decreasing Kn to values-too short to be manageable

100 w

EFFECT OF STATIC MARGIN

EFFECT OF VERTICAL DENSITY-GRADIENT

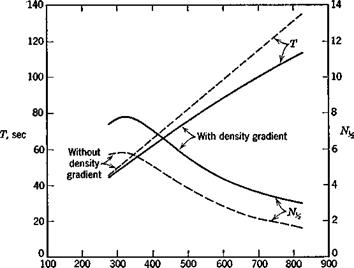
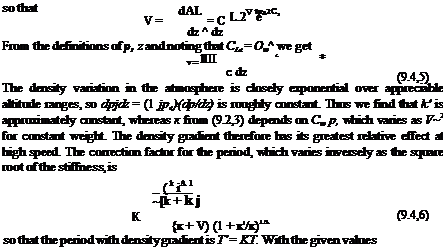
The effect of the vertical gradient in atmospheric density on the char­acteristic modes of horizontal flight was first discussed by Scheubel (ref. 9.1), and later in more detail by Neumark (ref. 9.2) and Walkowicz (ref. 9.3). Their principal conclusions were that the short-period motion is unchanged by the density gradient, but that the phugoid period is appreciably shortened by an amount that increases with speed. Neumark also pointed out that the characteristic equation for this case is of the fifth degree and that the extra root is a small one corresponding to the tendency of the vehicle to seek or depart from its equilibrium altitude, depending on whether or not the root is negative. Neumark concluded, based on examples in which the thrust was independent of height, that the damping of the phugoid was unaffected by dp/dz. In fact, the phugoid damping is very sensitive to the thrust law, and as shown in the example that follows, in which Toe pso that C’2,_ = 0 (a reasonable approximation for jet engines), the damping can be very much reduced at all speeds by the density gradient. Before proceeding to the numerical solutions of the complete equations however, it is instructive to present Scheubel’s extension of the simple Lanchester analysis of the phugoid period. In Sec. 9.2 we saw that with Lanchester’s approximations there is a vertical “spring stiffness” к given by (9.2,3) that governs the period. When the density varies there is a second “stiffness” k’ resulting from the fact that the increased density when the vehicle is below its reference altitude increases the lift, and vice versa. This incremental lift associated with a density change is

Д£ = Cl§V2S Др

EFFECT OF VERTICAL DENSITY-GRADIENT

of к and k’ this becomes


(9.4,7)


EFFECT OF VERTICAL DENSITY-GRADIENT

in which the principal variable is seen to be the speed, occurring in the form of the Froude’s number (V*jgc)- The reduction in phugoid period predicted by (9.4,7) for the example airplane is 14% at 500 mph, which is very close to the exact result of 13% (Fig. 9.14).

In order to provide a complete comparison with the approximation based on constant density, we use the fifth-order system (5.13,18) to make numerical calculation for the same conditions as hold in Figs. 9.4 and 9.5. All the z derivatives CT, Cn_, CL, Cmz have been assumed to he zero, and the only density-gradient effects are embodied in the dpjdz terms. Note that CTz = 0 implies a propulsion system in which the thrust is proportional to p. With all the assumptions that pertain to this example explicitly incorporated, the system matrix is

EFFECT OF VERTICAL DENSITY-GRADIENT

Ve, fps

Fig. 9.14 Effect of density gradient on phugoid characteristics. Altitude 30,000 ft.

The value of dp/dz was obtained from the tables for the U. S. Standard Atmosphere (ref. 9.14) as follows:

dp _ 1 c dp _ c d log p (g 4 9)

dz pe2 dz 2 dh

where h is the altitude. From the tabulated data, d log pjdh at about 30,000 ft altitude is found to be —4.16 X 10~5 and hence dp/dz = f(15.40)(4.16)10~5 = .000320. With this value, the eigenvalues of (9.4,8) have been calculated for the same range of speeds as used in Figs. 9.4 and 9.5. The short-period mode is found to he unchanged to three significant digits, in agreement with Neumark, the phugoid damping and period are both altered, and a new stable nonoscillatory mode of long time constant appears. Figure 9.14 shows the quite substantial effects on the phugoid. It is clear from these graphs that neglect of atmospheric density gradient can lead to considerable error. This is especially significant with respect to the damping since the constant-density approximation gives unconservative results.

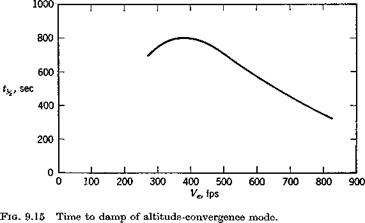
The fifth root of the characteristic equation is negative, corresponding to a stable subsidence. Its characteristic time, plotted on Fig. 9.15, is seen to be very long. This mode is related to the weak tendency of the vehicle to fly at its equilibrium altitude (note that there is no preferred altitude in the constant-density case). The eigenvector of this mode for Ve = 561 mph

EFFECT OF VERTICAL DENSITY-GRADIENT

is found to Ъе Д1^:Да:$:&6:zB = —.161 x 10~s:.187 x 10—7: — .398 x 10~9: .199 x 10_4:1 which shows that, like the phugoid, it is a mode with negligible Да and q. That is, it is an “arrow” mode, in which the vehicle axis is closely aligned with the velocity vector while it drifts slowly back to its equilibrium altitude. The principal degree of freedom is clearly zE. The relative magnitudes are a little deceptive however because of the small length (c/2) used to make zE nondimensional. For this vehicle, a decrease in altitude of 1000 ft in this mode would correspond to ДzE = 130 and a Д7 of —2%.

Подпись: з s EFFECT OF VERTICAL DENSITY-GRADIENT EFFECT OF VERTICAL DENSITY-GRADIENT Подпись: /д _ @тг @we 2/л dz) +  Tz 2 dzj 2fi2 Подпись: (9.4,10)

It is instructive to examine the approximation obtained by neglecting Да and the Gm equation, just as was done previously with the fourth-order system. For additional generality, to allow for other than jet engines, we retain the term СТг in the first equation. When the same procedure is followed as led to (9.2,9) the result is the cubic characteristic equation

When the thrust is independent of height and speed, as for a rocket engine, GTi is given by (7.12,1) as GTs = —GTe dp/dz and GTy = ~2GT^. The last term of (9.4,10) then disappears, one root is zero, and the remaining two are given by

Подпись:Gm

2/jl

Without the dp/dz term, this is exactly the phugoid approximation (9.2,9),

and the constant term can be identified exactly as the augmented “spring – constant” that led to (9.4,7)—note that the ratio of the last two terms is

G^dp = Vld_l

2pi dz ‘ 2p? gc d

It is clear that the approximation to the fifth root in this case is A = 0, and that the phugoid is changed only to the extent of the reduced period. The damping term CTyj2pt is unaffected by the presence of the density gradient. This is consistent with Neumark’s finding for examples in which T is constant.

EFFECT OF VERTICAL DENSITY-GRADIENT Подпись: (9.4,11)

When the propulsion system is comprised of jet engines, a reasonable approximation is T oc p and independent of V, in which case GTy = 2GT = —2CD’ and СТг — 0. The last term of (9.4,10) is then (GDGwJ2pi)(dpjdz), a small positive constant. An approximation to the fifth root is obtained by neglecting the s2 and. s3 terms of (9.4,10) with the result

This actually gives a very good approximation to this root for the example treated. It is seen to correspond to a stable convergence. The effect on the remaining phugoid roots can now be inferred. The coefficient of the next-to – the-highest order term in any characteristic equation is equal to the negative of the sum of the roots. f Since the imaginary parts cancel the result is the “sum of the dampings.” In this case this yields

GT CD

2 nm + *5=+-^=-—*

2 pi pi

where the phugoid roots are nph ± It follows that the “sum of the dampings” is a constant, and hence that the presence of the stable fifth root must be accompanied by a reduction in the damping of the phugoid. Specifically

EFFECT OF VERTICAL DENSITY-GRADIENTПодпись: ii,Подпись: (9.4,12)£d.

For the example case at Cw = .20, this gives the reduction in phugoid damping from the constant-density case, Awithin about 1 %.

In summary, it is clear that even at subsonic speeds the classical “stability quartic” derived from a uniform-atmosphere model can be significantly in

f Verify by comparing l. h.s. and r. h.s. of (s — /j) (.v — /•>) • • • (s — in) — sn + cn_-^sn 1 + • • • c0. — c„-i is equal to the trace of the system matrix A, i. e. to the sum of its diagonal elements.

error with respect to the phugoid roots, and the’ design of autopilot systems to maintain speed and/or altitude may require the use of the more accurate model. At supersonic speeds the effect of density gradient is larger still. However it should be noted that the flat-Earth model itself becomes inade­quate at high supersonic speeds (see Sec. 9.10).

EFFECT OF FLIGHT-PATH ANGLE

To calculate the stability characteristics for nonhorizontal flight it is necessary to neglect all the г derivatives, and use the system matrix of (5.13,19). The basic aerodynamic assumptions made in the following calcu­lations are the same as those used in Sec. 9.1 but the following important difference should be noted—the thrust and lift are no longer equal to the drag and the weight, respectively. Instead at angle of climb ye we have, when ccy = 0,

Подпись: Jw,Подпись: CL„ = CWe COSYe-=-ft-r (94Д)

Since with the assumptions of the model used, CT = —2GTe, this derivative, and hence the coefficient an of the matrix, vary strongly with ye. It is also

Подпись: NEFFECT OF FLIGHT-PATH ANGLE34

32

30

28

26

24

22

20

18

16

14

12

10

8

6

4

2

necessary to note that for negative flight-path angles (diving flight) greater than a few degrees (9.4,1) would require negative thrust. For this range of ye we have assumed for the purposes of the example that Te is zero and that dive brakes are extended to provide the necessary drag, i. e. that

CDc = —@we sin Ye (9.4,2)

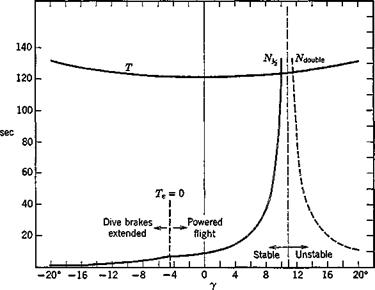
Thus for ye less than the power-off glide angle, an = (CwJ/u) sin ye. The main results of calculations of the eigenvalues are shown on Figs. 9.12 and 9.13 for the constant values GWe = .25, pe = .000889, Kn = .10. The short-

EFFECT OF FLIGHT-PATH ANGLE

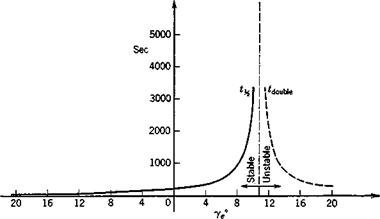
Fio. 9.13 Variation of the time to half amplitude of the phugoid mode with y.

period mode is not significantly affected by ye, but the phugoid is very much. Figure 9.12 shows the variation of its period and damping over the range —20 <ye < 20°. Although the period varies only slightly, the damping deteriorates rapidly with increasing climb angle until the mode becomes unstable above 10.8°. At 20° climb angle the number of cycles to double amplitude has decreased to about 2.2, but because of the long period the time to double, as shown on Fig. 9.13, is still very long—289 sec.

This behavior of the phugoid damping is approximately predicted by the two-degree-of-freedom analysis. If ye be retained from the beginning, with GT = —2CTg for constant-thrust powered flight, the same method that was used to obtain (9.2,9) yields for this case the characteristic equation

s2 + 7- (2С’/Л – CWe sin ye)s + (CWe cos2 ye – CDe sin ye) = 0 (9.4,3)

The coefficient of s, which gives the damping, decreases as ye increases, and

346 Dynamics of atmospheric flight vanishes at the critical angle

У, =sin-x^ (9-М)

ent /7

bWe

For the example, this is 8.6°, somewhat less than the correct value of 10.8° obtained from the complete system of equations.

The unstable phugoid can be shown to be entirely a consequence of the thrust law assumed. If the propulsion system were one of constant power TV instead of constant thrust T, the value of CTy would be —3GT^ instead of —2CTt [see (7.8,5)]. In that case the coefficient of s in (9.4,3) turns out to be 3CDJ2/n, a positive number almost independent of climb angle, and the approximate theory indicates no important change of phugoid char­acteristics with angle of climb. Values of CTy intermediate between the two values used above would give less reduction in the damping than shown in Fig. 9.12.

EFFECT OF ALTITUDE

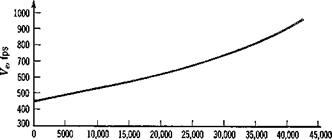
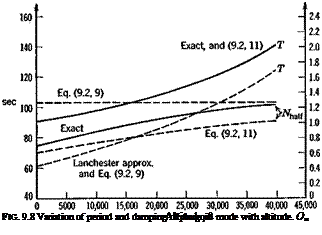
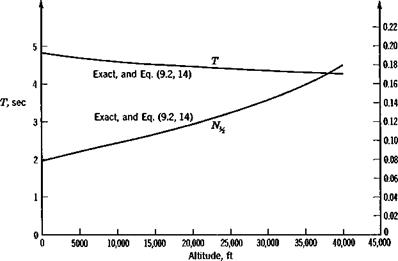
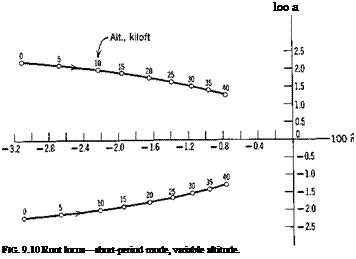
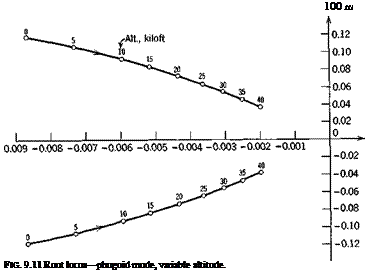
When the altitude is varied at constant CWe and constant static margin the density change has two separate effects. The first is on /л and їу which are both smaller at lower altitude, and the second is on the true speed Ve, which also decreases with decrease of altitude. The matrix (9.1,1) is still appUcable, and with the same assumptions as used before the only quantities in it that change are ц and Iy. Computations were carried out for the altitude range 0 to 40,000 ft for CWe = .25 and Kn = .10. The results are shown on Figs. 9.7 to 9.11. As with the speed variation previously discussed, the results would not be expected to be accurate at the highest altitude, where the speed is about 900 fps, i. e. M = .93, since compressibility effects were not included in the aerodynamic derivatives. The speed is seen in Fig. 9.7 to vary over a range of 2:1 as the height changes, and this has a large effect on the phugoid periods. This is evident in Fig. 9.8, where the period is seen to vary with height in the same way as does the speed, qualitatively as predicted by the Lanchester formula. From (9.2,14) it follows that <x>n for the short-period varies approximately as л/p, and hence that T varies

EFFECT OF ALTITUDE

Altitude, ft

EFFECT OF ALTITUDE

.25.


EFFECT OF ALTITUDE

Fig. 9.9 Variation of period and damping of short-period mode with altitude. Cw = .25. Kn = .10. ‘


EFFECT OF ALTITUDE
EFFECT OF ALTITUDE

approximately as (‘УГреУе)~1. Since peVe2 is a constant at constant Cw the short-period is expected to vary only slightly with height, and this is evident in Fig. 9.9. The damping of both modes is higher in the denser lower atmos­phere. This is predicted for the short-period mode by (9.2,14), but not for the phugoid by (9.2,9). The nondimensional roots show large and qualitatively similar variations for both modes in Figs. 9.10 and 11.

EFFECT OF FLIGHT CONDITION ON THE LONGITUDINAL MODES OF A SUBSONIC JET TRANSPORT

In Sec. 9.1 we gave the representative characteristic modes of a hypo­thetical subsonic jet airplane for a single set of parameters. It is of consider­able interest to enquire into how these characteristics are affected by changes in the major flight variables—speed, altitude, angle of climb, and stability margin. It is also of interest to establish the nature of the approximation dpjdz == 0. In this section we present numerical results that illustrate the above features.

9.4.1 EFFECT OF SPEED

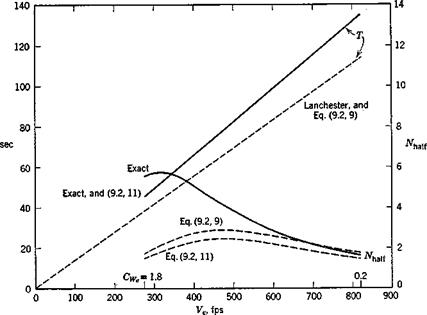
When the speed is changed in horizontal flight, the matrix (9.1,1) previously used is still applicable. All the assumptions made in Sec. 9.1 are retained—in particular, no Mach number effects are included—and hence the only quantities that vary are CLe, CDe, GTy, @Da , and t*. The eigenvalues and eigenvectors of (9.1,1) have been calculated for a range of speeds, and the variations of the period and damping of the two modes are given in Fig. 9.4. The Lanchester approximation to the phugoid period (9.2,5) is shown for comparison, as well as approximations (9.2,9), (9.2,11), and (9.2,14) to the phugoid and short-period modes, respectively.

The speed domain shown corresponds to a range of Gw from.2 to 1.8. This is somewhat larger than that over which one might expect the theory to be accurate. The highest speed corresponds to M = .82 at which com­pressibility effects would be expected to be present in Glx> gd„ , and CTy, and possibility in and G. On the other hand, at the large CL corre­sponding to the lowest speed, flow separation effects might be expected to occur on the cruise configuration in the absence of boundary layer control, affecting several of the derivatives.

EFFECT OF FLIGHT CONDITION ON THE LONGITUDINAL MODES OF A SUBSONIC JET TRANSPORT

(а)

EFFECT OF FLIGHT CONDITION ON THE LONGITUDINAL MODES OF A SUBSONIC JET TRANSPORT

(Ь)

The phugoid period is seen to behave qualitatively as predicted by Lan – chester’s theory, and the usefulness of the approximate theories for pre­dicting it is evident. Not so for the damping of the phugoid however, for which the approximate theories fail to predict the severe loss of damping at low speeds, where the number of cycles to half amplitude increases to nearly six.

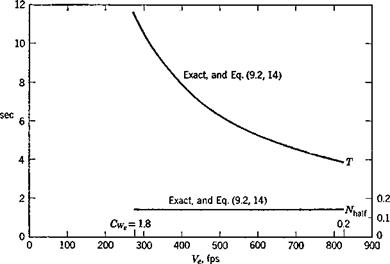
The short-period mode has essentially constant nondimensional eigen­values [note that CWe does not appear in (9.2,14)]. The variation shown in T comes almost entirely from that of t* = cj2Ve. The approximation given by

(9.2,14) is to the accuracy of the graph indistinguishable from the exact solution.

At the lowest speed the separation of the periods of the two modes is much less than at high speeds, their ratio at 274 fps being only 3.9 by contrast with 34.8 at 821 fps.

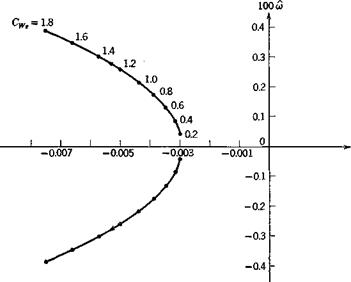
Figure 9.5 shows the root-locus of the phugoid mode. That for the short – period mode is virtually a pair of conjugate points and is not shown.

Figure 9.6 shows how the modal characteristics (the eigenvectors) have changed at the lowest speed. The most significant feature is that appreciable Да has appeared in the phugoid and Af’ in the short-period mode. This can be traced to the fact that the periods of the two modes are much closer to one another at this speed, and hence that the coupling between the previously

100 n


Fig. 9.5 Root locus—phugoid mode, variable Ow.


EFFECT OF FLIGHT CONDITION ON THE LONGITUDINAL MODES OF A SUBSONIC JET TRANSPORT

EFFECT OF FLIGHT CONDITION ON THE LONGITUDINAL MODES OF A SUBSONIC JET TRANSPORT

(а)

EFFECT OF FLIGHT CONDITION ON THE LONGITUDINAL MODES OF A SUBSONIC JET TRANSPORT

lightly-coupled degrees of freedom is stronger. That is to say, a variation of a at the short-period frequency can induce an appreciable speed change under these conditions and the pitching moment variation during the phugoid (associated mainly with Cmfl) can induce appreciable changes in a. Now we arrived at the approximations (9.2,9) and (9.2,14) by ignoring Да in one mode and AF in the other. It therefore follows that the approximations might be poorer at low speed than at high speed. This is clearly shown for the phugoid damping in Fig. 9.4a, but the approximations to the phugoid period, and to the short-period mode, are not appreciably worse at low speed than at high speed.