We define a “truly banked” turn to be one in which (i) the vehicle velocity vector to is constant and vertical (see Pig. 10.9) and (ii) the resultant of gravity and centrifugal force at the mass center lies in the plane of symmetry. This corresponds to flying the turn on the turn-and-bank indicator. f It is quite common for turns to be made at bank angles that are too large for
t Neglecting the fact that the pilot and indicator are not right at the C. G.
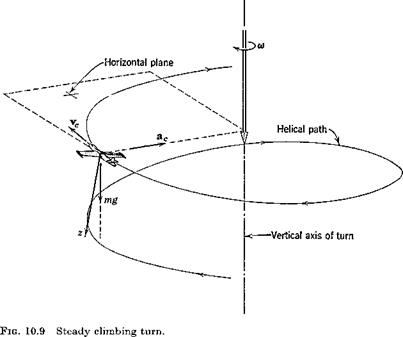
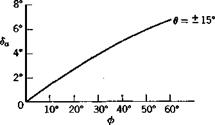
linearization of sin ф and cos ф to be acceptable, although all the state variables other than ф and F are small. Thus we turn to the basic nonlinear equations in Sec. 5.8 for this analysis. The large bank angle has the consequence that coupling of the lateral and longitudinal equations occurs, since more lift is needed to balance gravity than in level flight. Thus not only the aileron and rudder but the elevator as well must be used for turning at large ф.
The body-axis angular rates are given by
(10.4,4)
which for small elevation angle в yields
We now apply the second condition for a truly banked turn—that the ball shall be centered in the turn-and-bank indicator. This means that the vector mg — mac shall have no у component. But mac is the resultant external force f, so that from (5.5,3)
mg — ma, c = mg — f = —A
where A is the resultant aerodynamic force vector. Thus we conclude that the aerodynamic force must lie in the xz plane, and that У = 0. It follows from (5.8,26), when only ф and и are not small, that
mg sin ф = mru = mrV (10.4,6)
= mVco cos ф
Hence the bank angle is given by
tan ф = — (10.4,7)
g
We choose the body axes so that ctx = w = 0, whence it follows (see Fig. 4.4) that z and zw coincide, and hence that L = —Z. Equation (5.8,2c) then permits the determination of L, i. e.
L = —Z — mg cos в cos ф — m(pv — qu)
which, again to first order, after substituting q from (10.4,5) yields
L = mg cos ф + mVco sin ф (10.4,8)
When Fa) is eliminated by (10.4,7) we get
n = — = sec ф (10.4,9)
mg
The incremental lift coefficient, as compared with straight flight at the same speed and height, is
A CL = = (n~ 1 )GW (10.4,10)
ipv
We can now write down the equations governing the control angles. From
(5.8,3) , to first order, L = M = N = 0, so we have the five aerodynamic conditions
Ci = Cm = C„ = Cy = 0
(10.4,15) elevator angle per g in a turn is therefore not very different from that in a vertical pull-up.
Finally, the lateral control angles are obtained from the solution of (10.4,13)
The basic flight condition is steady symmetric flight, in which all the lateral variables /3, p, r, <f> are identically zero. Unlike the elevator and the throttle, the lateral controls, the aileron and rudder are not used individually to produce changes in the steady state. This is because the steady-state values of /3, p, г, ф that result from a constant 8a or 6T are not generally of interest as a useful flight condition. There are two lateral steady states that are of interest, however, each of which requires the joint application of aileron and rudder. These are the steady sideslip, in which the flight path is rectilinear, and the steady turn, in which the angular velocity vector is vertical. We look into these below before proceeding to the study of dynamic response to the lateral controls.
THE STEADY SIDESLIP
The steady sideslip is a condition of nonsymmetric rectilinear translation. It is sometimes used, particularly with light airplanes, to correct for crosswind on landing approaches. Glider pilots also use this maneuver to steepen the glide path, since the LjD ratio decreases due to increased drag at large /3. In this flight condition D = d/dr = 0, and p = r = yE = 0. Thus, with reference to (5.13,17), the only nonzero state variables are /3, ф, and ip. For the control terms we use the following, which is a good representation for conventional airplanes:
With (10.4,1), and the special conditions for steady sideslip, (5.13,17) reduces
QypP + ^w„ cos УеФ + CvsT dr = 0
clfp + cltrdr + cliasa = 0
CnpP + Спіт dr + CnSa ^0 = 0 /3 + f cos ye— 0
The fourth equation is the only one containing p, and may be dropped from consideration. The three preceding ones contain the four variables /5, ф, дт, да. Hence an infinite set of solutions exists, in which any one of the four may be selected arbitrarily. If we choose ф to be arbitrary the equations can be solved for the corresponding /3, dr, da (provided of course that its matrix is not singular). Thus
As an example, consider the jet transport used previously, at CWe — 1.0, ye = 0, with the /3 derivatives as in See. 9.6. In addition to these we need the control derivatives, for which we use
СПт = .067 G4r = .003 СЩг = -.040
G4a = -.065 <7^ = .005
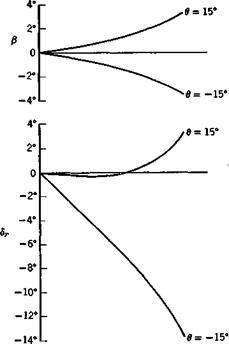
It is evident from (10.4,3) that jj, dr, and da are all proportional to ф, hence the ratios of the angles are constant. The numerical result is:
^ = .0558; ^ = 1.675; ^ = -1.800
I» (8 0
so that for a sideslip of 10°, the other angles are ф = .56°, dr = 16.75°, da = —18.00°. As expected, a slip to the right requires left rudder and right aileron. The control angles are seen to be large; powerful controls are needed to sideslip at large angles. When the matrix A is singular, it only indicates that ф is zero in the sideslip. In that case the equations can be rearranged to put ф on the l. h.s. and /3 on the r. h.s., in which case the new matrix is very unlikely to be singular.
Analog computations were made for the airplane and flight condition of the previous example, with ДСТі_ = .0125 and with г/с = Oand.3 The results for F, a, and у are shown on Figs 10.7 and 10.8. The motion at this time scale is clearly dominated by the lightly damped phugoid. Consider Fig. 10.7
|
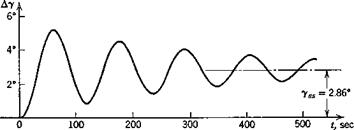
Fig. 10.7 Response to throttle (ДCj, = .0125). Jet transport erasing at high altitude. Thrust line passing through C. G.
|
1—-
Aass = 0.29* —S – t, sec
(zjc = 0) first. We see that the speed begins to increase immediately, before the other variables have time to change. It then undergoes a damped oscillation, returning finally to its initial value. The angle of attack varies only slightly, and у makes an oscillatory approach to its final positive value yss. The ultimate steady state is a climb with Д1? = Да = 0, the numerical value of yss being correctly given by (10.3,4). For the case zjc = .3, Fig. 10.8, the results differ from the preceding in several significant ways. Although the speed does begin to increase at first, the increase is small and is quickly followed by a reduction of order 10% Ve. The final value is 5% less than Ve, a rather large change. The initial response in a is rapid, being dominated
by the short-period mode, and is not seen in detail at this time scale. Because of the rapid increase in a, and the excess lift that goes with it, there is a much more rapid response in y. than is the case in Fig. 10.7. The amplitude of the у oscillation is also larger than on Fig. 10.7, and the final state is a climb of appreciably larger inclination. The steady states are again correctly predicted by (10.3,3).
The initial response of an airplane to movement of the throttle is actually quite dependent on the details of the engine control system and on the type of propulsion system. For jet engines it takes an appreciable time for the rpm and thrust to increase after opening the throttle, and this can be an
important factor in emergency conditions. The response of a propeller, which increases thrust by a change of blade angle, is more rapid. We make the simple assumption here that opening the throttle produces a step change in GT of amount ДGTc. If the thrust line does not pass through the C. G. there is an associated pitching moment (7.3,4) АСШе = АСтг/с. The l. h.s. of the system equation is then exactly the same as (10.2,1) and the r. h.s. is
-1
0
  zjc zjc
0
APPROXIMATE TRANSFER FUNCTIONS
Since the main effects of the throttle are the long-term changes in speed and flight-path angle, the phugoid approximation to the equations is an
appropriate one. The same procedure that led to (10.2,14) for this case gives the approximate equations
simply leads to a new steady-state flight condition at increased climb angle and no change of speed. By contrast the other principal longitudinal control, the elevator, ultimately influences both speed and flight-path angle [(10.2,16a) and (10.2,17)], albeit the change in the latter may he of either sign depending on flight speed. The simple rule “throttle controls climb and elevator controls speed” is not what it seems. It is true that the throttle is an uncoupled climb control (when г = 0) but the elevator is not an uncoupled speed control (except at ymax) and the rule only applies to steady states, not to initial transients.
For the same airplane and flight conditions as in the previous example, the response to a step-function input in the elevator angle was computed, using (5.13,19) mechanized for a 10-volt analog computer. As an aid to readers unfamiliar with analog computation, the details of this one example are set out rather fully. The other examples that follow later were computed in essentially the same way, but the details of scaling and circuits are omitted. With the same assumptions as made previously the differential equations with numerical coefficients are:
Df = -6.92 x lO-5 A F + 2.55 x 10~4 Aoc – 4.60 x 10~4 А в
Doc = -9.20 X 10⁻⁴ AF – 9.00 X 10~3 Aoc + q – 4.42 X 10"4 Me
Dq = 2.03 X 10⁻⁶ A V – 3.62 x 10~4 Aoc – 1.43 X I0~2q – 3.77 X 10~4 Me
D6 = 4 (10.2,18)
To mechanize them for analog computation we make the following transformation of variables:
[V]=srAf; [«) = *. Да; [q] = sqq; [0] = se Д0 (10.2,19)
where the quantities in square brackets, [F] etc., denote machine voltages, and sr etc. are scale factors. Time scaling is by the law
T = stt
where t is laboratory clock time, or macsecs (for computing machine seconds), and t is the nondimensional time variable of the differential equations. To relate the computer results to real flight time t we use t
r = st~, t* = .0105 see (10.2,20)
On recalling that D in (10.2,18) represents d/dt, and defining [ ]’ = (ri/rir)[ ], the transformation of the equations into differential equations for the
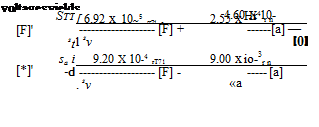
 + -[?] -4.42 x 1<Г*Дд, M’ = (2-°3 X 10~6 [F] – 3-62..X 10 4 [a] + -[?] -4.42 x 1<Г*Дд, M’ = (2-°3 X 10~6 [F] – 3-62..X 10 4 [a]
st l SV sx

И – 3.77 x 10~4
[0]’ = M
StSQ
Note that we have chosen for convenience to give the control angles as ASe, rather than [d]/ss, since Ade not [6] is to be specified. The scale factors used were as follows:
sr — 10 v/unit sx = 10 v/radian
sq = 1000 v/unit se = 10 v/radian
Since the response shortly after t = 0 is governed mainly by the short-period mode, and the long-term response by the phugoid mode, a single time scale is not appropriate for both. Hence two time scales were used:
To show long-term response: st = 10~3
To show initial response: st = 10-2
The analog circuit for st = 10“3 and Аёе = —.03 rad is shown in Fig. 10.4, using conventional symbols for integrators, summers, etc.
When st = 10~3, the time relation, from (10.2,20) is
f*
t = – T= 10.5r
and hence the process proceeds about 10 times faster on the computer than in flight. When st = 10 ~2, the process proceeds at nearly real flight time. The results for F, a, and у are shown for both time scales on Figs. 10.5 and
|
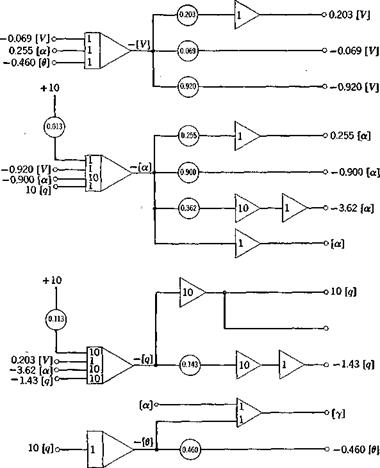
Fig. 10.4 Analog circuit diagram for response to elevator step. Д<5е = —.03 rad, st = 10~3.
|
10.6. These curves were recorded by a conventional x — у plotter; the time base was generated on the computer by integrating a constant.
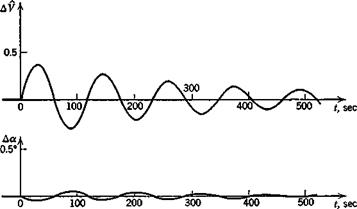
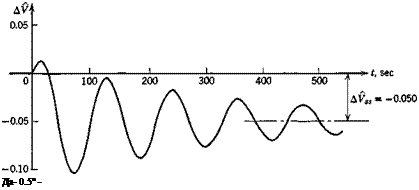
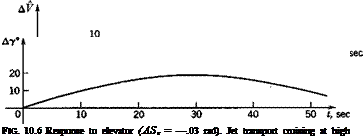
Figure 10.5 shows that a increases rapidly and quickly damps out to its asymptotic value. V and y, however, make a slow, weakly damped approach to their final values, the initial overshoot being very large for both. If the reason for moving the elevator were to change to a new steady state, the maneuver has not been a very effective one! After 500 sec the oscillations in V and у have still not disappeared. The behavior near t = 0 is shown more clearly on Fig. 10.6; the rapid rise in a is dominated by the short-period mode. It is only after a has changed that the associated increase in lift can
|

Fig. 10.5 Response to elevator (Д8e = —.03 rad). Jet transport cruising at high altitude.
|
act to curve the flight path (via A. L = mVy); thus the increase in у lags that in a. At the same time the increased drag due to Да, and the “downhill” component of the weight combine to produce a reduction in speed, which lags still farther behind. The response in у is not in fact very rapid. It takes about 10 sec to increase у by about 10° with this elevator deflection. In this time the vehicle has traveled 7330 ft.
For this example we take the same hypothetical jet transport as was used in Sec. 9.1, flying at the same speed and height. For the aerodynamic transfer functions in P we use the stability derivative representation, i. e. all but Gm^ are the same as the corresponding stability derivatives, and Сгт(г — Gme + sCm ■. In addition, for the control aerodynamics we use
®LS = gls = -24/radian
GmS = Oms = — .72/radian
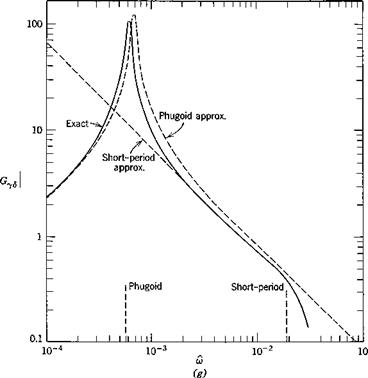
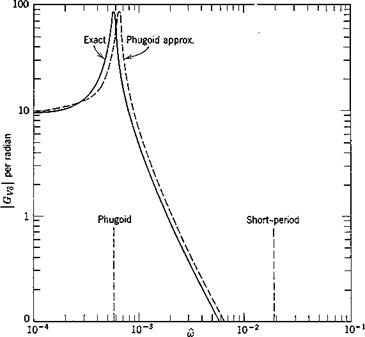
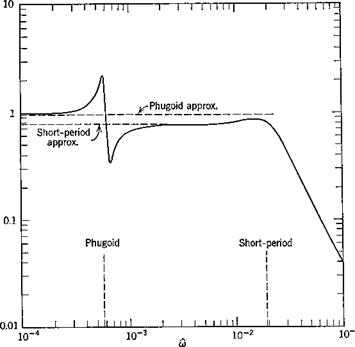
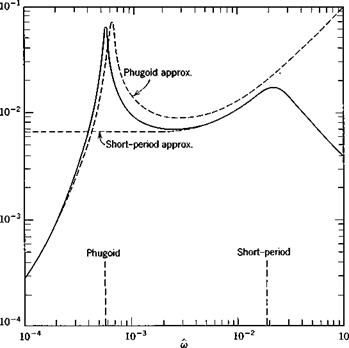
The exact frequency response was calculated from (10.2,1) and the two approximations from (10.2,11) and (10.2,15) by substituting s = ito in them. The results are shown on Fig. 10.3 for speed, angle of attack, and flight-path angle.
The exact solutions show that the responses in the “trajectory” variables V and у are dominated entirely by the large peak at the phugoid frequency. Because of the light damping in this mode, the dynamic gains at resonance are very large. The peak GVd of about 85 means that a speed amplitude of 10% of Ve would result from an elevator angle amplitude of only.1 X 57.3/85 = .068°. Similarly at resonance an oscillation of 10° in у would result from about 1/10° elevator amplitude. For both these variables, the response diminishes rapidly with increasing frequency, becoming negligibly small above the short-period frequency. The phase angle for V, Fig. 10.36, is zero at low frequency, diminishes rapidly to —180° at the phugoid frequency (very much like the lightly damped, second-order systems of Fig. 3.176) and subsequently at the short-period frequency undergoes a further drop characteristic of a heavily damped, second-order system. The “chain” concept of high-order systems (Sec. 3.4) is well exemplified by this graph.
By contrast, the attitude variables a and q show important effects at both the phugoid and short-period frequencies. The complicated behavior of a near the phugoid frequency indicates the sort of thing that can occur with high-order systems. It is associated with a pole and a zero of GaS occurring close together in the exact transfer function. Again, above the short-period frequency, the amplitude of a and q both fall off rapidly.
As to the approximate solutions shown, one general statement can be made. The short-period approximation is exact as m —> oo, and the phugoid approximation is exact as со —► 0. With a single exception, all the phenomena shown are represented reasonably well by one or other of the approximations. The exception is the oc response at the phugoid frequency, which is revealed only by the exact solution. The principal error in the approximations is the displaced peak at the phugoid. This corresponds to the error in the phugoid
|
|
|
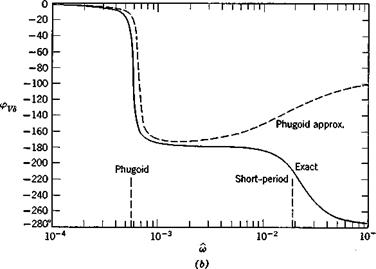
Fig. 10.3 Frequency-response functions, elevator angle input. Jet transport cruising at high altitude, (a) Speed amplitude. (b) Speed phase angle, (c) Angle of attack amplitude, (d) Angle of attack phase angle, (e) Pitch-rate amplitude. (/) Pitch-rate phase angle, (g) Flight-path angle amplitude, (h) Flight-path angle phase angle.
|
|
|
|
|
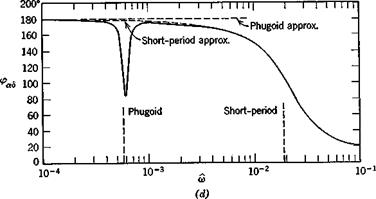
Fig. 10.3. (Contd.)
|
|
|
(е)
|
|
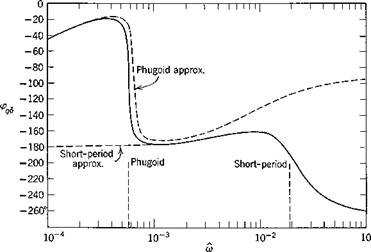
(f)
Fig. 10.3. (Gontd.) 412
|
|
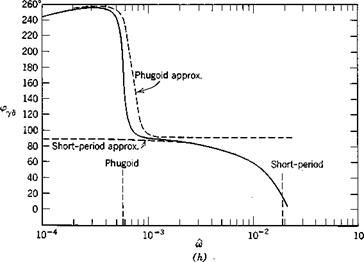
Fig 10.3. (Contd.)
|
period shown for approximation (9.2,9) on Fig. 9.4a. Had the characteristic equation corresponding to (9.2,11) been used instead, the approximation would have been better.
The phugoid approximation in Sec. 9.2 was based on the assumption that Да is negligibly small and the pitching moment equation is identically satisfied. When the elevator angle is varying however, Да can no longer be assumed small. The equivalent assumption for this case is that pitch equilibrium is maintained, i. e. that
Aa + Gmaq + Gmd A3e = 0
Now we expect this approximation to be useful only at low elevator frequencies, when we can replace the above expression by
Gm<z Aa + Gmfl + Gmg Ade = 0
We now further assume that Gm<q is negligible, so that the angle of attack is given by the quasistatic value
Q
Да =——– — A3e (10.2,13)
Gm
The usefulness of this assumption is checked a posteriori. With the pitch equation eliminated from (10.2,1) and Да eliminated by (10.2,13), we get the reduced system equation
|
GTr — 2/is
|
0
|
1
О
___ 1
|
AV
|
|
|
|
|
■~2CWe
|
2/л
|
0
|
й
|
=
|
GLg-G-^(GLa + GDe + 2Ms)
°ma
|
A 3e
|
|
_ 0
|
1
|
—s _
|
_A0_
|
|
_ 0 _
|
|
(10.2,14)
The required basic transfer functions are obtained from (10.2,14) as
~GLpW. + Tp [GWe(GLx + GD) + 2/“CxyS]
A ^
GVS — —————– 2 2 7Г~7І T~o7I 2—————————- (a)
4/i s — 2fiCTys + 2CWe
-GaGTV – ^ [-2aW'(CW’ – C^)
G + Gtv(glx + CID.) + 2у(СТг – glx – gd) ~ V*2]
ва 4/A2 – 2fiGTys + 2GW*
д 6 (Ь) (Ю.2Д5)
= (c)
From (10.2,13) we have in addition
|
A °ms
. mct
|
(d)
|
|
and finally
|
|
|
G7S = G0S ~ GaS
|
(e)
|
As expected, the denominators of (10.2,15a and b) give the same characteristic equation as was used for the phugoid previously, i. e. (9.2,9).
The assumptions on which (10.2,15) are based hold exactly in the limit of zero control frequency, and hence the static gains given by them are correct. Taking the limit s —► 0 (see (3.2,4)) we get the gains
 C/’/j / (/7) От C/’/j / (/7) От
,,0’2’17)
The interesting thing about (10.2,17) is that it can change sign as GWe ( = CLJ
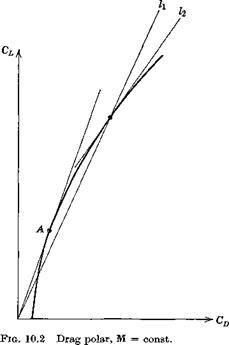
varies. With reference to Fig. 10.2 the quantity in parentheses on the r. h.s., for constant Mach number, can be written
dOD
where dCLjdCD is the slope of the tangent to the drag polar, l2. Since CLICD is the slope of l1; it is evident that (GDjGL)(dGLldGD) is unity at point A, is <1 for Gl > GLa and >1 for CL < GLa. As a result the second term on the r. h.s. of (10.2,17) is negative for CL < CL and positive for CL > GLa. Because of the first term in (10.2,17) К s does not change sign exactly at A, but at a slightly lower value of CL. With typical numerical values KyS= 0 when (CBjGL)(dCjjdCD) == 1.05. The point of all this is that A represents flight at (L/D)max, or at minimum drag, and hence that the ultimate response of flight-path angle to elevator reverses when this speed is crossed. At high speed (low CLJKyS is negative, so that up-elevator (stick back) produces a climb, but at low speed the opposite occurs. This result is seen to be entirely compatible with the conclusions reached from performance considerations, see Fig. 10.1. It is seen that the sign of Г — D for a speed reduction (associated with a negative A. de) is opposite for points P and Q on opposite sides of the minimum-drag speed.
We found in Chapter 9 that a very good approximation to the short-period mode is given by (9.2,14). We therefore make the same additional assumptions here as led to that approximation—viz. AV = 0, and the speed equation of motion is identically satisfied. The reduced system equation is then found from (10.2,1) to be
 — (®ia + GDe + 2/w) — (®ia + GDe + 2/w)
№y8 ^7no)
_ 0 1
The system transfer functions are now most simply found from (10.2,10) by solving for the ratios Aa. jA8e, etc., with the result
|
6*
|
Да
|
fy&ms – GL/)(Ivs Gmg)
|
(a)
|
|
1
>1
.4
1
|
(iy-s — Gmil)(GLx + CDe + 2[is) — 2fiGmx
|
|
&es
|
_ A6 _
|
Gms(^/is + GLx + CDr) — GLsGmx
|
(b) (10.2,11)
|
|
д §e
|
s{(fys — Gmq)(GLx + CDe + 2fis) — 2ftGmJ
|
|
Ggd
|
= в®вд
|
|
(«)
|
|
When the aerodynamic control transfer functions are replaced by their stability derivative representations, i. e. by (10.2,2) and with
|
+ s@m& ’> ®mq = @im
the denominators of the above transfer functions are all polynomials in s that have exactly the same roots as (9.2,14). The numerators become
Of GxS: (GLgGms + 2/лСта) + s(2p, Cms —IyCLi) (a)
Of Ges: Cms(CLx + CD) – CmCLd] +s[(2pCmd + Crr, a(CLa + CD) – GLgGm&]
+ s*(2uCmb) (b) (10.2,12)
Both numerators are of degree one less than their respective denominators.
| |





 + -[?] -4.42 x 1<Г*Дд, M’ = (2-°3 X 10~6 [F] – 3-62..X 10 4 [a]