Category Fundamentals of Modern Unsteady Aerodynamics

Hypersonic Viscous Flow: Numerical Solutions

In previous chapters we have studied the analytical and experimental work related to viscous hypersonic flow past flat plate at zero angle of attack. Now, we can extend those to further study hypersonic flows with the aid of computational fluid dynamics.

Let us start with the solution of viscous hypersonic boundary layer equations. If we take x coordinate as the direction parallel to the surface and z coordinate as the direction normal to the surface the set of equations reads as

Continuity: Oq + Oqu + = 0 (7.88a)

1 0t 0x 0z

/0“ 0“ 0u Op 0 / 0u

Подпись: 0tПодпись: (7.88c)

Подпись: 0p 0 / 0T /0“2 !0X + 0Z k0 +1 0Z
Подпись: 0h 0h 0h' Energy:q 0F+V+“&

Momentum: Ча + “a!+=-aX + &№ (7:88b)

for unsteady flow. Here, in addition to velocity components u and v, h shows the enthalpy and T denotes temperature where pressure p is as usual provided from outside. In order to solve the boundary layer equations about a blunt body, we start with the stagnation flow solution. Equations 7.88b, c, are partial differential equations. They can be transformed to ordinary differential equations with Illingworth transformation, i. e. П = /о peUepedx and g = Ue Д/2П /0 qdz, and the non dimensional f (g) = u/Ue and non dimensional enthalpy then reads g = h/he

(Cf )’ + f” = f’)2 – g (7.89a)

(Cg’)’+ Pfg’ = 0 (7.89b)

Here, Pr is Prandtl number, and C = pp/(pepe) (White 1991). If we use the power law for the viscosity variation with temperature for the perfect gas we obtain C = g(n-1).

For air, taking n = 2/3, makes Eqs. 7.89a, b in terms of g as the independent variable

f’ – f + g1/3ff’ ‘ + g4/3 – g1/3(f’ )2 = 0 (7.90a)

3g

g” – g + Prg1/3fg’ = 0 (7.90b)

3g

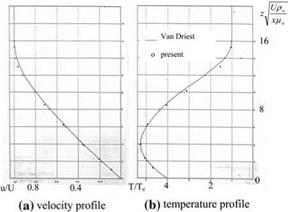
Equations 7.90a, b are solved with an iterative method to obtain the stagnation speed and temperature which satisfy the wall and the edge conditions. These velocity and the temperature values are used as the initial station to start solution of the parabolic Eqs. 7.89a, b with a marching technique. Eqs. 7.88a, b are solved with finite difference as explained in Appendix 10. The calibration of the scheme is made with the hypersonic flow past a flat plate at free stream Mach number of 8. In this bench mark test, the wall to edge temperature ratio is considered 4 as shown in Fig. 7.23a, b (Oksuzoglu and Gulcat).

After observing the agreement with the present solution and the Van Driest solution Fig. 7.23, the numerical procedure is applied to the hypersonic flow past circular cylinder. The pressure distribution for the circular cylinder is provided by the Newtonian Flow.

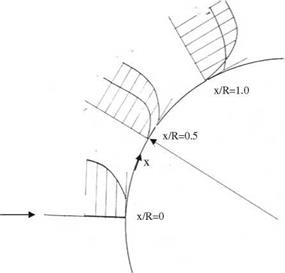
Shown in Fig. 7.24 is the hypersonic boundary layer flow about the circular cylinder at M = 8, Re = 10,000, and Pr = 0.75. The stagnation flow solution is

Подпись: M
Подпись: z/R
Подпись: u/U
Подпись: T/Te
Подпись: T/Te
Подпись: u/U
Подпись: z/R
Подпись: R
Подпись: +

Подпись:Подпись: z/R

Hypersonic Viscous Flow: Numerical Solutions
image188

image189done with Eq. 7.90a, b at x/R = 0, and the boundary layer edge to wall velocity ratio is taken as 2 for temperature profiles where the wall appears to be cold.

The studies and the related examples for the viscous hypersonic flow are so far for the flows having free stream Mach numbers 8 or smaller. During re-entry when the free stream Mach number is greater than 8, the oxygen and the nitrogen molecules disassociate with speed and altitude as shown in Fig. 7.19. For this reason, as done before, we have to include the chemical reactions in our computations. Since the viscous effects are to be seen near the wall, we have to see whether the wall is a catalytic or not, and add the diffusion terms to the equations together with altering the boundary conditions at the wall in terms of heat
conduction. For this reason, let us first determine the mass diffusion coefficient in terms of Fick’s law. The Fick’s law gives the amount diffusion between the spe­cies 1 and 2 as follows: – pD12 grad cj_, where cj is the mass fraction of the specie 1. Here, D12 is the coefficient of diffusion whose values are given in tables in literature to be used in computation in low density flows. The viscous solutions based on the mass diffusion require adding the relevant terms to Navier-Stokes equations. Now, let us re-write the boundary layer equations, Eq. 7.88, by adding the diffusion terms. The continuity and the x momentum equations written for the total species, Eq. 7.88a, b, retain their original forms. The diffusion terms need to be added to the continuity of the species and the total energy equation. The continuity of specie i then reads as

де, 0ci 0 ( 0еД. .

quaX+qw0Z = 0z(qD1’–0Z + wi (7:91)

Подпись: q Подпись: 0h 0h' и + w 0X 0Z Подпись: 0p 0 U0X + 0Z Подпись: 0 0T + 0Z kk0z Подпись: (7.92)
image190 image191

The energy equation then becomes

Here, k is the time dependent heat conduction coefficient. Since there are more than one specie, the values of k and i are computed with a special averaging method (Anderson 1989).

The boundary layer equations, given by Eqs. 7.91 and 7.92 together with the total continuity and the momentum equations, 7.88-a, b, with chemical reactions and the wall boundary conditions were seen in the literature starting from mid 1980s. An example to this sort of elaborate work is the study performed by Aupoix et al. (1987). In their study, the two dimensional boundary layer equations at the symmetry plane of the lower surface of the space shuttle are solved at free stream Mach number of 23.4 considering a catalytic and non catalytic wall. Five species, disassociation of O2, N2 into O and N, and formation of NO are involved in reacting flow together with catalytic wall conditions. The conclusions of the afore mentioned work is as follows: (1) wall catalysity and the wall temperature have an effect on the heat flux and the displacement thickness, (2) the surface friction is independent of real gas effects, (3) chemical reactions for a few number of species are sufficient, and (4) simple diffusion models yield accurate solutions. In addition, the heat flux qw at the wall is given by diffusion of 2 species as follows

qw = – k0T – PD12 X hi0z (793)

i w

For the case of adiabatic wall equating Eq. 7.93 to zero is sufficient. In reacting flows, on the other hand, the mass fraction of species is unknown in the equations; therefore, while solving the continuity of the species, the catalytic effects which determine rates of reaction at the wall are to be considered. The expression which gives the catalytic formation of species and their diffusion into the flow is as follows

image192
Подпись: (7.94)

For a non catalytic wall, Eq. 7.94 is set to zero to get (|y-)w = 0. On the other hand, for fully catalytic walls the rate of chemical reactions is infinite; therefore, the mass fractions of the species take their equilibrium chemistry values, i. e., Cj = (c;)eq. For partially catalytic walls, since the chemical reactions take place with finite rates, the specie production rate in Eq. 7.94 is given in terms of the gradient of Ci.

Aupoix et al. (1987) also discovered in their study with catalytic and non catalytic wall at 1,500 K, M = 23.4, and 71 km altitude using 5 and 10 species that the heat transfer rate at the stagnation point is 0.4 MW/m2 for catalytic wall and 0.1 MW/m2 for non catalytic wall. Naturally, reducing the Mach number and the wall temperature reduces the heat transfer.

image194
image193

The non dimensional boundary layer equations for hypersonic flow help us to predict the flow parameters as it was the case for original boundary layer equa­tions. In non dimensionalization we take the velocity, density, enthalpy and the diffusion coefficient at the boundary layer edge as the characteristic values. If we write the non dimensional stagnation enthalpy ho = h + и2/2 in the energy equation then we have

(7.95)

Here, Le = pD12cpfk, is the Lewis number and cpf = Rc;cpi, is the summation of specific heat constants at the frozen flow. According to Eq. 7.95, if the Lewis number is 1 in the boundary layer then the effect of diffusion disappears.

The stagnation point solutions are to be known in order to start the boundary layer solution around blunt bodies. We need to add the term with the Lewis number to Eqs. 7.89a, b. With these terms added, the heat transfer rates at the stagnation point of a wall, catalytic or non catalytic, are provided in terms of the Lewis number by Anderson (1989).

Other than boundary layer equations, the hypersonic viscous reacting flow numerical solutions for the space shuttle at 71 km of altitude with free stream Mach number of 23 were published by Prabhu and Tannehill in mid 1980s. In their study, comparison of equilibrium chemistry solution with the perfect gas solution for the value of у = 1.2 shows that they match with each other. This indicates that at the upper level of atmosphere flight conditions are better simulated using у = 1.2.

Also in mid 1980s, gas kinetic equations were employed to predict the three dimensional flow simulations at the upper level of atmosphere with some degree of slip instead of no-slip condition at the surface (Riedelbauch). In 1990s unsteady three dimensional Navier-Stokes equations were employed for solution of hypersonic aerodynamic problems (Edwards and Flores 1990). In their work,
numerical solutions obtained for chemically reacting flow past a sphere-cone configuration at high Mach numbers and high altitudes are in good agreement with the previous studies in terms of surface pressure and heat transfer rates. The specific heat ratio calculation obtained for the reacting flow gives у = 1.4 before the shock, and its value reaches minimum of 1.2 after the shock.

High Temperature Effects in Hypersonic Flow

We have studied, so far, how high the temperatures can get at the stagnation point of a hypersonically flying vehicle because of a strong shock forming before the nose. At very high temperatures and low pressures of high altitudes, the chemical composition of air cannot remain the same. Before the chemical composition change, first the change in the specific heats with temperature occurs. Therefore, the air is no longer a calorically perfect gas. Since the change in the specific heats depends on the temperature, we can assume the air as a thermally perfect gas, and use the temperature dependent specific heat ratios instead of constant у = 1.4. On the other hand, the gas constant R has the same dependence on the specific heats both for the calorically or thermally perfect gas, i. e. cp — cv = R still holds.

At high temperatures, the temperature dependent behavior of the specific heats of the air can be determined with the aid of ‘gas kinetics’. The chemical com­position of the air at normal conditions contains 79% molecular nitrogen N2, 20% molecular oxygen O2, and 1% other gases. In this composition, neglecting the other gases the air is mainly composed of molecular nitrogen and oxygen. For di-atomic gases, the internal energy of the molecule is composed of the transla­tional and the rotational energies. This internal energy increases linearly with temperature, and is expressed as: e = etr + erot. Using statistical methods for di-atomic gases the translational energy depending on temperature T reads as ete = 3/2 RT, and the rotational energy becomes: erot = RT (Lee et al. 1973). This gives the total internal energy in terms of temperature, and the specific heat constant at constant volume as follows

5 Oe 5 , .

e = RT, cv = = R (7.69a, b)

2 v OT 2 v ;

Подпись: evib Подпись: hv/kT RT ehv/kT _ 1 Подпись: (7.70)

At higher temperatures, temperatures above 800 K, the bond between the di-a­tomic molecules starts to vibrate to further increase the internal energy. This increase in the internal energy is called the vibration energy of a molecule. The change in the vibration energy of the molecule is non-linear with the temperature, and the classical thermodynamics is insufficient to calculate the tem­perature dependence of vibration energy. The quantum mechanical approach with the concept of partition function is necessary to express the vibration energy as follows (Appendix 8):

Here, h = 6.625 x 10 34 Js is the Planck constant, v is the fundamental frequency of the molecule, and k = 1.38 x 10⁻²³ J/K is the Boltzmann constant. The fundamental frequencies for the nitrogen and the oxygen molecules are different, and they are for N2: vN2 = 7.06 x 10¹³s_ and for O2: vo2 = 4.73 x

Подпись: e High Temperature Effects in Hypersonic Flow Подпись: (7.71)

1013s_ (Anderson 1989). Accordingly, the specific internal energy at high tem­peratures reads as

Подпись: cv Подпись: 5n , (hv/kT)2ehv/kTn 2 R + (ehv/kT _ 1)2 R Подпись: (7.72)

Hence, the derivative of the Eq. 7.71 with respect to temperature gives us the specific heat constant at constant volume with the following temperature dependence

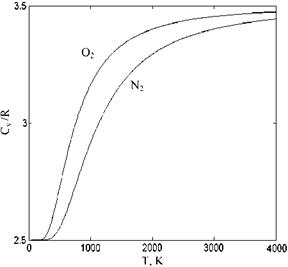
Shown in Fig. 7.18 is the variation of cv/R with temperature for the nitrogen and the oxygen molecules having vibrational energies.

According to Fig. 7.18, when 4,000 K is reached the value of cv/R approaches 7/2 as its limit value for di-atomic molecules. The limiting value of the exponential term in Eq. 7.72 approaches unity as temperature goes to infinity.

On the other hand, the classical statistical theory gives the value of vibrational energy as evib = RT which is true only for T approaching infinity. For the values of temperature which are of interest to us, the evaluation of vibration energy with classical theory is not correct. At temperatures above 2,000 K the oxygen mole­cules disassociate and above 4,000 K the same thing happens to the nitrogen molecules so that the chemical composition of the air changes, and the relevant chemical reactions must be include at such high temperatures. The necessary reaction energies for the partial or full disassociations of the species are provided by the aerodynamic heating generated by high speeds and the ambient pressure.

Подпись: Fig. 7.18 The variation of cv/R at high temperatures for O2 and N2
image183

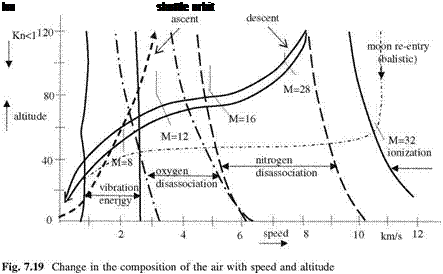
Under normal room pressure, the full disassociation of oxygen molecules is complete at 4,000 K, and the nitrogen molecules are fully disassociated at 9,000 K (Anderson 1989). The disassociation of molecules starts at smaller temperatures at low ambient pressures of high altitudes. At higher temperatures than 9,000 K, both oxygen and nitrogen atoms start to ionize. For this reason, it becomes necessary to construct a graphical representation for a hypersonic vehicle subjected to aero­dynamic heating because of its high speed at different altitudes having different ambient pressure in which the continuum approach still holds, Fig. 7.19 (adapted from Riedelbauch et al. 1987; Anderson 1989).

According to Fig. 7.19, the vibration energy starts before the speed of 1 km s-1, and continues up to 2.6 km s-1 which is indicated by a solid vertical line. Above 3 km s-1, the oxygen molecules disassociate at sea level and disas­sociation starts at 2 km s-1 at high atmospheric levels. The range of oxygen disassociation, indicated with dashed dotted line, occurs between 3.2 and 6.5 km h-1, at the upper levels it happens at 2.0-5.0 km h-1. As the speed increases the nitrogen molecules disassociation range changes in the speed range of 6-10 km s-1, whereas this range drops down to 5-8 km s-1 at higher altitudes as shown with dashed vertical curves. At even higher speeds and altitudes higher than 20 km, the ionization of oxygen and nitrogen, as shown with a solid curve starts. This speed is above 10.5 km s-1 at the top levels of the atmosphere. Also shown in Fig. 7.19 is the approximate re-entry orbit of the space shuttle. According to this orbit, the shuttle cruises aerodynamically and ballistically in disassocited atoms with M = 28 at altitude of 100 km, and descends down to the 50 km altitude as its speed goes down to M = 8 while moving in air molecules full of vibrational energy. At the left side of the Fig. 7.19, shown with a single dashed curve is the approximate ascending path of the space shuttle. On its way up, the
Подпись: km shuttle orbit

shuttle moves through the air molecules put into vibration by its motion, and after the altitude of 70 km it goes through a region of the atmosphere where the oxygen molecules are disassociated. After the level of 80 km the air is no longer continuous medium since the Knudsen number is above 0.1, and no-slip condition no longer prevails.

At the far right side of Fig. 7.19, shown is the path line of a space capsule, like Apollo capsule, making a re-entry at a speed of 11 km s-1 in an environment that consists of ionized oxygen and nitrogen atoms. The path of the capsule is totally ballistic, i. e., only the drag force is acting to slow it down. At altitude of 52 km, the capsule has a very high Mach number, M = 32, which creates a very strong shock to increase the temperature to the order of 9,000 K. Since the temperatures are sufficiently high, we can study the chemical reactions involved in the disas – sociation of air molecules assuming that the reactions are occurring in equilibrium, and can determine the relations for pressure, density and the temperature of the air which is no longer a perfect gas. Now, we write the law of mass action for each species involved in chemical reactions with equilibrium constants K and the stoichiometric coefficients depending on temperature (Denbigh 1978) as follows

O2 $

2O

Kp, O2 (T) =

(PO)2

PO2

(7.73a)

N2 $

2N

KpN2 (T) =

(PN)2

PN2

(7.73b)

N + O <

$ NO

Kp, NO (T)

_ PNO PNPO

(7.73c)

N + O $ NO+ + e – Kpnq+(T) = Pnq+Pe – (7.73d)

PnPo

Here, the total pressure p in terms of the partial pressures of six species is written as

p = po2 + Pn2 + Pn + Pq + Pnq + Pno+ + Pe – (7.73e)

Since the equilibrium constant for each specie involved in Eq. 7.73a is given in terms of the temperature, we can obtain the total pressure for a given temperature. We know the density from the solution of the continuity equation. Then, we can express the equation of state as a polynomial for the air at high temperatures in terms pressure, density and the temperature. There are various forms of these polynomials in open literature, however, we will be making use of the one which is prepared by Tannehill and Mugge and provided by Anderson for its convenient usage in our next example.

ExamPle 7.4 The re-entry speed of Apollo capsule is 11 km s-1 which corre­sponds to M = 32.2 at 52 km altitude. Compute the temperature behind the shock assuming (a) calorically perfect gas, (b) the chemical equilibrium is reached so that new equation of state can be used.

Solution: (a) Assuming calorically perfect gas and у = 1.4; from the temper­ature ratio we get To/T = 1 + (у — 1)/2M2 = 208. Here, the temperature before the shock at 52 km altitude T1 = T = 270.7 gives us T2 = To = 208 x 270.7 = 56,305 K! This temperature is so high and so wrong! Because, under these conditions the air is not calorically perfect and there is a considerable decrease in the temperature behind the shock because of energy used by the formation energy of the new species formed.

(b) The pressure and density ratios for after and before the shock are to be computed as p2/pi = 1,387 and p2/p1 = 15.19, respectively. In order for Tannehill and Munge’s polynomial approximations to be used at 52 km altitude we express the pressure and density with respect to sea level values. Accordingly, we find

p2/psl = p2/pj x pj /psl = 1,387 x 0.0007874 = 1.092 and P2/Ps = Pi/P x P/Ps = 15.19 x 0.0008383 = 0.01273

From those values and reading from the graph gives us T2/Tsl = 40 and T2 = 11,520 K. This gives us a more realistic temperature behind the shock. If we calculate the pressure behind the shock with equilibrium chemistry the result obtained with the calorically perfect gas does not change.

However, for the density there is a difference of 2.5-fold!

In the orbit of the re-entering capsule from moon mission shown in Fig. 7.19, argon is the only gas whose concentration, 1%, remains the same. Apart from this ionized nitrogen oxide, NO+, and electron, e—, molal concentrations do not exceed 10—3. This concentration affects the gas dynamic behavior insignificantly. However, the ionization amount is sufficient to destruct the electronical communication between the capsule and earth (Anderson 1989).

Another ballistic orbit is the re-entry path of the Mars mission, which lies outside of Fig. 7.19, and which has the approximate re-entry speed of 15 km s-1. The order of aerodynamic heating generated and problems created at this speed, naturally, require special design and analysis.

In order to obtain meaningful lift during the descent of the space shuttle, the flight path inside of the narrow enveloping curve shown in Fig. 7.19 must be followed. In the lower path of the enveloping curve the descent is fast and the lift is high to give m/(CLS) = 5,000 kg/m2, where m is the total mass, CL is the total lift and S is the lifting surface area of the shuttle. The upper route on the other hand gives m/(CLS) = 50 kg/m2. The actual intermediate path followed by the shuttle provides us approximately m/(CLS) = 500.

Obviously, the addition of chemical reactions and the equilibrium chemistry to the equations we consider further complicates the analysis, however, at high temperatures it provides us with more realistic solutions.

The difference between the solutions based on equilibrium chemistry and the calorically perfect gas assumption at high free stream Mach numbers at high altitudes not only yields different values for temperature and density but also it gives very different flow features and characteristics. Shown in Fig. 7.20 are the different shock locations in front of a circular cylinder which are obtained with the assumption of calorically perfect gas and with chemical equilibrium assumptions.

According to Fig. 7.20, the shock location obtained with the equilibrium chemistry is much closer to the body. Naturally, with the chemical reactions behind the shock, the composition of the air also changes. The changing composition of the air alters the total pressure and the gaseous properties of the air; therefore, the analysis needs to be aerothermochemical rather than aerothermo – dynamic. In addition, in our aerothermochemical analysis fast chemical compo­sition changes may force us to resort to chemical kinetics which considers the non equilibrium chemistry in flow analysis. Now, we can calculate the shock position assuming different flow conditions in front of a blunt body.

So far we have seen the effect of the equilibrium chemistry on the air composition at high temperature in hypersonic flow. The equilibrium chemistry
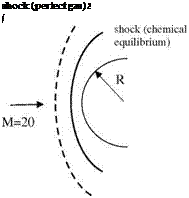
Подпись:Fig. 7.20 At M = 20 free stream and 20 km altitude shock forming before a cir­cular cylinder with assuming a perfect gas, b chemical equilibrium

assumes that throughout the flow the composition of the air changes instantly under equilibrium. At high flow speeds there are two different procedures to determine the composition of the air. These assumptions are (1) frozen flow, and (2) flow under finite chemical rates.

High Temperature Effects in Hypersonic Flow Подпись: evib Подпись: hv/kT RT ghvjkT _ 1 Подпись: (7.74)

In frozen flow, because of high speeds, the air molecules are assumed to continue to flow without undergoing chemical reaction. Because its composition does not change, the flow is assumed to be frozen. In reality, however, the chemical reactions take place with a finite rate that is the flow composition is between the frozen and the equilibrium chemistry. For this reason we resort to chemical kinetics, which deals with the chemical reactions happening with finite rates and finding the rates of reaction experimentally and/or theoretically. As we have done before, let us start from the vibrational energy of a diatomic gas like oxygen molecule O2 which becomes effective above 800 K. Equation 7.70 gave us the vibrational energy of a diatomic gas as follows

Подпись: devib dt Подпись: 1 s Подпись: eq e vib Подпись: evb Подпись: (7.75)

The physical model which explains the reason for the vibrational energies of diatomic gas molecules is the collision between the enough number of molecules as the temperature rises to make Eq. 7.74 to become active. In practice, however, the air molecules behind the shock do not start to vibrate immediately. There has to be some time to pass for a molecule to be in complete state of vibration. The previous vibration state of the molecule affects the vibrational energy of the molecule at current time t. Therefore, we need to model the time dependent vibrational energy change for the molecule with a first order differential equation as follows

Here, s is the relaxation time which depends on the pressure and the temperature of the air as follows (Vincenti and Kruger 1965).

Подпись:_ cexp(K2/T )1/3

s — C

p

The values of C and K2 are determined experimentally. These values are provided for the oxygen, and nitrogen molecules for various temperature ranges by Vincenti and Kruger and summarized in Table 7.1.

Table 7.1 Relaxation time constants for vibration energies

Specie

C (atm-ps)

K2, K

Temperature range (K)

O2

5.42 x 10⁻⁵

2.95 x 10⁶

800-3,200

N2

3.58 x 10⁻⁴

1.91 x 10⁶

800-6,000

NO

4.86 x 10⁻³

1.37 x 10⁵

1,500-3,000

On the other hand, the solution of the first order differential equation, Eq. 7.75, as an initial value problem with initial condition for the vibrational energy: evib = evo at t = 0 gives us the following

evib = eVib + (ev0 – eVib) exp(-t/x) (7.77)

According to Eq. 7.77, this simple physical model allows us to solve the time dependent vibration energy for the same specie with two different initial condi­tions. The first possibility is to start with an initial vibration energy which is smaller than the equilibrium vibration energy and to reach the equilibrium vibration energy. In this first case, during acceleration or ascending of the vehicle the temperature increases with the shock strength increase; therefore, the small value of the initial vibration energy increases to reach the equilibrium vibration energy. The second case, on the other hand, is encountered by a re-entering vehicle at very high temperatures, which makes the initial vibration energy higher than the equilibrium vibration energy which is reached by slowing down of the vehicle together with the decrease in temperature.

Now, we can analyze the time dependence of vibration energy given by Eq. 7.77 as a graph provided in Fig. 7.21. According to Fig. 7.21, in the case of re-entry very high speeds create very high temperatures with high initial vibration energy reaching its equilibrium by time. On the other hand, during ascend and before leaving the atmosphere the species around the vehicle first have low vibrational energy and with speed up process the ambient temperature rises and the equilibrium vibration energy is reached in time. Here, in both cases reaching the equilibrium vibration energy happens in micro seconds because of the char­acter of the chemical reactions as demonstrated in the following example.

Example 7.5 Obtain the time dependent expression for the vibration energy of pure oxygen molecules at 1 atmosphere pressure and 3,000 K. Find the time elapsed for the difference between the initial vibration energy and the equilibrium vibration energy to drop to value of 1%.

High Temperature Effects in Hypersonic Flow image186 Подпись: » t

Fig. 7.21 Time dependence of vibration energy

Solution: From Table 7.1 the relaxation time s = 1.13 x 10 6 s. Equation 7.77 the gives

e-t/s = 0.01

and,

t = 1.13 x 10-6 x 4.60 = 5.20 x 10⁻⁶s.

As seen in the example, the passage from higher energy levels to equilibrium energy level takes place in micro seconds. This means non equilibrium vibration energy changes take place 2 or 3 order of magnitude faster than the solution of unsteady flow equations. This in practice means that the one step time resolution of the unsteady flow solvers is more than enough to reach equilibrium in time dependent treatment of non equilibrium chemical reactions using chemical kinetics.

Now, we can look at the rate of chemical reactions taking place at high tem­peratures, and compare the differences between the results obtained for the flow field with equilibrium chemistry.

Previously, we have given the equilibrium chemistry equations, Eq. 7.73a, d used for air at high speeds. Now, we can construct a new set of equations in which catalyzing effects of M molecules will be used. In the reactions considered here the catalysis is possible either with the reacting molecules themselves, or molecules from outside can act as catalisors. When we give the chemical reactions for the air molecules, we also provide the relevant catalisors in the form of a table. Naturally, with the aid of different catalisors the chemical reaction speeds will be quite different. The following four reactions will take place with different catalyzing agents as follows

(1)
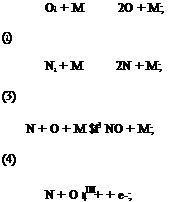
Подпись: O2 + M 2O + M; (2) N2 + M 2N + M; (3) N + O + M $f3 NO + M; (4) N + O $4Ш+ + e-; Подпись:dd°! = 2kf 1 [O2][M]- 2kb1 [O]2[M] ^N1 = 2kf2 [N2][M]- 2kb2[N]2[M] d[NO! = kf 3 [N][O][M]- kb3 [NO][M] ®+] = kf4 [N][O]- kb4 [NO+]

Подпись: Table 7.2 The coefficient of reaction speeds at high temperatures Reaction Catalisor Cf gf Kj/k (K) Temperature range (K) (1) O2 1.9 x 10²¹ -1.5 59,500 2,800-5,000 (2) O2 1.9 x 10¹⁷ -0.5 113,000 6,000-9,000 (3) NO 7.9 x 10²¹ -1.5 75,500 3,000-8,000 (4) - 6.5 x 10¹¹ 0 31,900 4,000-5,000
The coefficients kf and kb, the forward and backward reaction rate coefficients of Eq. 7.78a-d are obtained experimentally. In addition, in reactions ranging from (1) to (3), the different M atoms working as catalisor provide different reaction rate coefficients. For only Eq. 1, we can write five different equations. That is in order to obtain 2O; N, NO, O, O2 and N2 get into chemical reaction with O2. Similarly, in order to obtain 2N, reaction (2) has to undergo 5 different sub reactions, and to get NO, reaction (3) must undergo three different sub reactions.

Now, let us see how the reaction rate coefficients are calculated. The proper Arrhenius equation for the forward reactions depending on temperature T can be written (Vincenti and Kruger 1965) as follows

kf = CfT^f exp (-Kf /kT) (7.79)

Using the Vincenti and Kruger’s data, the reaction constants for reaction (1) to (4) are provided in Table 7.2

Now, we can plot the forward reaction rates for chemical reactions (1) and (3) in terms of temperature given at Table 7.2, Fig. 7.22. According to the graphs in Fig. 7.22, formation speed of 2O from O2 becomes different from the formation speed of nitrogen oxide from oxygen and nitrate above 3,500 K. At 5,000 K, this difference is as high as one order of magnitude. This means, at high temperatures the disassociation of oxygen molecules is much faster compared to the production of nitrogen oxide from disassociated oxygen and nitrogen if reactions (1) and (3) are considered alone.
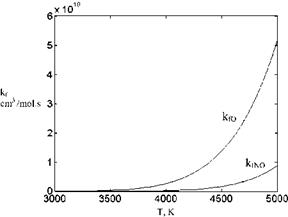
image187Fig. 7.22 Comparison of the forward reaction rates of dis – association of oxygen with formation of nitrogen oxide

High Temperature Effects in Hypersonic Flow Подпись: [< ± K [O2]eq RT p Подпись: (7.80)

As we give the type of reactions with Eqs. 7.78a-d, we also give the relevant forward and backward reaction rates. The Arhenius equation, Eq. 7.79, is the formula to be used to calculate the forward reaction rate. Backward reaction rates, kb, on the other hand, can be found from equilibrium chemistry. If we write the concentrations at chemical equilibrium using Eq. 7.78a, in terms Kp we obtain

Подпись: d[O] dt Подпись: 2kf [O2] K— [O]2} [M] Подпись: (7.81)

Now, we can use Eq. 7.80 in Eq. 7.78a to get

For the remaining reactions the backward reaction rates can be obtained similarly.

Now, let us formulate the one dimensional reacting flow with chemical kinetics as the simplest flow case. Let Mt be the molal weight of specie in chemical reaction. The mass rate of the same specie will be given by the aid of Eq. 7.81 as Wi = Mj-jjli. The same specie has its partial density, pt, change with the flow velocity in terms of the continuity equation as follows

0pi/0t + O(piu)/Ox = wi (7.82a)

The total sum of partial densities of the species gives the average density of air ^2 Pi = p. In terms of the mass fraction of the species c, = pjp, Eq. 7.82b

i

becomes

0ci/0t + ubci/Ox = Wi / p (7.82b)

In addition, the vibration energy in terms of mass fraction reads as

0cievib/0t + u0(cievib)/0x = ci(elqb – evib)/s (7.83)

The governing equations: continuity, momentum, and energy equations then, respectively, read as

0p/0t + 0(pu)/0x = 0

(7.84)

pOu/Ot + Op/Ox + pu0u/0x = 0

(7.85)

pOe/Ot + pOu/Ox + puOe/Ox = 0

(7.86)

Here, e is the total internal energy and, p is the total pressure. The relaxation time s of the chemical kinetics is used as a constraint in time discretization. During numerical solution, the time step must be one order of magnitude less than the value of s predicted for that time step.

Speed, km s 1

Alt. km

Shock radius, m

Chem kin

Equilb. chem.

Frozen Flw. Ideal Flw

5

66

0.33

0.0676

0.0625

0.089 0.113

7.5

66

0.21

0.0666

0.0461

0.0805 0.108

Table 7.3 Shock distance for different air models

Non dimensional shock distance, d/Rs

In this way, we can model the fastest changing energy in the time dependent reacting flow. Here, the time step taken can be very small, the reactions may take place very fast, and the reaction rate coefficients can be very large to make the differential equations ‘stiff’. We have to resort to special numerical solution techniques for the stiff differential equations (Hoffman 1992).

Подпись: e Подпись: E< Подпись: RiT High Temperature Effects in Hypersonic Flow Подпись: (A hf )0 Подпись: (7.87)

The system of differential equation 7.82-a-7.86 solved with the proper initial conditions gives us q, u and e values and also c, and the vibration energy of ith specie. The temperature T of the medium can be found from ^,с, е = e relation as follows

Here (Ahf)°is the effective reference energy of the specie i, and is known as the heat of formation of specie i. The heat of formation for each specie can be obtained from JANAF (Joint Army Navy Air Force) tables.

Now, we can see the two dimensional application of the theory on a blunt body with addition of 16 species equation added to Eq. 7.78a for calculating the flow field interacting with chemical kinetics (Hall et al. 1962). Hall et al. used the theory on flow about the sphere, and compared the solutions with the ideal flow solutions obtained at different altitudes and free stream conditions. The results obtained are compared in Table 7.3 for two different free stream speeds at the same altitude.

According to Table 7.3, chemical kinetics give the shortest shock distance. The time dependent reactions put the shock a little further from the body, the frozen flow pushes the shock even further. The ideal flow solution gives the maximum shock-body distance.

Viscous Hypersonic Flow and Aerodynamic Heating

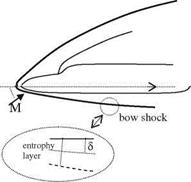
Подпись: Fig. 7.14 Bow shock, entropy layer and the boundary layer around a blunt body in hypersonic flow image175

There are two important reasons to consider the real gas effects in hypersonic flows. The first reason is to predict the viscous drag on the body, and the second is to determine the heating caused by the high velocity gradients of the very high free stream speeds which is to stagnate on the body. The heating effect is much more at the stagnation points of the slender bodies as compared with that of blunt bodies. For example, the heating at the nose of a re-entering slender body is three times more than that of space shuttle (Anderson 1989). On the other hand, the drag caused by the strong detached shock is very high. However, the skin friction drag becomes higher for the slender bodies because of having thinner boundary layers as opposed to the boundary layers of blunt bodies. In addition, we have to keep in mind that because of low density yielding low Reynolds numbers, the boundary layers of hypersonic flow must be thick compared to the low speed flows which is somewhat contrary to the common practice. Moreover, behind the detached shock occurring at the nose of a blunt body there exist a layer in which the entropy change is strong. This layer is thicker than the boundary layer and the entropy gradient in this causes extra vorticity even outside of the boundary layer as shown in Fig. 7.14. The Crocco

theorem gives the relation between the entropy gradient and the vorticity generated by this gradient as follows (Liepmann and Roshko),

Vxm = —T grad S (7.48)

For this reason, while studying the hypersonic flow about a blunt body, the entropy change must be considered.

image176 Подпись: x fP7 /PW —R~e pw Pe Подпись: (7.49)

Now, it becomes necessary to derive the formula for the boundary layer thickness in terms of the Reynolds and the Mach numbers of the flow. As we recall from the incompressible viscous theory, the boundary layer thickness d is inversely proportional with the square root of the Reynolds number, i. e., at station x the boundary layer thickness: d / хД/R. In the compressible boundary layer both the density and the viscosity changes considerably with temperature. Therefore, let us write the Reynolds number in terms of the viscosity and the density at the station x on the surface d / x/ppwUex/pw. Here, the subscript e refers to the boundary layer edge and w denotes the wall conditions. Now, we can write the boundary layer thickness as follows:

Viscous Hypersonic Flow and Aerodynamic Heating Подпись: (7.50)

According to the boundary layer assumption, the pressure remains constant at a given station. Therefore, with the perfect gas assumption we have pe/pw = Tw/Te, and by assuming linear dependence of viscosity on absolute temperature Eq. 7.49 becomes

If we assume the wall temperature as the adiabatic stagnation temperature at high Mach numbers, the relation between the temperature ratio and the edge Mach number becomes Tw/Te % (y — 1)/2M2, and the hypersonic boundary layer thickness reads as

Подпись:d M2e

x Re

According to Eq. 7.51 the hypersonic boundary layer thickness is proportional with the square of the Mach number.

We have seen that the boundary layer thickness in hypersonic flows grows very thick. For a flat plate at zero angle of attack, on the other hand, the pressure remains the same along x. Is this still possible for very large Mach numbers? The answer to this question lies in the parameter defined as v = pC—=.

If we assume that the viscosity linearly changes with temperature in the boundary layer, we can write pe/pw = CTe/TW. Let us denote the displacement thickness of a boundary layer at zero angle of attack with d*. The slope of the

surface because of the displacement thickness then reads as he = dd*/dx. According to the Piston theory, for Ив ^ 1a linear approach gives us the pressure distribution from Eq. 7.26 as follows

Pw =Pi = 1 + уИв = 1 + yMdd*/dx (7.52)

Here, at high Mach numbers the slope в for the adiabatic wall conditions can be approximately written as dd*/dx ffi (у — 1)/2M2/C/vR and when substituted in Eq. 7.52 to give

PwlPi = 1 + у(у — 1)v/2 (7.53)

This interaction is called the weak interaction.

For strong interaction, i. e. for Mh ^ 1 (Hayes and Probstein 1966) we obtain

Pw/Pi ffi у(у + 1)M2(dd*/dx)2/2 (7.54)

The slope в for the flat plate is dd*/dx % [(у — 1)/2]1/2(M2C/Re)1/4 (Anderson 1989). Hence, for the strong interaction we have

Pw/Pi у(у2 — 1)/2V (7.55)

For both, weak and strong interaction the surface pressure formula for the specific heat ratios of у = 1.4

Pw/Pi ffi 1 + 0.464v (7.56)

Подпись: Fig. 7.15 Hypersonic flow interaction around a flat plate image177,image178

The Reynolds number depends on x, and in Eq. 7.56 the Reynolds number is in the denominator of the second term which means around the leading edge that term becomes very large and the wall pressure becomes very large. As a result of viscous interaction, the pressure around the leading edge becomes very high compared to the pressure of the ideal flow. This is the indicative of very high drag and intense heating around the leading edge for the case of hypersonic flows. The depiction of this interaction in terms of the wall to free stream pressure ratio for the flow about a flat plate is shown in Fig. 7.15.

Shown in Fig. 7.15 is the hypersonic strong viscous interaction at the leading edge of the flat plate to create induced pressure zone. Since there is a considerable pressure change at the leading edge region the analysis of the boundary layer in hypersonic flow must be quite different from the classical approach. In addition, since the interaction at the leading edge region is strong, the effect of the leading edge on the stations away from the stagnation point is still felt strongly even in the weak interaction zone. Therefore, the boundary layer solutions obtained in the weak interaction region in hypersonic flow is quite different from the classical boundary layer solutions.

At the leading edge of a flat plate because of the term with 1/(x)1/2 in Eq. 7.56, the pressure theoretically goes to infinity for finite Mach numbers as sketched in Fig. 7.15. In practice however, reaching to those high Mach numbers only happens during re-entry at high altitudes where the density of the atmosphere is so low. The low density at those altitudes makes the mean free path of the air molecules quite high compared to the dimensions of the leading edge which in turn makes the assumption of continuum no longer valid. For this reason, in order to obtain more realistic results for the pressure about the leading edge, instead of continuum approach, molecular models are preferred with the slip conditions on the surface to replace no-slip conditions as boundary conditions. Using slip conditions helps reducing the pressure values with the Mach number and helps giving results in agreement with the experimental values (Anderson 1989). So far we have seen the viscous interaction for the flat plate in hypersonic flow.

Now, we can further extend the interaction analysis and give a brief summary for different type of bodies in hypersonic flow. If we know the pressure distri­bution pc over a conical surface then because of viscous interaction the induced pressure difference approximately reads as follows (Talbot et al. 1958)

P^ = 0.12*c 0 < Xc = m3 PcJR~< 4 (7.57)

Pc

Here, c denotes the potential flow conditions at the conical surface.

In hypersonic flow, the viscous interaction lowers the lift to drag ratio, L/D, by increasing Mach number. This effect is more for the blunt nosed bodies with blunt shapes as opposed to the slender bodies with wings. The maximum L/D ratio is 1.7 for a cone with half cone angle of 9° at M = 9, and it drops down to L/D = 0.5 at M = 19 (Anderson 1989). For a space capsule type of bodies, on the other hand, the L/D ranges between 0.4 and 0.2.

The serious problem of the viscous interaction in Hypersonic flow is the aerodynamic heating. First, let us study the heat transfer problem for a flat plate in high speed flow. If we let qw be the heat transfer for a unit area in a unit time, we have

qw StpeUe (had hw) (7.58)

Here, St is the dimensionless Stanton number, had and hw are the adiabatic wall temperature and the value of the enthalpy at the wall, respectively. The famous Reynolds analogy states that the Stanton number is related to the skin friction

coefficient Cf = sw/(1/2peU^) with St % cf2 (Schlichting). The enthalpy differ­ence had — hw in Eq. 7.58 is the main factor of the surface heating in high speed flows. The value of the enthalpy at the wall is the value obtained by solving the energy equation with adiabatic wall conditions. Using the engineering approach, the recovery factor r is employed to define the relations between the adiabatic wall enthalpy, boundary layer edge conditions e and the stagnation enthalpy h0 to give the following

had = he + rU2e/2 and h0 = he + U^/2 (7.59a, b)

From Eq. 7.59a, b we obtain

Подпись: (7.60)had he

h0 – he

Here, the free stream stagnation enthalpy is always greater than the adiabatic enthalpy of the wall to make r is always less than unity.

Defining the Prandtl number as the ratio between the viscous energy loss and the heat conduction, i. e., Pr = icp/k, for the flat plate in hypersonic flow condi­tions the Blasius solution gives (White 1991)

r ffi/PT (7.61)

Equation 7.61 is valid for a wide range of Mach numbers with 2% accuracy. This gives a relation between the Stanton to surface friction ratio in terms of the Prandtl number as follows

St/cf = 1/2P-2/3 (7.62)

Equation 7.62 is also valid with 2% accuracy for a wide range of Mach numbers. Although Eq. 7.62 is obtained for flows around the flat plate, it has been applied to determine the aerodynamic heating caused by three dimensional slender bodies (Anderson 1989).

In case of turbulent hypersonic flow past flat plate with increase in Mach number, there is a considerable decrease in Stanton number. According to the Van Driest’s turbulent flow data while Mach number is ranging from 0 to 10, the Stanton number decreases to 0.1 of its incompressible value.

So far we have seen the aerodynamic heating for the slender bodies with sharp leading edges. The solution for stagnation point of the flat plate was singular. Now, we can analyze the aerodynamic heating for the bodies with blunt noses. The analysis of heat transfer at the stagnation point of the circular cylinder and sphere was made by Van Driest (1952), and the following formula for the heat transfer was provided (Anderson 1989):

Cylinder : qw = 0.57P-0 6(peie)1//dUe/dx(haW – hw) (7.63a, b)

Sphere : qw = 0.763Pr -0b(pei()1/1 dUe/dx(haw – hw)

Here, Ue is the boundary layer edge velocity and it naturally takes the value of zero at the stagnation point. The derivative of the edge velocity with respect to x at the stagnation point is non zero, and it is inversely proportional with the local radius of curvature. Assuming Newtonian flow, the derivative of the edge velocity reads as

dUe_ 1 2(pe – pi)

dx R pe

Подпись: qw Viscous Hypersonic Flow and Aerodynamic Heating Подпись: 2(pe - Pi) Viscous Hypersonic Flow and Aerodynamic Heating Подпись: (7.65)

Here R, is the radius of curvature at the stagnation point (see Problem 7.32). If we substitute Eq. 7.64 in Eq. 7.63a, b, the heat transfer at the stagnation point of the circular cylinder for hypersonic flow reads as

The aerodynamic heating is inversely proportional with the radius of curvature of the stagnation point. This fact forces the hypersonic vehicles to have a round nose as shown in Fig. 7.9 of the re-entering space capsule. The change in the Stanton number at the stagnation point of a cylinder is experimentally observed to be proportional with the inverse square root of the radius of curvature as given in Eq. 7.65. Naturally, as we move away from the stagnation point, the aerodynamic heating reduces considerably. At W = 45° on the surface, halfway between the stagnation point and the shoulder, this reduction goes down to half the value of the stagnation heat transfer, and at the shoulder where W = 90°, the heating becomes the one tenth of the stagnation value (Anderson 1989).

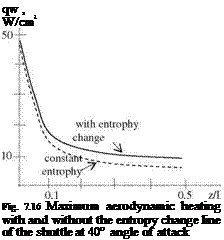
We have stressed the role of viscous effect concerning aerodynamic heating. In the no slip condition which causes high velocity gradients, i. e. high vorticity value is due to viscosity. In addition, the high entropy gradient occurring behind the strong bow shock generates a vorticity field as given by Eq. 7.48 and creates an entropy layer as shown in Fig. 7.14. The vorticity generated by the entropy gra­dient also creates non negligible aerodynamic heating starting from the stagnation point. Shown in Fig. 7.16 are the maximum aerodynamic heating values on the line, which is the symmetry line of the bottom surface of the space shuttle, with and without entropy change considered.

According to Fig. 7.16, the difference between the results obtained with entropy and without entropy is small near the stagnation region, and it increases monotonically in the flow direction as the entropy layer increases (Anderson 1989). The results obtained by considering the entropy gradient are agreeable with the experimental measurements, and therefore, they should be preferred.

The last subject to be studied in hypersonic heating is related to the interaction of the strong shock and the boundary layer. This type of heating is usually gen­erated by the oblique shock which is created at a slender leading edge of an external body of hypersonic air vehicle. Since this shock is inclined, it strikes another external part which is located at downstream, and reflects from the boundary layer to generate heat. For the first time, this type of heating is

Подпись: qw , W/cm2 Fig. 7.16 Maximum aerodynamic heating with and without the entropy change line of the shuttle at 40° angle of attack
image180

encountered because of the oblique shock created at the intake of an engine interacting with the boundary layer on the engine-body junction of a hypersonic plane in a test flight (Neumann 1972). The sketch and the effect of the k shock are shown in Fig. 7.17a, b. The variation of the Stanton number and the surface pressure are given in Fig. 7.17b around the region where the shock boundary layer interaction is taking place.

image181,image182
As seen in Fig. 7.17b, the variation of Stanton number is closely related to the surface pressure variation. Right after the k shock, the value of Stanton number at the surface increases eight times (Marvin et al. 1975). This increase in the Stanton number is the indicative of the aerodynamic heating due to shock boundary layer interaction. The surface pressure increase, on the other hand, is tenfold across the shock. Now, we can obtain the relation between the pressure change and

the aerodynamic heating using the variation of the Stanton number. In laminar flow, the skin friction coefficient Cf is inversely proportional with the Reynolds number. Since the Stanton number is proportional with the skin friction coefficient, the following relation can be deduced

St / 1/vRffi» wqe (7.66)

Since the pressure is proportional with the density, the definition of the surface heating, qw becomes

qw / pp (7.67)

to give the proportionality of aerodynamic heating with pressure.

In turbulent flows there is a relation between the surface friction and the Reynolds number as follows: Cf ^ 1/(Re)1/5 (Schlichting). The relation between the surface heating and surface pressure for turbulent flow then becomes

qw / (pe)4/5 (7.68)

Inviscid Hypersonic Flow: Numerical Solutions

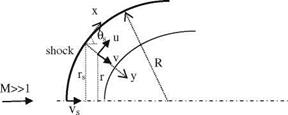
The detached shock at the leading edge of a blunt body has a slowing effect for a vehicle re-entering to the earth atmosphere. The further away the shock from the body the less will be the heating effect at the stagnation region of the flow because of the high temperature rises after the strong shock. For this reason the location of the detached shock and the flow conditions behind the shock should be known for that high Mach number flows. Wind tunnel and shock tube testings are not capable of giving sufficient data at those high Mach numbers, therefore, the real flight recordings are used in studies when available. On the other hand, the inverse method which is based on determining the body shape and the flow around it for an assumed shock shape was an efficient method at late 1950s (Van Dyke 1958). For two dimensional and axisymmetric shocks a simplified inverse method is used to find the coordinates of the body surface (Maslen 1964). Let us choose the x coordinate parallel to the shock direction and y coordinate normal to that direction to form the local coordinates, Fig. 7.8, and non dimensionalize the flow parameters with free stream conditions and the shock radius. The velocity component u in the

Fig. 7.8 The local coordi­nates of a spherical shock


image165

flow direction is much larger than the normal v component of the velocity. We can now write the equations

In nondimensional form in terms of f °f =(1 — y/R)rrpv, |f = rrpv

Continuity : 0[rrpu+0[(1 — y/R)rapv = 0, ! rr0y = —— (7.35a, b) ox oy of pu

0v. . 0v u2 1. . . 0p r0p u

y-momentum : u +(1 — y/R)v + + (1 — y/R) = 0, ! rr ffi

0x 0y R p 0y 0f R — y

(7.36a, b)

Here, r = 0 for two dimensional, and r = 1 for axially symmetric flows. If we nondimensionalize enthalpy with 1/2 U2, and show the stagnation streamline conditions with s the energy equation reads as: h + u2 + v2 = hsO + v2O. Then for the energy equation we write

Подпись: (7.37)

Inviscid Hypersonic Flow: Numerical Solutions Подпись: 0.

u2 = hSo + vfo — h — v2

After the shock on a streamline we have p/pc = constant.

Simplifying Eq. 7.36a, b with the assumption of y/R ^ 1, the relation between the pressure and the stream function gives

Подпись:0P ^ us 0f _ rrRs

Подпись: P — Ps Inviscid Hypersonic Flow: Numerical Solutions Подпись: (7.39)

Integration of Eq. 7.38 with respect to the stream function starting from the stagnation conditions fs we obtain

Neglecting the term (vO — v2) in energy equation the approximate form of Eq. 7.37 reads as

Подпись: and for r = 0,1 we get Подпись: r Sy 1 (rs - y cos 9S) = Sv pu Sy 1 (rs - y cos es) = SV Pu Inviscid Hypersonic Flow: Numerical Solutions

In order to determine the r coordinate of the body surface, we can write: r = rs – y cos hs in terms of the tangent angle hs of the shock in Eq 7.35a, b to obtain

Подпись: y Подпись: ry2 cos 0s 2rr s Подпись: Vs 1 dv rsr Pu V Подпись: (7.43)

Integrating Eq. 7.42 with respect to the stream function gives

The second term at the right hand side of Eq. 7.43 is second order, therefore can be neglected to yield

Vs

Подпись:Подпись: y1 ‘dv

rrs pu

V

Since we know the initial conditions, we can march one step to determine the new coordinate from the known stream function value as follows: (1) obtain the pressure p from Eq. 7.39, (2) find the density p on the streamline using isentropic relation, (3) The h enthalpy from equation of state, (4) the velocity component u from energy equation, and finally (5) y coordinate from Eq. 7.44. Now, let us apply the procedure described above to a spherical shock created by a body whose shape is to be determined.

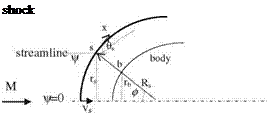
Подпись: shock

Example 7.2 For a spherical shock with radius of 1 immersed in M = oo and у = 1.4, find the flow conditions and the first body surface coordinate which has U = 30° at the center of the shock as shown in the figure below.

Solution: In order to simplify the solution, we assume that the streamline entering into the shock is oblique at with an angle 0s with existence of oblique shock relations. The pressure behind the shock then becomes: ps = 2/(у + 1) sin2 hs = 0.625, density: ps = 6, nondimensional speed in x: us = cos hs = cos (90° — 30°) = 0.5.

The stream function, since we have a uniform free stream before the shock, at s is for two dimensional flow: Ws = rs, and axially symmetric flow: Ws = r2/2. Hence: we find rs = cos ds = 0.5 and Ws = r2/2 = 0.125. Using Eq. 7.39 we can find the pressure at point b on the surface if we take the stream function value 0 as follows

Pb – Ps = Us(Wb – Ws)/R*rs = 0.5(0 – 0.125)/(1 x 0.5) then pb = 0.5.

The entropy remains the same on a streamline. This givespb/(qb)r = c = pso/(pso)r

The stagnation pressure is: pso = 2/(y + 1) = 0.8333 gives us the value of c. For W = 0 the density is pb = 4.166.

The enthalpy then becomes h = 2y/(y — 1)(p/p) = 0.840. Similarly, ho = 0.968. Using the energy equation we find the surface velocity as

ub = (ho – h)1/2 = 0.358.

Inviscid Hypersonic Flow: Numerical Solutions Подпись: £ Inviscid Hypersonic Flow: Numerical Solutions Подпись: .pu: Подпись: + V=0.0625 Inviscid Hypersonic Flow: Numerical Solutions Подпись: 0.128

Finally, we can find yb coordinate of point b that is the distance of point b to the shock, with three point accurate numerical integration as follows

This result show that the distance between the shock and the body at point b is the 13% of the shock surface. As a further practice take v = 0.0625 to find the flow conditions to determine approximate value of yb.

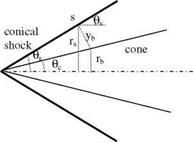
Example 7.3 Analyzing the conic shock about a slender cone at M = oo.

image167M

—– ►

Solution: The conical shock shown in the figure above can be considered as an oblique shock with radius Rs = oo. With the method of Maslen the flow conditions behind the shock can be examined in a simple manner as follows:

The pressure p = Ps + Us(W — Ws)/(Rsrs) = Ps.

The density: p = p1/c [pJ(plJy)] = ps and the enthalpy: h = hs = 2y/(y — 1)(ps/ps) From the energy equation: u = us = (hso — h)1/2.

The distance between the shock and the surface: yb = Ws/(rspsus) = rs/(2pscos 0s)

The angle between the shock and the surface: tan (0s — 0c) = ybx = sin 0J

Подпись: The distance between the axis and the surface: rb = rs — ybcos 0s = rs[1 — (2ps)—1]

(2ps cos 0s), with which the cone angle 0c can be found.

Using the formulae above for у = 1.4, free Mach number = oo, and shock angle

15° for a conical axisymmetric shock the cone angle of the body is co = 13.7°.

We also find ps = 0.0558 and ps = 6.

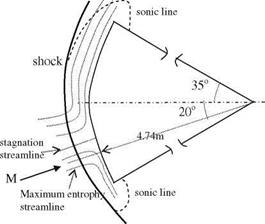
Next, we are going to study and analyze the numerical solution of a shock created by the body of known shape at an angle of attack in hypersonic flow. The 1960s were the years of the space capsules which were sent for manned missions and came back safely to earth. The numerical solutions for the preliminary studies were performed for the Euler equations expressed in spherical coordinates with a method similar to that of Godunov (Bohachevski and Mates 1966). In the numerical solutions the finite difference method was used and the shock was captured within 4-5 discrete points across which the value of the density doubles itself. Shown in Fig. 7.9 is the numerically computed shock location obtained for a space capsule having a half cone angle of 35° with a spherical nose of radius of 4.74 m, immersed in a free stream Mach number of 29 with angle of attack of 20° at altitude of 66 km.

According to Fig. 7.9, the shock location is as close as 25 cm to the nose of the body, and at the maximum 45 cm away. The computed values of the density are at the most five times and at the least 2.5 times of the free stream density. For the specific heat ratio of у = 1.4 the Rankine-Hugoniot relations also give fivefold increase of the density after the shock. Another interesting result of this study shows that the streamline having the maximum entropy is the line crossing the shock and staying between the shock and the surface which is different from the stagnation line as shown Fig. 7.9. For a symmetric hypersonic flow, on the

image168Fig. 7.9 Hypersonic flow

Подпись: about the space capsule with M = 29, a = 20°. ‘‘Rep-rinted with permission of the American Institute of Aero­nautics and Astronautics’’

other hand, the maximum entropy line coincides with the stagnation streamline (Anderson 1989).

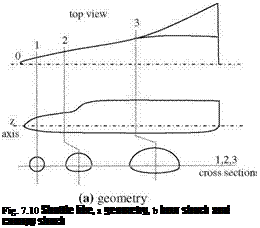
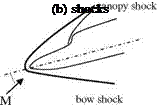
In the early 1970s, flow analysis around space shuttle type configurations started to appear in literature, by numerical solutions of Euler equations (Kutler et al. 1973). The aim of this type of detailed study was to numerically predict the hypersonic inviscid flow with multi shocks about the shuttle re-entering earth’s atmosphere at high angles of attack. These studies included calculating the effect of the interaction of the bow shock of the fuselage with the shocks created by the canopy and wings. Since the Rankine-Hugoniot relations are not capable of analyzing this type of complex interactions of shocks, shock capturing methods like MacCormack’s is resorted to march in the direction of the flow as a low memory requiring technique (Kutler and Lomax 1971). In their study, Kutler et al. cast the steady Euler equations in curvilinear coordinates in conservative form and marched in the flow direction step by step in accordance with the CFL (Courant Friedrichs Levy) using the finite difference method. Their solutions were second and third order accurate, and were compared for convergence concerning the resolution. The shuttle like geometry considered in their study had a spherical and a conical surface at the nose, and tangent to that two half expanding ellipses with their major axis coinciding; the flat bottom ellipse and the not so flat top ellipses as shown in Fig. 7.10.

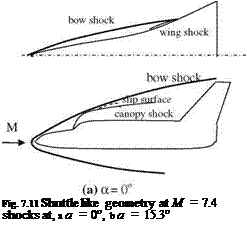
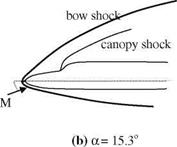
The numerical solution is first made for spherical-conical nose section shown in Fig. 7.10 as the region between the cross sections 0 and 1. The solution obtained at cross section 1 is given as the initial condition for the hyperbolic equation which is then solved by marching by MacCormack scheme until the desired cross section is reached. The numerical results for the position of shocks are provided in Fig. 7.11a, b at two different angles of attack for the free stream Mach number of M = 7.4.

Подпись: Fig. 7.10 Shuttle like, a geometry, b bow shock and canopy shock image170

As seen in Fig. 7.11a, at zero angle of attack the bow shock interacts with the weaker canopy shock to generate a slip surface across which there is no pressure difference but velocity difference. The slip surface is only apparent for third order

Подпись: Fig. 7.11 Shuttle like geometry at M = 7.4 shocks at, a a = 0°, b a = 15.3°
image172

accurate solution. In addition, the bow shock and the weaker wing shock interacts above the wing surface to make the bow shock almost tangent to the tail.

Shown in Fig. 7.11b is the flow field for 15.3° angle of attack at which the bow shock and the canopy shock do not interact and the bow shock is located way over the tail. At zero angle of attack, the surface pressure coefficient is eight times the free stream pressure right after the canopy shock.

In the beginning of 1990s, ESA (European Space Agency) also sponsored hypersonic flow studies past shuttle like double ellipsoid shapes solved with unsteady Euler (Molina and Huot 1992). This time the finite element method is employed in discretizing the domain of flow for which even viscous effects are also accounted for (Zienkiewicz and Taylor 2000). We can cast the time dependent Euler equations in appropriate form applicable to two dimensional hypersonic flows by defining the energy as e = h — p/p + 1/2(u2 + v2) to give continuity, energy and x and y momentum, respectively, as follows

P, t + (Pu),x +(PV),y = 0;

(p e),t + [(P e + p)u],x+[(P e + p)v],y = 0; (7.45a, b)

(Pu),t + (pu2 + p),x + (Puv),y = 0;

(pv)/ + (puv)x +(pv2 + p),y = 0 (7.46c, d)

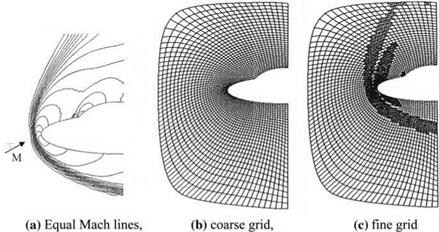
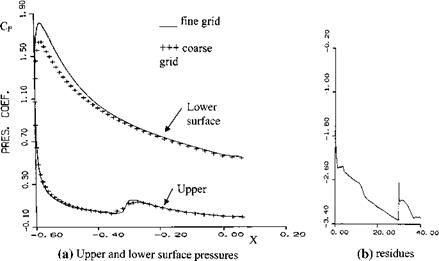
Shown in Fig. 7.12a is the flow field in terms of the Mach equal Mach lines around the double ellipse obtained by the finite element method at M = 8 and 30° angle of attack. The results are obtained by an adaptive scheme using the coarse grid first as shown in Fig. 7.12b. Afterwards, automatic remeshing is used at high gradient regions to get a finer grid as shown in Fig. 7.13c. In Fig. 7.13a, comparison of surface pressure coefficient is shown for the coarse and fine grids. Fine grid solution indicates that the suction is more at the lower surface and the

image173

Fig. 7.12 At 30° angle of attack and M = 8, a equal Mach lines, b coarse, c fine grid

canopy shock is stronger at the upper surface. Shown in Fig. 7.13b is the density residues before and after the adaptive mesh refinement.

The forward time and the finite element discretization of Eqs. 7.45a, b-7.46c, d in indicial notation become

J W(Ut+At – UAt)dQ = – At J (W + )Fi, idQ, i = 1,2 (7.47)

X Q

image174

Fig. 7.13 Double ellipse solution a surface pressure coefficient, b residues

Here, W is the weighing function, U = (p, pe, pu, pv)T is the unknown vector,

О ПГ О ПГ

F1 = (pu, (pe + p)u, pu + p, puv) and F2 = (pv, (pe + p)v, puv, pv + p) show the flux vector. In addition, At = 9F/ 9 U is the Jakobian of the fluxes and s AjW, j is the artificial viscosity. In terms of the element length h, local velocity magnitude |u|, and the local speed of sound c we can write s = 1/2 h/(|u| + c). On the other hand, Eq. 7.47 can not handle the numerical oscillations around the shock. Therefore, we add the term ^22=1(W,!U,!) into the integral at the right hand side. Here, k is proportional with the square of the element length h and gradient of the local velocity magnitude (see Problem 7.26).

So far, we have seen the hypersonic flow analysis based on the inviscid theory which does not take real gas effects into consideration. From now on in our analysis both the viscous effects and the disassociation caused by the heating of the air because of high speeds will be considered together with comparisons with the inviscid solutions.

Improved Piston Theory: M2s2 = O( 1)

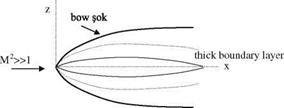
The leading edge shock of a thin airfoil is not weak even if it is attached. Therefore, it creates non negligible turning in the flow field. When this turning angle is multiplied with free stream Mach number, the product is usually in the order of unity, i. e., Мв * 1, similarly Ms * 1. For these cases we need a valid theory especially for the lifting surfaces in hypersonic aerodynamics, Fig. 7.7.

The development of the pertinent theory is based on the order of magnitude analysis performed on the unsteady Euler equations in terms of the Hayes’ simi­larity parameter. In this way we can obtain an expression for the unsteady lifting pressure for thin airfoils in hypersonic flow (Van Dyke 1954). Using the Van Dyke’s small perturbation theory it is possible to obtain the lifting pressure for arbitrary motion of an airfoil at high Mach numbers with small turning angles with utilization of shock formulae (Pierce 1978).

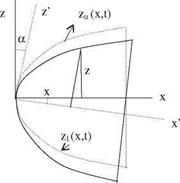
Let zv (x, t) = zo (x) f(t) be the equation of the chord motion of the profile shown in Fig. 7.7. The equation of the upper surface for small angle of attack a becomes

z — [z-(x) — ax + zv(x, t)] = 0 (7.28)

If the turning angle at the leading edge is hH, then for the upper and lower surfaces

= – —a and hi = l +a, (7.29)

dx x=0 dx x=0

respectively. The ratio between the value of the pressure right after the leading edge shock and the free stream pressure in terms of the shock angle b reads as (Liepmann and Roshko),

— = — [(bM)2 — 1] + 1 (7.30)

Подпись: Fig. 7.7 The attached bow shock and a thick boundary layer about a thin airfoil in hypersonic flow
image162

Pi c + 1

Подпись: d(x) Подпись: h(x) Подпись: dz0 ,i , . . .0f(f + x/U) -if (' + x/U)+a(x)f-g7/—) Подпись: (7:31)

Here, b is the shock angle created by the leading edge turning angle dH and d(x) is the inclination of the surface given as

Now, we can enumerate the application areas of Eq. 7.34 as follows (Pierce

1978) .

1. As long as the angle of attack is small, the hypersonic similarity parameter satisfies the criterion and Eq. 7.34 is applicable for the flow past profiles with sharp trailing edges.

2. The Prandtl-Meyer expansion formula is used to obtain Eq. 7.34 for hypersonic flows with small turning angles. If the turning angle increases, the error also increases, therefore, it has to be corrected by exact shock formulae.

3. Equation 7.34 can be used for finite wings with the concept of strip theory. However, the strip theory is not valid at the sharp wing tips, and it is not capable of modeling the low aspect ratio wings with high sweep angle.

4. Profiles with round leading edges have detached shocks which makes the application of piston theory and the Prandtl-Meyer theory non valid. Therefore, we need to use some other formula for profiles with blunt noses.

The next step is studying the effect of the detached shock created by the round leading edge and the hypersonic flow field after the shock to numerically evaluate the surface pressure of some special geometry.

The Piston Analogy

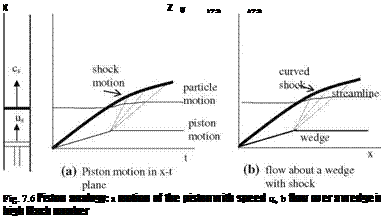
Airfoils and control surfaces are thin and/or slender objects which cause free stream to make small angles with leading edge shocks and expansion waves when
the flow fields expand for Mach numbers grater than 4. For this reason, (1) the changes of speed in free stream directions are negligible compared to the speed changes in normal to free stream, and (2) similarly, the gradients of the flow parameters in the direction of the free stream are negligible compared to the gradients in normal direction. These two facts leads to following ‘in the unsteady flow around thin bodies a fluid column normal to the free stream moves in the flow direction while continuing its unsteady motion’. This fact was first observed by W. D. Hayes. Therefore, it is named ‘‘Hayes’ Hypersonic Analogy’’.

Using the Hayes’ Hypersonic Analogy, the pressure variation of two dimen­sional flows past an airfoil can be expressed in terms of the pressure change due to the waves created by unsteady motion of a piston in one dimensional cylinder (Lighthill 1953). Now, let us study in detail the approach given by Lighthill (Liepmann and Roshko).

According to the similarity law deduced from Fig. 7.6, the surface pressure ratio to the free stream pressure can be obtained using the concept of simple wave created by compression as follows (Liepmann and Roshko)

The Piston Analogy Подпись: (7.22)

Here, w shows both the piston velocity and the vertical velocity at the wedge surface, and a indicates the sound of speed at the free stream. For Eq. 7.21 to be valid the flow must be isentropic which is possible only for the case of small perturbations. In addition, the vertical velocity w given by Eq. 7.21 is also valid for the unsteady flows. Let z = za (x, t) be the equation of the surface. The asso­ciated vertical velocity is then given by

Now, we can obtain the application areas of Eq. 7.21 to a profile with a thickness ratio of s with the free stream Mach number. Let в be the turning angle of the flow and w be the vertical velocity because of presence of the airfoil. The approximate value of the vertical velocity then becomes

w^Uh = aMh

This can be written as

w

ffi Mh (7.23)

The product Mh of Eq. 7.23 is called the hypersonic similarity parameter. The validity of the piston theory depends on this parameter. For piston theory to be valid, the hypersonic flow parameter must be very much less than 1. That is ‘the non dimensional turning speed in piston theory is restricted by the product of Mach number and the turning angle’.

Подпись: p w y(y + 1) ffi 1 + c + Pi a 4 Подпись: 2 c(c + 1) /w3 12 a) Подпись: (7.24)

Now, we can expand the right hand side of Eq. 7.21 into the series expressed in terms of w/a

Equation 7.24 is applicable for the hypersonic similarity parameter range 0 < Ms < 0.6. The lower order approximation can be made for 0 < Ms < 0.3 by neglecting the third term as

Подпись: 2Подпись: (7.25)p w y(y + 1)

ffi 1 + c +

Pi a 4

Finally, the linear approach is valid for 0 < Ms < 0.15, and reads as

— ffi 1 + c w (7.26)

Pi a

Including the thickness effect of the airfoil gives better results for the piston theory when compared with the experimental results (Ashley and Zartarian 1956). At high Mach numbers the high flow speeds make the local density low. The low density, on the other hand lowers the value of the Reynolds number which in turn causes the boundary layer thickness to be high. This forces us to consider the profile thickness during the application of the piston theory on hypersonic flows. In addi­tion, in unsteady hypersonic flows there must also be restriction on the free stream Mach number M and the reduce frequency k as follows (Ashley and Zartarian 1956):

kM2 » 1 or (kM)2 » 1 (7.27)

The criterion given by Eq. 7.27 show that the piston theory is safely applicable at high reduced frequencies.

The piston theory introduced so far is applicable for Ms < 1 range. In real life, however, even for thin profiles we encounter some cases with Ms > 1, which will be examined in the next section.

Unsteady Newtonian Flow

During the re-entry and hypersonic cruise the unsteady motion of the hypersonic vehicle is unavoidable. For this reason we have to determine the unsteady hypersonic aerodynamic coefficients in terms of time dependent pressure variation. Now, let us obtain the pressure coefficient expression of a body whose equation is given by B(x, y,z, t) = 0, has an instantaneous velocity of qB and is immersed in a free stream U as shown in Fig. 7.5.

Unsteady Newtonian Flow Подпись: (7.15)

If we denote the unit normal vector into the body with n then the normal velocity of the fluid particle that striking the surface of the body reads (Ui — qB).n. Afterwards, we can write the mass of the fluid particle which strikes onto the unit surface area in unit time becomes p (Ui — qB).n. According to the Newtonian impact theory, the momentum acting onto the surface of the body then becomes

The surface pressure coefficient at high Mach number is expressed from Eq. 7.15 as

image157Fig. 7.5 Body B(x, y,z, t) = 0 z n„

moving by velocity qB in a

Подпись: freestream of U

U

image158
Подпись: (7.16)

Let us now write the unit normal vector n = li + mj + nk in terms of the direction cosines l, m, n of the surface equation B(x, y,z, t) = 0 as follows

Here,

Подпись: OB OB OB1/2 Ox + Oy + Ox ’IgradB|

Подпись: п Подпись: grad B IgradB| Подпись: and i. п Подпись: OB -/igrad BI

Unit normal n reads as

Подпись: qB~ Unsteady Newtonian Flow Unsteady Newtonian Flow Unsteady Newtonian Flow Подпись: Igrad B| Подпись: (7.17)

Let us express the instantaneous velocity qB in terms of its rectangular compo­nents qB = qxi + qyj + qzk. The normal component of the instantaneous velocity then reads as

If we assume that the body is rigid, then the shape of the body does not change but its position does in time. Therefore, dB/dt = 0 can be written as

Подпись:OB OB OB OB

dB/dt = O + qx Ox + qy U + qz OZ =0

Подпись: Cp Подпись: r OB_ 1 SB]2 2 L 5x U 5t Igrad B|2 Подпись: (7.19)

If we substitute Eqs. 7.17 and 7.18 into Eq. 7.16, the pressure coefficient then becomes

Writing the surface equation in terms of z, the equation becomes B = z — z1 (x, y,t) = 0.

O B Oz1 O B Oz1 O B Oz1

Ox Ox ’ Oy Oy ’ Ot Ot.

Подпись: Cp Unsteady Newtonian Flow Подпись: (7.20)

The surface pressure coefficient then reads

Подпись: x’=x cosa - z sina z’=x sina + z cosa
image159

Example 7.1 The surface equation of a body is given by z = a(x/l)1/2, 0 < x < l. If this body pitches by a = a sin ю t about its nose in small amplitudes, find the surface pressure variation with time.

Solution: Let x, z be the fixed and the x’, z! be the rotating coordinate system. If we write the surface equation in terms of the fixed coordinates x, z then we have

image160‘ ‘ л 1 =2 x cos a — z sin a

zu = a(x ll) = a l———

Now, we can write B(x, z,t) = z’ — zu’ = 0 to give

(x cos a — z sin a112

B(x, z, t = x sin a + z cos a — a = 0.

Since the pitching oscillations are small, sin a = a and cos a = 1 yields

(x — za 1|2

B(x, z, t)=xa + z — a –

Now, we can use the last expression for B to be used in Eq. 7.20 to obtain the unsteady surface pressure coefficient. Here, we have to make a note that even a is small the Newton theory is non linear because of the last term in surface equation.

The Newton and the modified Newton theories are widely used for blunt bodies in engineering applications. For slender bodies, however, the Piston Analogy gives good results for the surface pressure expression in a hypersonic flow.

Improved Newton’s Theory

The Newton’s impact theory gave us the surface pressure coefficient, Eq. 7.6, for the straight wall. On the other hand, experimental results show that the impact theory is also applicable for the blunt bodies in high Mach numbers. We know that at a high subsonic flow there is a strong detached shock in front of the stagnation point. If we use that stagnation pressure as a coefficient in Eq. 7.6, we get agreeable results between the Newton’s impact theory and experiments for hypersonic flow.

If Cpo denotes the stagnation pressure coefficient of the blunt body, the improve form of Eq. 7.6 reads as

Cp ffi Cpo sin2 dw (7.7)

At the stagnation point hw = p/2. This makes Eq. 7.7 yield better results than Eq. 7.6 for the hypersonic flows.

Assuming the detached shock in front of the stagnation point as a normal shock and using the normal shock relations in terms of the Mach number and pressure,

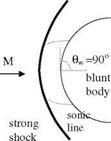
Fig. 7.2 Flow about a blunt body at high Mach numbers

image151it is possible to obtain the stagnation pressure to be used in Eq. 7.7 (see Problem 7.1). Improved Newton formula gives good results for the high angle of attack flows with high wall angles. Shown in Fig. 7.2a is the parabolic surface given by x = 0.729y2 — 1.0, and in Fig. 7.2b is the surface pressure coefficient plots obtained by Newton and improved Newton formula at M = 8.
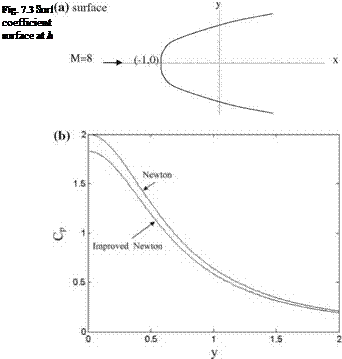
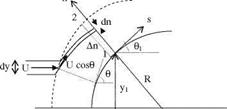
image152

The surface curvature effect is not taken into account in Eq. 7.7 when applied to a surface given in Fig. 7.3 while computing the surface pressure coefficient. For this reason it seems it is necessary to add the centripetal force effect in Eq. 7.7. In order to express the relation between the centripetal force and the normal component of the pressure gradient, it is convenient to use s-n coordinate system

Fig. 7.4 Balancing of the centripetal force with pres­sure gradient

image153"where s is the tangential and n is the normal coordinates. The centripetal force acting in a unit volume is pV2/R where V shows the flow speed and 1/R shows the radius of curvature. The pressure force gradient which balances the centripetal force can be written as

Подпись:Op pV2

On R

The continuity equation applied for a tube across the shock to equate the mass flux before and after the shock gives pVdn = p? Udy where U is the free stream speed and p? density, Fig. 7.4.

Improved Newton’s Theory Improved Newton’s Theory Подпись: (7.9)
image154

Integrating Eq. 7.8 from point 1 at the surface to the point 2 without crossing the shock along An gives

If we use the continuity equation in Eq. 7.9 we obtain

У1 +An cos 01

Подпись:f p – UV d

P2 – P1 = – R dy

0

Taking the limit as An approaches to zero in Fig. 7.4, and expressing the radius R in terms of tangent angle 0 to the surface with V = U cos 0 gives

y1

P1 = P2 + p-U^d0) sin 01 cos 0dy (7.11)

Equation 7.11 in terms of pressure coefficient reads as

CP1 = CP2 + 2^“^ sin 01 cos 0dy (7.12)

Now, we can express Eq. 7.12 in terms of the pressure coefficient at point 2, shown in Fig. 7.4 at which the curvature effect is no longer exists, as follows

Improved Newton’s Theory

(7.13)


image156 Подпись: (7.14)

For axially symmetric bodies the expression reads as

The theory developed by the centripetal force inclusion in evaluation of surface pressure is name the Newton-Busemann theory. Although inclusion of the cen­tripetal force seems correct because of physical considerations, it makes the pressure coefficient more disagreeable with the experimental results. The second term of the right hand side of Eq. 7.13 is just a theoretical term, i. e., it is not related to effect of the pressure waves increasing compressibility in the flow direction (Anderson 1989), which makes its implementation rare in engineering applications.

Newton’s Impact Theory

The amount of pressure exerted on a surface with impinging flow is equal to the normal component of the momentum exerted by the impinging fluid particles. The theory proposed by Newton and based on this impact idea was interpreted, until the beginning of twentieth century, as the cause of the aerodynamic force acting on flying objects! The impact theory on the other hand was not able to produce sufficient lifting force to balance the weight of flying creatures in nature. Naturally, during the years of the emergence of the impact theory and for the following couple of centuries to come the relation between the air speed and the compressibility of air was not known. Therefore, by shear coincidence the eval­uation of surface pressure coefficient with the impact theory, independently from the Mach number itself, at very high Mach numbers was given in the first half of the twentieth century (Hayes and Probstein 1966). Now, let us evaluate the pressure exerted by the impact theory on a wall inclined with angle 0w in a freestream speed of U. The amount of mass per unit time per unit area of the air particles striking the wall, shown in Fig. 7.1, is pUn. The momentum exerted on the wall by this air mass is p(Un)2 which is also equal to the pressure exerted.

Expressing the wall pressure in terms of the free stream speed we obtain

p = pU2 sin2 Qw (7.1)

If the area of the wall shown in Fig. 7.1 is S, and the region behind the wall is considered as a vacuum, the normal force acting on the wall becomes

N = pS = SpU2 sin2 Qw (7.2)

Подпись:image150Fig. 7.1 Velocity compo­nents of the fluid particles impinging on a wall at a free stream speed of U

Подпись: CN Подпись: N 1/2pU 2S Подпись: 2 sin2 dw Подпись: (7.3)

The normal force coefficient then reads

From this normal force coefficient we can obtain the lift coefficient normal to the free stream and the drag coefficient in the direction of free stream as follows

Cl = 2 sin2 0w cos hw and Cd = 2 sin3 hw (7.4a, b)

Since the wall angle and the angle of attack is the same for a flat plate, according to the impact theory at small angles of attack the lift coefficient is proportional with the square of the angle of attack, Eq. 7.4a, b. This lift coefficient is not sufficient even at considerably high speeds (This was the excuse to explain ‘flying is a property of heavenly bodies’ for centuries). We can now express the surface pressure coefficient, using the normal force coefficient given by Eq. 7.3, in terms of the free stream Mach number

Подпись:, P – Pi _ P Pi _ 2 2 h _ _A_

‘p 1/2pU2 1/2pU2 1/2pU2 w yM2

In hypersonic flow the free stream Mach number is high and its square is very high. Therefore, the second term of the right hand side of Eq. 7.5 is negligible compared to the first term. Neglecting the second term gives us the approximate expression which is independent of free stream Mach number as follows:

Подпись: (7.6)Cp ffi 2 sin2 0w

Hypersonic Flow

There exist various criteria to be satisfied by the free stream Mach number M?, which makes the flow to be classified hypersonic when it is very high supersonic. Depending on the value of the Mach number, we have hypersonic aerodynamics determined by a predominant parameter with which the flow physics does not change. That is according to some flow parameters the flow is considered to be hypersonic for M? > 3, and with respect to some other parameter the flow is regarded as hypersonic for M? > 5 (Anderson 1989). Moreover, the dependence on the Mach number may vary for the same parameter with the body shape. An important parameter of hypersonic flow is the temperature. In the stagnation flow, the temperature may reach some high values which can exceed the durability limits of the materials. For this reason in hypersonic flows heat transfer and thermodynamics play an important role, which forces us to add the concept of aerothermodynamics to aerodynamics (Bertin 1994). In addition, at high temper­atures there are considerable changes in the viscosity and specific heats of the air to be accounted in hypersonic flows. The classical approach gives us the ther­modynamic properties of the air either in normal temperatures or in very high temperatures approaching infinity. In the temperature ranges which are of interest to us the composition and the properties of the air can be determined by the aid of statistical thermodynamics (Lee et al. 1973). In higher speeds, temperatures and altitudes the chemical composition of the air changes. During the chemical reac­tions the energy needed is provided by the medium of the air for which the formation energy of each species must be included in the energy equation. This in turn affects the flow domain about the body and the shock location. The concept of aerothermochemistry is needed to be introduced at this stage. Furthermore, for a ballistic re-entry problem the speeds become so high that ionized flow around the capsule occurs. The ionized flow regions can be studied by plasma flow.

First studies on hypersonic aerodynamics started after WWII by the design work performed on intercontinental ballistic missiles. The first historic manned hypersonic flight and safe re-entry was made in 1961. Since then, based on the data recorded during re-entry, experiments performed in specially designed hypersonic

U. Gulfat, Fundamentals of Modern Unsteady Aerodynamics, 193

DOI: 10.1007/978-3-642-14761-6_7, © Springer-Verlag Berlin Heidelberg 2010

wind tunnels and the advances made in computational methods considerable progress is achieved in the multi disciplinary field of hypersonic aerodynamics. Naturally, the progress made in this field was not only applicable to re-entry problems and to the flight of intercontinental ballistic missiles but also useful for the design of intercontinental planes with sustainable hypersonic flight in the future.

In this chapter, starting by the Newton’s impact theory which predicts the surface pressure coefficient with a simple formula for blunt bodies, various order piston theory to be used for slender bodies, hypersonic similarity based on the Euler equation, viscous hypersonic flow and high temperature gas dynamics knowledge will be provided.