Category Fundamentals of Modern Unsteady Aerodynamics

Unsteady Transonic Flow Past Finite Wings

In open literature, the linearized potential theory was applied to unsteady transonic lifting surfaces starting with Landahl’s zeroth order theory during 1960s (Landahl 1962). In his study, Landahl used a special transformation technique to transform a rectangular wing to a delta wing to implement a previously developed theory for simple harmonic transonic solutions. In this way, the stream function for a simple harmonic motion of a delta wing was expressed, may be not so accurately but analytically, for a given reduced frequency. In following years, this approach was used on sub surfaces as transonic panels on the wing in order to increase the accuracy. In addition, the doublet lattice method was successfully applied to the potential flow solutions of transonic flow past swept edged and low aspect ratio wings (Hounjet and Meijer 1985).

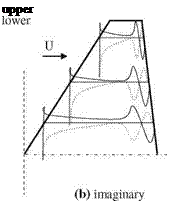
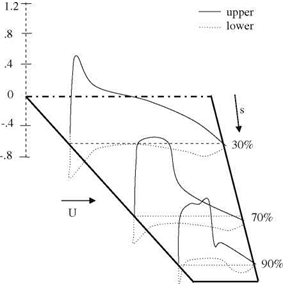
The finite difference solution of unsteady three dimensional potential equation, Eq. 6.3, is used for several wings and the results are compared with experiments in a detailed manner by Malone and his associates (Malone et al. 1985). In their study, the numerically computed surface pressure values are in agreement with the experimental results given for the wing of F-5. Shown in Fig. 6.14 are the surface
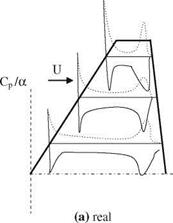
image145
Подпись: upper

Fig. 6.14 Surface pressure coefficient plots for M? = 0.95 of F-5 wing a real and b imaginary

pressure plots at three different spanwise stations of F-5 wing at free stream Mach number of 0.95 and reduced frequency of k = 0.132.

A close examination of Fig. 6.14 indicates that a line of shock doublet at both upper and lower surfaces close to the trailing edge appears to grow deeper towards the tip of the wing. When the free stream Mach number is reduced to 0.90, shock doublet is weakened and for further reduction to 0.80 the shock completely disappears from the surface. A similar study performed by Goorjian and Guruswamy (1985) on the F-5 wing gives agreeable results with the experiments at free stream Mach number of 0.90 for the wing aspect ratio of 2.98, the taper ratio of 0.71, leading edge sweep angle of 31.9°, and finally trailing edge sweep angle of -5°.

The effect of viscosity on the three dimensional transonic flow solutions to obtain the surface pressure distribution on finite wings was first studied in 1990s with numerical solutions of Navier-Stokes equations (Guruswamy and Obayashi 1992). In their study, a moving grid was used to consider the elastic behavior of the wing and the root chord was taken as the characteristic length. The viscous effects on F-5 wing at free stream Mach number of 0.90, Reynolds number of

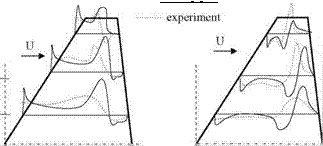
1.2 x 10⁷ and reduced frequency of k = 0.55 in pitch oscillations when compared with the experiments show higher pressure rise at the root and lower pressure rise at the tip region because of turbulence modeling. Shown in Fig. 6.15 is the upper surface pressure distribution for a forced pitching oscillations given by a(t) = 3°- 0.5° sin(rot) at three different spanwise stations.

The data base published by AGARD (1985) for the unsteady transonic flows past certain profiles and wings gives the surface pressure plots in a detailed report (AGARD-R-702). This report can be used for code validation purposes for the pressure coefficients at various spanwise stations of the swept wings even with high aspect ratios.
Unsteady Transonic Flow Past Finite Wings image147 Unsteady Transonic Flow Past Finite Wings

-5

Fig. 6.15 Surface pressure distribution for unsteady transonic flow, viscous solution

6.6 Wing-Fuselage Interactions at Transonic Regimes

The wing-fuselage interaction is always of interest to aerodynamicists since the fuselage effect on the lifting of the wing as well as the drag increase because of the interaction. In transonic regimes this interaction causes almost 50% increase on the drag force when compared with the drag force in low subsonic regimes for the same geometry. The reason for this increase is the creation of a wave drag because of the supersonic flow regime taking place at the intersection of the wing with the body. The experimental determination of the drag and its 50% reduction was possible with the pioneering work of Whitcomb on the delta or swept wings (Whitcomb 1956). In order to reduce drag, the ‘area rule’ was proposed by Whitcomb as the reduction in the cross sectional area of the fuselage at the intersection with the wing as shown in Fig. 6.16. With the area rule, the sum of the fuselage cross sectional area with the wing area is almost kept constant along the axis of the plane. This enables us to delay the occurrence of Mach waves causing extra drag on the body which in turn reduces the wave drag. The wave drag coefficients CDw given in Fig. 6.1 are the differences between the measured total drag at zero angle of attack, and the calculated skin friction drag (Whitcomb 1956). As can be seen from Fig. 6.16, the area rule not only reduces the wave drag considerably it also delays the occurrence of critical Mach number as opposed to the body having no reduction. Theoretical works performed in those years also yielded similar results (Lomax and Heaslet 1956). Lock’s previously referred work also can be listed as an example to the experimental study made on wing fuselage interaction. (Lock 1962).

In following years the design criteria for the wing fuselage configuration of the planes having slender bodies with various sweep angles at low supersonic free stream Mach numbers was given by Kucheman. For the wide bodies, however, it is possible to increase the critical Mach number while reducing the wave drag with

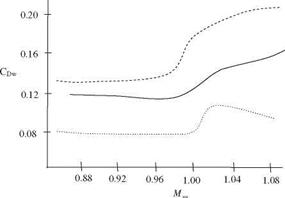
image148

image149

Fig. 6.16 Wave drag varia­tion with free stream Mach number in transonic flows for three different cases

enlargement of the fuselage cross sectional area at high subsonic cruise (Kuethe and Chow 1998).

In 1970s and 1980s with the advances in CFD techniques the analysis and design of wide body wing interactions as well as its unsteady transonic analysis became possible (McCroskey et al. 1985). Nowadays, concurrent with the pro­gress made in computational means the full scale transonic analysis of a full aircraft is possible.

Transonic Flow around a Finite Wing

Подпись: Fig. 6.10 The lift coefficient variation of finite wings with free stream Mach number and the aspect ratio image141

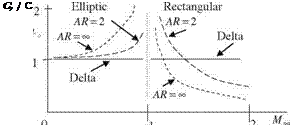
Aerodynamically and practically useful three dimensional transonic analyses over finite wings date back to 1940s with implementation of swept wing concept (Polhamus 1984). According to the information given by Polhamus, the first prototype flown with swept wing was Me262 for which the drag rise because of the compressibility of the air was delayed with 40° sweep at the leading edge which enabled the plane to increase its speed. This fact had not been realized by the allied forces yet. Busemann’s theory on supersonic swept wings was implemented for reducing the effect of compressibility on subsonic wings in wind tunnel testings at 1941. In 1945, however, Jones was the first, except German aerodynamicists, to start testing swept wings for their aerodynamic utilizations (Jones 1946). A decade after Busemann, Jones’ experimental and analytical work independently gave the lift coefficient variations for various wings with respect to the free stream speed, Fig. 6.10. According to Fig. 6.10, the lift coefficient for thin delta wings remains the same except for M? = 1. This means, the Jones’ theory on thin delta wings

state that the compressibility effect at low angles of attack is insignificant at even very high speeds as high as free stream Mach number of 2. That is if we somehow know the lift coefficient of a thin delta wing for incompressible flow, we can safely use that value even for very high speeds. The effect of the aspect ratio of a wing is also shown in Fig. 6.10 for elliptic and rectangular wing forms.

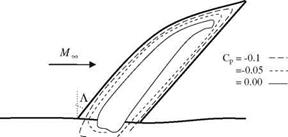
The theory of Jones and the information confiscated from Germans helped the designing of the military and the civilian transonic and supersonic aircrafts having swept wings. In this respect, until 1960s the studies were in general under military contracts; therefore, they were classified. In following years, first the experimental results were presented and/or published in relevant literature (Lock 1962). In his experimental work, Lock designed a 12% thick wing with 55° sweep and a curved leading edge, as shown in Fig. 6.11, at 2.5° angle of attack to give a shockless lifting wing at 0.90, 1.00 and 1.1 free stream Mach numbers. The design lift coefficient of the wing is CL = 0.18. Also shown in Fig. 6.11 are the pressure coefficient contours for the non lifting wing at free stream Mach number of 1. A similar work was performed on a similar wing shape experimentally and numer­ically by Labrujere and his associates at free stream Mach number M? = 0.96 and surface pressure distribution similar to that given in Fig. 6.11 is (Labrujere et al. 1968).

The evolving of the shape of the wing from Fig. 6.11 to its later stages with swept but straight leading edges and with smaller aspect ratios is the given in detail by Kucheman in later years (Kucheman 1978). In later years, with the advent of more sophisticated numerical methods the transonic wing design with higher lift coefficients with small aspect ratios became possible.

Подпись: Fig. 6.11 A transonic wing with aspect ratio of 3.54 and the sweep angle of K = 55° (The surface pressure plots are for the symmetric non lifting wing.)
image142

So far we have seen the application of the three dimensional potential theory to obtain the surface pressure distribution and the lift coefficient of the wings in transonic flow. The lift coefficient obtained with the potential theory is usually small, i. e. CL = 0.18, since the potential theory is valid for wings at small angles of attack without the presence of shocks and flow separation. In order to obtain higher lift coefficients, we have to increase the angle of attack to the level of partial flow separation, which in turn forces us to perform the viscous flow analysis via numerical solution of some form of Navier-Stokes equations. As an example, we can give the detailed numerical study over a specially designed swept wing, Wing C, performed by Kaynak implementing a zonal solution technique based on

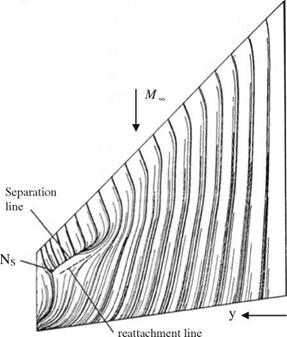
the Euler and Navier-Stokes solutions in mid 1980s (Kaynak 1985). Shown in Fig. 6.12 is Wing C planform and its skin friction lines obtained numerically with the following geometric and flow parameters. The leading edge of the wing has 45° sweep, aspect ratio of 2.6 and spanwise twist of 8.17°. The free stream Mach number is 0.85, the angle of attack is 5.9° and the Reynolds number is 6.8 x 10⁶. In zonal approach, the viscous region around the wing surface is solved with the thin shear layer equation and the outer region is solved with Euler equations (Kaynak 1985). The skin friction lines on the wing surface in Fig. 6.12 indicate that the flow is attached on most of the wing surface, however, only on the tip region there is a local separation due to presence of a shock, and the flow reat­taches afterwards in 50-70% spanwise location.

In Fig. 6.13, the surface pressure plots are provided at different spanwise locations. From these curves, the presence of a shock at the tip region is visible from 70% spanwise towards the tip itself.

Подпись: Fig. 6.12 Skin friction lines on Wing C in transonic flow with local separation (Ns nodal point)
image143

In a transonic regime under the off-design conditions, the increase in the total drag and the decrease in the total lift of a wing show similar drastic changes as shown by a profile in 2-D flow. In this respect a transonic wing has to be re­designed in order to operate in off-design conditions. For this purpose, re­designing process based on the numerical solution of the Navier-Stokes equations is applied on a transonic wing successfully by Jameson. In his work, a transonic

Подпись: Fig. 6.13 Spanwise variation of surface pressure coefficients along different locations image144

wing at buffeting Mach number of 0.86, is re-designed for performance increase under off-design conditions (Jameson 1999).

Unsteady Transonic Flow: General Approach

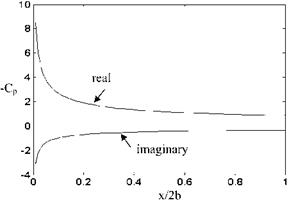
Previously, we have given the surface pressure coefficient variation for a vertically oscillating thin airfoil with Eq. 6.25 and the amplitude variation along the chord with Fig. 6.2. Now, the real and the imaginary parts of the surface pressure along the chord will be given by Fig. 6.6. Although, Eq. 6.25 which is based on the local linearization does not indicate the presence of the shocks at the leading and trailing edges, it gives agreeable results with experimental pressure measurements.

Подпись: Fig. 6.6 The real and imag-inary parts of the Cp distri-bution along the chord for an oscillating thin airfoil at M? = 1
image130

In order to describe the behavior of the surface pressure distribution of a thin airfoil in unsteady transonic flow, the effect of the increase in free stream Mach number must be considered.

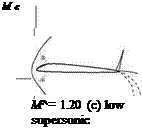
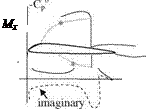
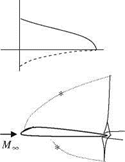
In this respect, it is possible to summarize and classify transonic flow conditions for a thin airfoil pitching in oscillatory motion with illustrations similar to that given in Fig. 6.7a-c, based on the experimental and the computational results, obtained for the surface pressure (adapted from McCroskey 1982). The low transonic flow conditions as shown in Fig. 6.7a indicate the presence of a shock on the instantaneous surface pressure distribution C0, and in a periodic motion the real and imaginary parts of the surface pressure Cp depicts a slightly moving shock which is called ‘shock doublet’ in literature. In addition, the appearance of a strong shock on the upper surface of the airfoil causes boundary layer separation. In Fig. 6.7b shown are the high transonic flow conditions where the free stream Mach number is very close to 1 and the real and imaginary parts are quite similar to that of Fig. 6.6 for which the local linearization technique is implemented. In the flow field for this case, we see the presence of k shocks around the trailing edges of the upper and lower surfaces. According to Fig. 6.7c in low supersonic flow regime, the instantaneous surface pressure distribution remains almost constant except around the leading edge which is the same for the unsteady surface pressure distribution. In the flow field of a low supersonic flow, a separated bow shock at the leading edge, and around the trailing edge a fork shaped shock at the upper surface and an expansion fan at the lower surface are present.

In unsteady flows when the viscous effects are negligible i. e. when there is not any shock separated boundary layer flow, the movement of the shock wave is observed for the low and moderate reduced frequencies. In these cases because of shock movement the linearized approach is not suitable. In high reduced fre­quencies, since the shock movement is not that high, it is possible to use linearized approach (McCroskey 1982). When the linear theory is not applicable either the local linearization or the full non linear potential equation is to be solved. For the cases of strong shocks the presence of vortices forces us to resort to the solution of Euler equations.

image133,image137
image131,image134,image135 image132,image136

M^ = 0.80 MM= 0.98

(a) low transonic (b) high transonic

Fig. 6.7 The surface pressure distribution and the flow fields for different transonic Mach numbers (* indicates sonic conditions)

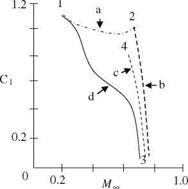
In cases of strong viscous effects the presence of flow separation in transonic flows causes some unsteady phenomena such as ‘flutter’, ‘buffeting’ and ‘aileron buzz’ to happen. The flutter phenomenon as a shock induced separation occurring with the shock movement was first observed experimentally with the forced pitching oscillation of profiles. The self induced periodic shock movement on a thick biconvex airfoil in a transonic flow at zero angle of attack was first observed with numerical solutions, and then it was also observed experimentally for certain free stream Mach numbers and frequencies (McCroskey 1982). These observations were useful mostly for the assessment of transonic buzz which indicates the regular response of the structure to the aerodynamic effects. In 1970s, it was possible to predict experimentally the onset of buffeting for a profile with respect to the Mach number and sectional lift coefficient (Kuche – mann 1978). Shown in Fig. 6.8 is the enveloping curve b for the onset of buf­feting depending on the free stream Mach number and the sectional lift coefficient of a profile. The conditions for the onset of buffet depending on frequency spectrum of the surface pressure oscillations, induced frequency and the size of the separation were experimentally determined starting from 1980s. On the other hand, starting from 1990s it has been possible to establish these conditions with numerical solution of Navier-Stokes equations using proper turbulence models. This requires very fine resolution for the computational grids so that the first point away from the surface lies in the viscous sublayer (Isogai

Fig. 6.8 Effect of freestream Mach number and the sec­tional lift coefficient on a flow separation, b buffeting, c drag divergence and d critical Mach number variation

image1391992). In 2000s the numerical solution obtained with different turbulence models enabled researchers to predict the onset of buffet for NACA0012 at various angles of attack and free stream Mach numbers (Barakos and Drikakis 2000). According to Barakos and Drikakis for the Reynolds number range of 106-107 the 12% thick symmetric profile at zero angle of attack does not undergo any buffet up to the free stream Mach number of 0.8. On the other hand, at 1° angle of attack and at 0.8 Mach number, and at angle of attack range 2-4° for lower Mach numbers like 0.775 and 0.725 the buffeting starts. Most recent numerical studies on a supercritical airfoil, NLR7301, indicate buffeting at 0.5° angle of attack and in the free stream Mach number range of 0.82-0.83 and Reynolds number range of 1.943 x 10⁶-1.954 x 10⁶! This range is called ‘transonic dip’ and outside of this range no buffet is encountered (Geissler 2003).
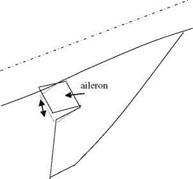
Another unsteady transonic phenomenon is the ‘aileron buzz’ and it is due to a shock doublet created by the shock movement which causes hinge moments with dissipation at the hinges of aileron. The onset of buzz can happen with weak viscous effects but its maintenance requires strong viscous effects (McCrosky 1982). Both numerical and experimental results enable us to predict the boundaries of buzz with angle of attack and free stream Mach number. Accordingly, the buzz is encountered at lower transonic Mach numbers with increasing angle of attack. In recent years, numerical solution of Navier-Stokes equations performed for designing a ‘Supersonic Commercial Plane’ by the Japanese National Aerospace Laboratories gives a detailed study of aileron buzz (Yang et al. 2003). In the work of Yang et al., oscillation of an aileron of a wing at a zero angle of attack attached to a fuselage is studied numerically as fluid-structure interaction problem based on an aeroelastic-aerodynamic solution. In their study, a moving deforming grid is employed together with structural damping of the elastic wing. The elastic wing at free stream Mach number of 0.98 indicated undamped aileron buzz to increase the amplitude of oscillations in such a way that eventually the numerical solution diverged. During the diverging of the numerical solution, the amplitude of the oscillation of the angle rises from, 1 ° to 2° in one cycle. For the case of the rigid wing, however, the same flow conditions caused damping for the aileron

Подпись: Fig. 6.9 Aileron buzz at transonic flow
image140
Подпись: 0.98
Подпись: M,

oscillations. For the free stream Mach number ranging from 0.95 to 1.02, the aileron oscillations showed damping behavior even for the elastic wing! (Fig. 6.9)

Steady Transonic Flow, Non Linear Approach

Equation 2.15 is the non linear equation which is satisfied by the velocity potential. If we omit the time dependent terms of Eq. 2.15, we obtain the following non linear equation for the velocity potential in two dimensional steady flows

(d2 — ФІ )/xx +(a2 — /2 )/yy — 2/x Фу /xy = 0 (6.26)

Here, a denotes the local speed of sound and the subscripts denote the partial differentiation with respect to x or y. The character of Eq. 6.26 changes depending
on the speed of sound in a transonic flow. If speed of sound is higher than the local flow speed, then the equation is elliptic, and it becomes hyperbolic if the flow speed exceeds the speed of sound. For this reason, the solution of Eq. 2.26 can be obtained either with specific analytical methods for specific profile shapes or numerical methods for arbitrarily shaped airfoils. In general, for a profile with a thickness immersed in a high subsonic free stream the flow speed increases due to thickness effects until reaching the sound line where the flow speed is equal to local speed of sound. After maximum thickness, the supersonic flow expands and speeds up while its pressure drops down. Before reaching the trailing edge there is a sudden increase in the pressure so that the flow pressure eventually reaches the wake pressure. This sudden pressure increase is a normal shock, which is in harmony with the physics of the flow for transition from supersonic to subsonic flow regime. However, for very special geometries it is possible to have shockless transonic flow via inverse design (Nieuwland and Spee 1968). First shockless transonic flow was studied for symmetrical quasi elliptical profiles (Baurdoux and Boerstoel 1968), and thereafter these techniques were developed for non sym­metrical airfoils called supercritical airfoils (Whitcomb 1956; Bauer et al. 1972, 1975).

Now, as an example to the shockless transonic external flow we can obtain the surface pressure coefficient of the symmetrical quasi elliptical profile with finite element solution of Eq. 6.26. Since Eq. 6.26 is a nonlinear equation we have to solve it with an iterative technique. In addition, it has an elliptic – hyperbolic character; therefore, the information in the elliptic region must be carried in all directions. However, in the hyperbolic region the information must travel only in downstream of the node concerned. This forces us to use artificial viscosity with a proper control system while forming the coefficient matrix. This means for the elements in the supersonic region only the information travelling in downstream is permitted, otherwise it is eliminated. This approach gives us a convergent iterative scheme for the solution of the velocity potential (Ecer et al.

1977) . In Fig. 6.3 the finite element results with quadrilaterals are compared with the analytical solution for the surface pressure variation Cp of a quasi elliptical Nieuwland profile. Although, a course grid is used, 31 x 11, in computations a good agreement with the analytical solution is achieved in subsonic region and a satisfactory agreement is observed after the critical pressure where local Mach number exceeds unity. Shown in Fig. 6.4a is the discretized flow field for the finite element solution. The 50 step iteration convergence history of the subsonic and the supersonic surface pressure values are given in Fig. 6.4b.

The same elliptic-hyperbolic mixed problem was also solved by Murman and Cole using finite difference method with much finer grid on the surface of the airfoil. Their solution agrees well with the analytical solution since they use 50 points on the surface to increase the accuracy. However, their solution required more CPU time. Murman and Cole also considered the off-design behavior of the profile by giving solutions obtained for the free stream Mach numbers slightly different from the design Mach number.

image124

Fig. 6.3 Surface pressure distribution for 10.76% thick Nieuwland profile at M = 0.8257

The purpose behind analyzing the transonic flows in detail lies in designing new profiles either without shock or with very weak shock at high subsonic Mach numbers. It is a well known fact that if there is a shock on the surface of the profile at subsonic free stream Mach numbers, the drag coefficient becomes the double of the shockless case. The cause of this drag rise is the shock induced boundary layer separation and the entropy rise across the shock. On the other hand, if the shock occurrence on the airfoil surface is delayed with the increasing of the free stream Mach number, then the lift coefficient will rise while the drag coefficient almost remains the same. Now, we can compare qualitatively the upper and lower surface

image125

Fig. 6.4 For the symmetrical quasi elliptical airfoil, a finite element grid, b convergence

Подпись:

Steady Transonic Flow, Non Linear Approach image126,image129
image127,image128

(b) M„ = 0.80

Fig. 6.5 Transonic flow, a conventional profile, strong shock, b supercritical profile, weak shock

pressure coefficients and sonic lines for the conventional and supercritical profiles in Fig. 6.5.

As seen in Fig. 6.5a, there is a strong shock present at the upper surface of the conventional airfoil to cause a boundary layer separation whereas at a considerable higher free stream Mach number the supercritical airfoil has weak shocks at the lower and upper surfaces without any flow separation. In conventional airfoils the critical Mach number is reached for lower free stream speeds with lift loss and drag increase as opposed to the supercritical airfoils for which the critical Mach number and the lift is higher and the drag is lower. As an example for a classical NACA airfoil when the free stream Mach number is increased from 0.65 to 0.69 the drag coefficient increases 50%. For a supercritical airfoil, on the other hand, the drag coefficient increases only 10% for the Mach number increase from 0.65 to 0.79 and for M = 0.80 it goes back to the value that was attained at M = 0.65 (Whitcomb and Clark 1965). However, if the free stream speed exceeds the design value of 0.80, the drag coefficient shows a sudden increase. This means one should expect poor performance from the supercritical profiles at off design conditions.

Unsteady Transonic Flow, Supersonic Approach

We have demonstrated before that for the supersonic approach e0 > 0 is the restriction. If we consider simple harmonic motion, two dimensional form of Eq. 6.8, with Laplace transformation of x coordinate, becomes

ф0 — i2/0 = 0, i = eos2 + fo s — d (6-21)

Here, ю is the angular frequency, and f0 = f0 + ^—ію, d = (a/aM)2.

Unsteady Transonic Flow, Supersonic Approach Unsteady Transonic Flow, Supersonic Approach

The solution of Eq. 6.21 in the Laplace transformed domain can be performed similar to that of Eq. 6.8. The inverse transform gives us the solution ф0 in x coordinates together with the prescribed boundary conditions as follows

For a profile oscillating vertically with h, Eq. 6.22 becomes

Подпись: 2 1/2 43 | + exp(—ex)x 11 (x) f0(x) + 2e0 e0 e Подпись: (6-23)/0(z = 0) = he01/2 Here we define:

2

1/2

21

(>) +e0

f0

x, e

2e0

(>) +e0

x

Подпись: /0(z = 0) = 2h Unsteady Transonic Flow, Supersonic Approach Подпись: (6-24)

We can take the limit of Eq. 6.23 as M? = 1 to obtain the expression for the perturbation potential

Equation 6.24 is used to obtain the pressure coefficient for a simple harmonic vertical oscillation of a thin airfoil

image123

Here, the motion is prescribed as h = heixt, and the reduced frequency is defined as k = xb/U.

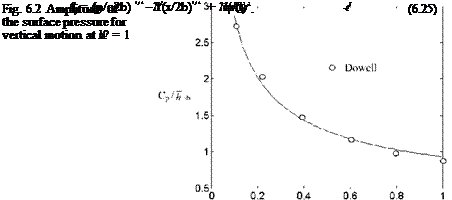
Example 6.1 Find the amplitude of the surface pressure for a profile in simple harmonic vertical oscillation at M = 1 and k = 0.25

Solution Let us take x0 = b, e0 = 0.12 and f0 = 2.4/b to find the surface pressure from Eq. 6.25. The plot of surface pressure coefficient is given in Fig. 6.2 using the complex amplitude given by 6.25. Also shown in Fig. 6.2 is the results of Stahara-Sprieter, given in Dowell, for 6% thick Guderly profile.

Comparisons of the graphs indicate that solution with 6.25 is in good agreement with the reference values.

So far we have obtained the transonic steady and unsteady solutions based on local linearization with neglecting the thickness effects. In next section we are going to see the numerical solution of nonlinear transonic flow equation with thickness effects.

Two Dimensional Transonic Flow, Local Linearization

The linearized potential Eq. 2.24b was obtained under the assumption that the difference between the free stream speed of sound and the local speed of sound a’ was negligible. When the free stream Mach number M? approaches unity this difference becomes important, therefore, it has to be taken into consideration for transonic flows. Integrating the linearized form of the energy equation, Eq. 2.24b along a streamline from the free stream to the point under consideration, gives the relation between the local speed of sound and the perturbation potential as follows

Подпись: U. Gulfat, Fundamentals of Modern Unsteady Aerodynamics, DOI: 10.1007/978-3-642-14761-6_6, © Springer-Verlag Berlin Heidelberg 2010 (6.1)

Подпись: /X Two Dimensional Transonic Flow, Local Linearization Подпись: 0/ 2U0/ 0X Подпись: + a1 (/yy + /'zz) Подпись: (6.2)

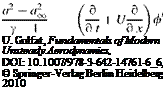
Substituting Eq. 6.1 for the local speed of sound in Eq. 2.24a provides us the perturbation potential for the transonic flow in terms of free stream speed of sound in open form in following manner

Подпись: /Xx(1 — Mi2) + (/'yy + /Zz) Подпись: 1 0/0 2 0 a^O t 0t ^ 0x^ Подпись: (6.3)

Here, the second derivatives are given in indicial notation. The first term of Eq. 6.2 makes the equation nonlinear. In addition, the difference expression а2ж — U2 under the bracket of the first term becomes very small as Mach number goes to zero. This makes the first derivative terms to remain in the bracket. After this simplification of Eq. 6.2, we can divide it by а2 to obtain

MN in Eq. 6.3 is given as

m2 = mIA1 + "A^uA/x

Here, the time derivative in the first term is neglected; however, the equation is still nonlinear. Equation 6.3 still contains time dependent terms at its right hand side and it can be used in studying unsteady transonic flows.

Now, we are going to introduce the local linearization concept for the solution of Eq. 6.3. For this purpose let us separate the perturbation potential into its steady and unsteady components in following manner: /’ = /S + /d, where subscript s denotes steady and d denotes the unsteady components. The steady component of the perturbation potential from the left hand side of Eq. 6.3 satisfies the following homogeneous equation.

(1 — M2 )/Sxx + /Syy + /Szz = 0 (6.4)

The unsteady component, on the other hand, reads as

Подпись: Here, e Подпись: M2 Подпись: 1 + (y + 1)if Подпись: f Two Dimensional Transonic Flow, Local Linearization

/dyy + /dzz — OrAitt — £^ — e/dxx — f /dx = 0 (6.5)

denotes partial differentiation, whereas subscripts s and d stand for steady and unsteady components as before.

In Eq. 6.5, coefficients e and f contain the partial derivatives with respect to x only; therefore, they can be expressed in terms of the pressure coefficient for the steady part using Eq. 2.21 as Cp = —2/X/U. Let us remember once more that

Eq. 6.5 is non linear because of e and f, Therefore, Eq. 6.5 can be solved either numerically or by means of local linearization (Dowell 1995). For two dimen­sional studies in x—z coordinates, the local linearization is made as follows. We first decompose the steady perturbation potential into its two different components as follows: ф’ = ф° + ф. In addition, let us expand coefficients e and f into (x — x0) power series as follows

e = em(x – x0)m vs. f = fm(x – x0)m

m=0 m=0

Now, for obvious reasons, the homogeneous equation is used with the non homogeneous boundary conditions, i. e.,

ф0 – е0ф°ж – f0/0 = °. (6.6)

The non homogeneous equation to satisfy the homogeneous boundary condi­tions, i. e.,

11

^zz – e0 Фxx – f0 h = ф0ж +^xx em (x – x0)m + ( ф0 + ^x) fm(x – x0)m

m=1 m=1

(6.7)

For a good approximation, we expect: ф0 ^ ф. In order to satisfy this condition the choice of x0 plays an important role in determining coefficients e and f. Another important fact here is that the first terms of e and f are independent of x, which means the value of e0 is a constant. Approaching from supersonic side will make the sign of e0 positive, and subsonic side will make it negative. Now we know that free stream conditions being slightly supersonic causes the perturbations from a point to be felt only in downstream Mach cone of that point. Utilizing this fact enables us to use unilateral Laplace transform in x direction for Eq. 6.6 with prescribed non homogeneous boundary conditions. The definition of Laplace transform of 0 in x is given as

1

ф0 = J Z°(x, z)e-sxdx 0

As is known the Laplace transform of a derivative of a function is given by initial conditions times the powers of s, powers being proportional with the order of the derivative. Applying this property for Eq. 6.6 gives us the following second order ordinary differential equation

ф° -(e0s2 + f0s)ф0 = 0 (6.8)

Taking i2 = (e0s2 + f0s) gives the solution of Eq. 6.8 as follows

ф 0(z)=Ae-1z + Be1z (6.9)

In order to satisfy the diminishing radiation condition at infinity in Eq. 6.9 taking B = 0, for upper surface will be consistent with the physics of the problem. On the other hand, the coefficient A can be obtained from the transformed surface boundary condition. For this purpose we match the downwash, w, with the z derivative of the perturbation potential, expression 6.9, at z = 0+ as follows

^(z = 0+) = W and ф0(z = 0+)= — (6.10a, b)

oz l

Here, inverse Laplace transform of Eq. 6.10a, b is performed to express the perturbation potential since the downwash and i are expressed in s. Here, we have to note that i2 is always positive. The variable s is also by definition greater than zero. Hence, the convolution integral (Hildebrand) gives the inverse of Eq. 6.10a, b as follows

X

/0(z=0+)=- у e01/2exp(-2“)/o (2£)w(x – n)dn (6Л1)

0

Here, Z0, is the 0th order first kind modified Bessel function (Appendix 5). As the surface boundary condition, the downwash w is prescribed; therefore, the pressure coefficient along the chord can be found by integral 6.11. As Mach number goes to 1, the value of e0 approaches infinity; however, the exponential function of the integrand and the Bessel function simplify the integral 6.11 as follows

X

/0(z = 0+) = — f-1/2(nn)-1/2w(x – “)d“ (6.12)

0

Let us determine the perturbation potential for a thin airfoil at a = constant angle of attack for the upper surface, z = 0+, using 6.11. The downwash, w = — Ua, gives the integral 6.11

1 2e1/2 f

/0(z = 0+)— = ехр(-П)[Ш + Ш], n = 2f-x (6.13)

The upper surface pressure coefficient reads as

q0

~ap =-2Є-1/2exp(-“)/0(“) (6.14)

Two Dimensional Transonic Flow, Local Linearization Подпись: 2e° 1/2exp(-“)/0(“) Подпись: (6.15)

The lower surface, on the other hand, has negative z value; therefore, in Eq. 6.9 the radiation condition is applied accordingly to obtain the following lower surface pressure value

Equations 6.14-6.15 give the lifting pressure expression as follows

Ac0 _,/2

– = 4e°1/2 exp (-П)Іо (П) (6.16)

a

Integrating 6.16 along the chord provides us the sectional lift coefficient as

C° = 4a(f0 b)-1/2 b1/2 exp (-b)[Io (b)+h (b)], b = —. (6.17)

e0

Here, b represents the half chord.

Since we know the perturbation potential component, /0 related to the non homogeneous boundary conditions, we can now write the following equation for ф using Eq. 6.5

-f0- e0Фxx = e1 (x – Xo)/0°x (6>.Щ

In order to solve Eq. 6.18, we again take the Laplace transform of it with respect to x coordinate to obtain a non homogeneous second order ordinary dif­ferential equation

ф – l2Ф = -e^2s/0 + + xos2ф^ (6.19)

As a technique, first we solve the homogeneous part of Eq. 6.19, and then obtain the non homogeneous solution. The homogeneous part is solved exactly like Eq. 6.9. After finding the general solution of Eq. 6.19 under homogeneous boundary conditions we can take the inverse Laplace transform of the result to obtain the solution in x coordinates. The downwash expression, w = -Ua, from the surface boundary condition gives us the perturbation potential and that in turn provides us the surface pressure coefficient as follows:

C- ffi ae-3/2exp(-n) [2П(І1 – І0)+10] (6.20)

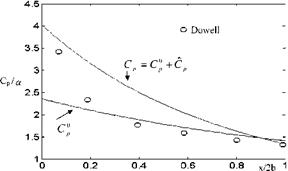
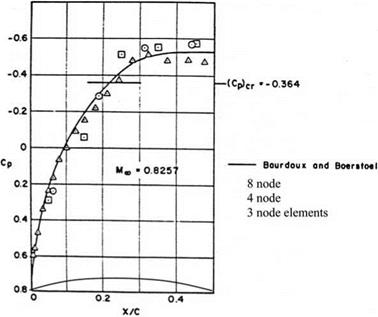
In Fig. 6.1, plots of C0 given by 6.15, Cp given by 6.20, and their summation as the total surface pressure distribution for Cp is shown for Mach number 1. On the

image122Fig. 6.1 The surface pres­sure coefficient obtained with local linearization at M? = 1 (with x0 = 2b, f0 = 2.4/b,
Є0 = 0.72)

same figure also shown is the surface pressure obtained by Dowell using Stahara – Spriter’s calculations for 6% thick Guderly airfoil (Appendix 6). In this compar­ison, coefficients e and f are expanded into the series about x0 = 2b. Here, value of x0 is chosen arbitrarily; therefore, to calculate the pressure coefficient properly calibration with other methods is necessary (see Problem 6.9).

Transonic flow

In this chapter we are going to study a special case of an external flow for which the free stream speed of the flow is close to the speed of sound, i. e. the Mach number is about unity. Under this condition the flow is called ‘transonic’. In transonic flows, the linearized version of the potential equation is not sufficient to model the flow; therefore, we resort to nonlinear but simplified version of the potential flow. The local linearization concept introduced by Dowell will be implemented for the series solution of the nonlinear transonic velocity potential. The local linearization technique enables us to study some simple steady and unsteady transonic aerodynamic problems analytically. Afterwards, we are going to study the examples for the numerical solution of the nonlinear potential equa­tion introduced by Murman and Cole (1971) in their work which handles the transonic flow region with a suitable numerical scheme. In the rest of the chapter, numerical solutions for transonic flow studies with three dimensional unsteady Euler Equation solutions and the effect of viscosity with thin shear layer approach will be considered. Further unsteady topics of transonic flow will be provided in the chapter for Modern Topics.

Munk’s Airship Theory

Подпись: Fig. 5.19 Airship geometry Подпись: A-A

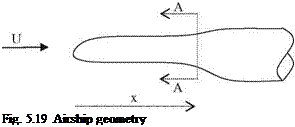
The aerodynamic forces acting on the airships first was given in a study made by M. M. Munk during the first quarter of the last century (Munk 1924). As we know from the physics of the problem, the rate of change of the momentum of the airflow normal to the freestream is equal to the force crated in that direction. Using this principle, first we can calculate the change of the momentum of the air displaced vertically by an arbitrarily shaped body as shown in Fig. 5.19. Let wa be the vertical velocity of the air parcel whose density is q, and S is the cross sectional area at a given station on the body. Since the cross sectional area changes with x, we denote the variables in their differential form as follows.

Let (pSdx) be the differential air mass displaced vertically with a mean velocity wa. Its differential momentum in z direction reads as

dIz = (pSdx)wa

Here, we assume the body is slender, therefore, we can take the mean vertical velocity value as the velocity of the axis of the body. Accordingly, if the position of the axis of the body is given with za = za(x, t) the vertical velocity reads as

Подпись:0za 9za

Ot + Ox

Подпись: dIz Подпись: (pSdx) Подпись: Oza UOza Ot + Ox Подпись: (5.99)

The differential momentum of the air parcel then becomes

The rate of change of the momentum of the air is equal, but opposite in sign, to the vertical force acting in unit body length, i. e.,

dL D dIz

dx Dt dx

Подпись: dL dx Munk’s Airship Theory Munk’s Airship Theory Подпись: - pS° Oa + UOa Dt Ot Ox

If we use Eq. 5.99 and assume that the air is incompressible for the cross flow, the vertical force for unit length becomes

Подпись: dL dx Подпись: dS Oza Oza O2za pU dx Ot + U Ox pS Ot2 Munk’s Airship Theory Munk’s Airship Theory Подпись: (5.100)

If we assume that the cross section of the body does not change with time, and expand the substantial derivative in linearized form we obtain the lift change in x

Подпись: dL dx Подпись: pU dAdJ± - pU-S^ dx dx dx Munk’s Airship Theory Подпись: A•- dx Подпись: (5.101)

Equation 5.100 is in very good with experiments performed for the slender bodies. Writing 5.100 for steady flow gives

image118"Fig. 5.20 L(x) force acting on the slender body

According to Eq. 5.101, for steady flows, to have a differential force normal to the free stream we need to have for the body:

(i) an angle of attack and the cross sectional area change,

(ii) if the cross sectional area does not change then there has to be a camber!

Now, let us show the normal force L(x) acting on the slender body with angle of attack and the variable cross sectional area shown in Fig. 5.20 as a typical slender body shape. Using Munk’s theory, the aerodynamic force acting normal to the flight direction is at the front and back side of the body where there are cross sectional area changes. The same body does not experience any aerodynamical forces where the cross sectional area remains constant. The vertical forces may affect a short region on the body but the moment arms can be long, therefore effective pitching moments with respect to the center of gravity may be generated. These pitching moments, naturally, affect the stability of the body. One striking example to the unstable body is the one with the pointed nose and the pointed end where the forces create a continuous rotation about the center of gravity. The body shown in Fig. 5.20, on the other hand, has a flaired end to give a stable configu­ration (See Problem 5.32 for detailed description of stability criterion).

Slender Body Theory

The potential theory is also a tool for studying the flow about slender bodies. Here the aim is to calculate the aerodynamic forces and moments exerted on the body by the flowfield. Since the body is slender and the angle of attack considered is small, the small perturbation method is applicable for the case of compressible flows. For this reason, the equation we are going to use the linearized compressible small perturbation equation given with 2.24. Let us express Eq. 2.24 in terms of Mach number explicitly for the perturbation potential /.

—Фи + Фхі + (M – 1)/xx = Фуу + /zz (5-94)

a2 a

For simple harmonic motion in terms of the amplitude and the frequency the perturbation potential becomes

Ф(x; y, z, t) = Ф(х, у, z)elmt-

Equation 5.94 in terms of the amplitude and the frequency reads as

x2 2M 2

—- 2 Ф + Фх + (M – 1)Фхх = Фуу + фzz – (5-95)

a2 a

The nondimensional form of Eq. 5.94 is more convenient to interpret each term in terms of its order of magnitude. We can perform nondimensionalization using Fig. 5.18.

Let l be the length of the body and s be the maximum lateral dimension of the body. The nondimensional coordinates than defined as П = x/l, g = у/s, f = z/s. If we write Eq. 5.95 for the nondimensional potential defined as F(£, g, f) = Ф(x, у, z)/(Ul), the equation becomes

Подпись: Ul(F - s2 Fgg x2 2MU, ,

Ul F + ix Fn + M2

a2 a

Slender Body Theory Slender Body Theory Подпись: (5-96)

The right hand side of the equation above contains the Laplacian in transformed coordinates. Rearranging it gives

If we redefine the reduced frequency as k = ml/U, Eq. 5.96 becomes

Fnn + Fgg = Q2 [-k2M2F + 2ikM2Fn + (M2 – 1)FK] (5.97)

For the slender bodies by definition ratio of the lateral dimension to its length is small, therefore (s/l)2 << 1. In addition if the following parameters k2 M2, k M2 and M2 is not too large, Eq. 5.97 becomes

Fgg + Fre = 0. (5.98)

Equation 5.98 is the Laplace’s equation written involving lateral coordinates only. That is according to 5.98, the cross flow created by the slender body is incompressible. Equation 5.98 does not contain any term related to n, meaning that it seems the potential is independent of flow direction. However, we have to specify the boundary condition along the body surface which makes our potential depend on the low direction. The cross flow behaving incompressible enables us to use Munk’s airship theory. This theory is used for finding the aerodynamic forces created by the momentum of the air parcel displaced by the body itself. Let us see the application of Munk’s airship theory for steady and unsteady flows.

Arbitrary Motion of a Profile in Supersonic Flow

In a supersonic flow, the aerodynamic response of a profile to an arbitrary motion is function of the free stream Mach number and is obtained by means of the Wagner function and the Kussner function where the former is the response to a sudden angle of attack change and the latter is the response to an arbitrary gust. Here, we are going to use /(s) for the Wagner function and v(s) for the Kussner function as usual.

With Wagner function and ao:

cL(s) =2 nao /(s) (5.54)

Similarly, for a gust of magnitude wo with Kussner function:

cLg(s) = 2naJUj-x(s) (5.55)

Here, s is the reduced time based on the half chord. The approximate expo­nential forms for the Wagner and Kussner function read as follows.

Подпись: v(s) Подпись: cig(s) cig (i) Подпись: 1 — b1e b s — b2e b2s Подпись: (5.93 — a, b)

/(s) = b1e bl s + b2e b2s + b3e Ьз*

Here, the numerical values for the coefficients and the exponents are given in Table 5.2 as provide by Mozalsky and O’Connell (1962).

Table 5.2 The change of Wagner and Kussner function with respect to the Mach number in supersonic flow

M

b1

b2

Ьз

b1

b2

Ьз

/(s)

10/9

36.1

-6.62

-29.6

0.300

0.457

2.87

10/8

-7.56

14.7

-7.15

0.450

0.530

0.700

10/6

-0.304

2.60

-2.32

1.00

1.38

1.62

10/5

-0.170

.997

-0.828

1.00

1.50

2.00

M

b1

b2

b1

b2

x(s)

P2

1.03

-0.0315

0.95

0.15

2.0

2.70

-1.70

1.15

0.969

Fig. 5.18 Pertinent dimen­sions of a slender body