Category Helicopter Test and Evaluation

Vertical climb testing

For vertical climb performance testing, V = 0 and Z is not fixed, so for climbs outside of ground effect the general power required relationship can be reduced to:

p = J W V _m.

am3 m ’ VO/

which can be rearranged more sensibly as:

Y = f, W,^)

m affl3 am V9J

Vertical climb testing is achieved by establishing the aircraft in an OGE hover, at a altitude about 500 ft below that corresponding to the selected value of Wlam2 and with the rotor speed set for the desired m lV9. Power is increased incrementally up to the maximum available and the vertical rate of climb generated at each increment is measured. The climb begins below the required test altitude so that data can be logged at the required Wlam2. As fuel is used, the target altitude is increased to maintain Wlam2 constant. Ideally a ‘smoothed’ rate of climb is obtained from altitudeltime data recorded at 100 ft intervals during the climb. This so-called reduced power vertical

image64

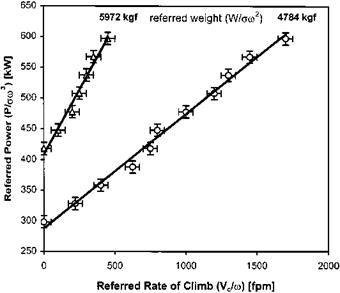
Fig. 3.21 Referred vertical climb test data – RPV method.

(RPV) technique can be replaced by a quicker, but less accurate, alternative based on data obtained at maximum torque only (the maximum power vertical – MPV method).

The smoothed rate of climb is used to plot P/am3, or Q/am2, against Vc/m, as shown in Fig. 3.21, for a range of constant values of W/am2. Ideally these tests should all be performed at the same value of m/^9 to eliminate the possibility of tip effects affecting the data. This will typically require the flight crew to adjust the rotor speed as the climb is commenced to account for static droop and the reduction of temperature with altitude. Ease of test planning (selection of convenient hover altitudes) and test conduct (use of the MPV method) will generally lead to the collection of vertical climb data at a range of referred weights over which there has been imprecise control, see Fig. 3.22. Since mission weights may not have been targeted, it is necessary to develop a more usable form for this data. For selected values of Vc /m a chart such as Fig. 3.23 can be produced showing corresponding values of P/amз at various values of W/am2.

Developing a test philosophy using the free-air method

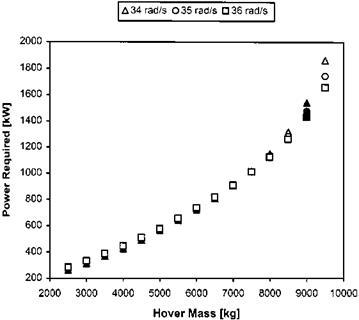
As already mentioned tip effect evaluations consist of establishing a series of hovers so that the variation of power (referred) with RRPM (referred) at constant weight (referred) can be documented. It is important, therefore, that the appropriate test philosophy is used to ensure that an adequate range of test data is obtained. Consider the situation that arises when a test team elects to establish a series of hovers and during each hover they vary the RRPM by +1 rad/s from nominal. (They conduct a rotor sweep.) Assume for simplicity that all the hovers are conducted at the same height (but at different weights) and that the fuel burn during each rotor sweep can be ignored. Figure 3.18 shows a typical set of raw data. The team then processes the data to yield the required referred parameters, see Fig. 3.19. Any assessment of the importance of tip effects has been complicated since the actual weight at which each rotor sweep was conducted has yielded three referred weights as shown by the three highlighted points in each figure. In practice, due to the uncertainties associated with actual flight test, the team will usually be unsure if the differences in referred power are due solely to tip effects. The correct test philosophy, therefore, is to plan a series of hovers at differing weights and altitudes that will generate a consistent set of referred weights.

As an example of the correct approach to tip effect evaluation consider the planning required for a single test point based on a nominal condition of 4000 kg at 5000 ft (ISA) and a rotor sweep of 95% to 105%. At 5000 ft the relative density is 0.8617 so the referred weight resulting from the nominal conditions (100% RRPM) is 4000/ 0.8617 = 4642 kg. Suppose sometime later the weight has reduced by 50 kg to 3950 kg and the team wish to establish the 95% RRPM test point. Knowing that the

image62

Fig. 3.19 Hover performance data – referred.


Подпись: W
Developing a test philosophy using the free-air method

referred weight required is 4642 kg and that m will be 0.95 (m2 = 0.9025) it is possible to determine the relative density required to give the desired referred weight when the actual weight is 3950 kg:

This relative density will be found at around 2000 ft. Likewise, if later in the sortie when the helicopter weight reaches 3900 kg, the team wish to establish the 105% RRPM a test point at an altitude of approximately 9000 ft would be required to generate the desired referred weight. It should be clear, therefore, that an accurate estimate of air density (OAT at regular pressure altitudes) is an important factor in successful planning.

So far in this discussion actual RRPM has been considered as the controlling parameter. In fact the test objective is to assess the effect on referred power of referred RRPM (m/^6) at constant referred weight. To allow for data interpolation, and possible extrapolation, it will be necessary for the test team to gather data from a series of test points over a range of referred weights with at least two values of referred RRPM established at each referred weight. Since OAT and therefore V6 will vary with altitude the variation of the actual RRPM required to meet the test objectives will need to be determined and compared with any published limitations. The example introduced above will be used to illustrate this point. Assume that the required referred

RRPM range is 0.95 to 1.05 (equating to 95% RRPM to 105% RRPM at sea level ISA) and that the nominal rotor RPM is 100%. Since in this example the temperature profile is known it is possible to use:

W, W x JL, W, 4642

amz § § m /

Подпись: W § Developing a test philosophy using the free-air method

Thus for the three referred RRPMs required (0.95, 1.00 and 1.05) a value of W/§ can be found which will dictate a particular pressure altitude for a given weight. For example, if a/V9 equals 1.00 and the AUM is 4000 kg, then:

and

Подпись: 0.86174000

4642

Подпись: a = Подпись: a 79. Подпись: x Ve = 1.00 x Подпись: '280.00 288.15 Подпись: 0.9858

This relative pressure can be found at approximately 4100 ft Hp. At this altitude the OAT will be 280 K and therefore the required RRPM for a/V9 = 1.00 is given by:

Thus an actual RRPM of 98.6% will be required at 4100 ft to generate the desired referred RRPM and weight. Similarly if a/V9 = 0.95 is set when the AUM is 3950 kg a pressure altitude of 1600 ft and RRPM of 94.5% will be required. Finally if a/V9 = 1.05 is desired at 3900 kg a height of 7300 ft and RRPM of 102.3% will be needed.

In order to meet all the test objectives it is therefore evident that the test team must plan each sortie in detail. It is usual to use altitude to generate changes in referred weight as well as changing altitude to maintain the desired referred weight for different referred RRPMs. If a sensible choice of referred weight(s) is made it may be possible to maintain hover height and change rotor speed thereby generating a test point at a different referred weight which will be completed at some other altitude. A sample set of test points is shown in Table 3.9 and an example plot of the relevant referred data

Table 3.9 Typical vertical performance test point matrix.

Start mass (kg)

Fuel

gone (kg)

Hp (ft)

OAT

(°С)

RRPM

(%)

W/jaL

(kgf)

ю/%9

4750

50

8000

-0.8

102.1

5750

1.05

4750

75

5100

4.9

97.2

5750

0.99

4750

100

6900

1.3

99.6

5760

1.02

4750

125

4500

6.1

100.4

5240

1.02

4750

150

7400

0.3

102.3

5500

1.05

4750

175

3300

8.5

97.9

5260

0.99

4750

200

6300

2.5

99.8

5510

1.02

4750

225

6700

1.7

102.6

5260

1.05

4750

250

4900

5.3

97.3

5490

0.99

image63

Fig. 3.20 Referred hover data – correct methodology.

is at Fig. 3.20. Note that it is now possible to make a judgement on the magnitude of any tip effects.

Tip effects evaluation

Tip effects are a complex subject and determining their presence can be difficult and time-consuming. There are, however, advantages in proving that they are absent. If the effect of referred RRPM (m 1^0) on referred power (Plam*) can be ignored then there exists the possibility of generating a greater range of referred weight (Wlam2) through changes in RRPM. There is also the added benefit that when determining
mission suitability the effect of OAT on referred RRPM can be ignored. Although for simplicity this discussion is restricted to the free-air hover, tip effects should be investigated at high forward speed.

3.5.3.1 Source of tip effects

Before the process of investigating tip effects can be described in detail it is important to consider what is meant by the term. A tip effect is an actual increase in power arising from a change in rotor RPM that cannot be eliminated by referring the parameters using the W/am2 method. Consider the effect of a change in rotor speed on the power required to hover at a given weight. Assuming that power can be given by:

P = Tvih +1 pbc Q3r4cd

and that it is referred by dividing by p)3, which is directly proportional to am3, then:

P = К(-Ц) = k(—^ +1 bcRCD am3 Ip)3l ^p)3 8 d

Thus as the rotor speed is varied the contribution to referred power arising from profile power will be constant provided the average profile drag coefficient (CD) remains unchanged. If, on the other hand as a result of changes in RRPM, the blades ‘see’ different AOAs and Mach numbers which cause variations in CD then alterations in referred power will arise. Before ascribing changes in referred power, at constant weight, solely to tip effects it is necessary to consider the effect of RRPM on induced power. Recalling that the induced velocity in the hover is given by:

= [T =( W 1;2

Vih = ^ 2pA = 2pA J

Thus the contribution to referred power from induced power is:

Tip effects evaluation

TVh = T ( W i;2 = ГГ ( W V/2 p)3 p )3 ^2pA J у 2A yp)2 J

Tip effects evaluation Подпись: w)31 + K4CD

Therefore:

Thus in order to assess the size of any tip effect it is only necessary to document the variation of referred power (P/am3) with rotor speed at constant referred weight (W/am2). Since several test points may be established at differing altitudes it is necessary to use referred RRPM (m/^0) instead of rotor speed.

image61

Fig. 3.18 Hover performance data – raw.

VERTICAL PERFORMANCE TESTING

From a practical viewpoint the difficulty with vertical performance testing is that of establishing and holding a steady zero-airspeed flight condition in which accurate measurements can be made. In order to establish such a condition in free flight it is necessary to use some means other than the ASI to indicate a true hover or to rely on a fixed, ground reference. The latter method is simplest but means that the tests must be carried out relatively close to the ground in as near still air conditions as possible (wind speeds less than 3 kts). Ballast or cable tension may be required to obtain a sufficient spread of hover weights.

The climb performance of a helicopter can be divided into two separate areas: vertical performance and forward flight climb and descent performance. The latter is used to determine the best rate of climb, optimum climb schedule and service ceiling. The former, together with hover performance data, is used to give the pilot the fullest possible information on the aircraft’s limits in axial flight by showing how vertical rate of climb varies with altitude, OAT, weight, wind speed and RRPM at a specified engine rating. The techniques employed here are reduced power verticals, maximum power verticals or low airspeed verticals. The likelihood that the conditions will be such that the tests can be carried out in still air is remote so it is normal practice to either climb vertically relative to the ground in low windspeed conditions and correct the results to zero windspeed or to climb vertically from a free-air hover.

3.5.1 Free flight hover testing

As derived above, the general power required relationships are:

p = Jw v V Z or _p_ = Jw V V Z _®_

sV9 Is’m’m’ ’^0/ ora3 lam2’ m’m’ ’^01

Подпись: 88 Helicopter Test and Evaluation

Table 3.4 Variation of referred weight (kgf) available at test site.

Atmosphere

ISA — 20°C

ISA

ISA + 15°C

2000 ft

10000 ft

2000 ft

10000 ft

2000 ft

10000 ft

n

95

105

95

105

95

105

95

105

95

105

95

105

8

0.917

0.917

0.862

0.862

0.986

0.986

0.931

0.931

1.038

1.038

0.983

0.983

9

0.930

0.930

0.688

0.688

0.930

0.930

0.688

0.688

0.930

0.930

0.688

0.688

a

1.014

1.014

0.798

0.798

0.943

0.943

0.738

0.738

0.895

0.895

0.699

0.699

CD

0.95

1.05

0.95

1.05

0.95

1.05

0.95

1.05

0.95

1.05

0.95

1.05

4200

4589

3756

5832

4774

4936

4041

6302

5159

5197

4254

6654

5447

5000

5463

4472

6943

5684

5877

4810

7502

6141

6187

5064

7922

6485


Rotor speed (%)

ISA – 20°C

ISA

ISA + 15°C

sea level

10 000 ft

sea level

10000 ft

sea level

10 000 ft

95

0.992

1.023

0.957

0.984

0.932

0.958

100

1.044

1.077

1.007

1.036

0.981

1.008

105

1.097

1.131

1.057

1.088

1.030

1.059

Table 3.5 Variation of referred rotor speed (%) available at test site.

Atmosphere

Подпись: Table 3.7 Test conditions required to match modified target referred parameters. Target Wl am2 6 300 6 300 6 300 Target mlVe 1.01 1.03 1.05 Wl 5 6 427 6 684 6 946 Start AUM (kg) 4 900 4 900 4900 Test altitude (ft) 7315 8 342 9 341 Expected OAT (°C) 0.5 -1.5 -3.5 Test RRPM (%) 98.4 100.0 101.6 End AUM (kg) 4 450 4 450 4450 Test altitude (ft) 9 823 10831 11813 Expected OAT (°C) -4.5 -6.4 -8.4 Test RRPM (%) 97.5 99.1 100.7 For the hover, V _ Vc _ 0, and in the free flight case ground effect is not an issue, therefore: Подпись:Подпись:

Table 3.6 Test conditions required to match original target referred parameters.

Target Wlam2

7 000

7 000

7000

Target mlVe

1.00

1.04

1.08

Wl5

7 000

7 571

8165

Start AUM (kg)

4 900

4 900

4900

Test altitude (ft)

9 543

11 556

13 465

Expected OAT (°C)

-3.9

-7.9

-11.7

Test RRPM (%)

96.7

99.8

102.9

End AUM (kg)

4 450

4 450

4450

Test altitude (ft)

12011

13 987

15 862

Expected OAT (°C)

-8.8

-12.7

-16.4

Test RRPM (%)

95.8

98.9

101.9

Rotor speed effects are evaluated by obtaining data at the same referred weight but over a range of mQ0. If the variation in ground effect with height is required, separate curves can be obtained for each value of hover height, Z, usually defined as the wheel

Target W/am2

4 400

5 500

6 600

Target m/V9

1.03

1.03

1.03

W/8

4 668

5 835

7002

Start AUM (kg)

4 200

4 900

4900

Test altitude (ft)

2 894

4 753

9 550

Expected OAT (°С)

9.3

5.6

-3.9

Test RRPM (%)

102.0

101.3

99.6

End AUM (kg)

3 750

4 450

4450

Test altitude (ft)

5 935

7 308

12018

Expected OAT (°C)

3.2

0.5

-8.8

Test RRPM (%)

100.9

100.4

98.7

Table 3.8 Test conditions required to match additional referred parameters.

or skid clearance above ground. If detailed results are not necessary it is usually sufficient to obtain results IGE and/or OGE. If hover height is not considered and m/V9 effects are insignificant then the results will be presented as a single curve of P/am2 against W/am2. This method of presentation is used regardless of the type of helicopter since rotor RPM changes should affect both parameters in the same proportion and a single curve should result. Had P/8^9 versus W/8 been used then, even with negligible tip effects, separate curves would still result for each m/^9 (see the discussion on tip effects given below).

VERTICAL PERFORMANCE TESTING Подпись: W am2 Подпись: 3/2 I + K2

At each of several values of m/^9, torque and rotor speed are measured at sufficient values of weight to cover the desired range of Wlam2. At each test point OAT, pressure altitude and engine data should also be recorded. Prior planning is required to ensure that the desired range of referred weights will be achieved. Simple theory predicts that if rotor RPM effects can be ignored, that is the profile drag coefficient is constant, then:

where K1 and K2 are constants.

If therefore P/am3 is plotted against (W/am2)3/2 the result will be a straight line provided K2 actually remains constant. Thus, in the absence of tip effects, the results obtained from the free-air hovering tests can be smoothed by the following method:

• Plot P/am3 against (W/am2)3/2.

• Draw the best straight line through the points.

• For desired values of W/am2, calculate (W/am2)2/2 and use the smoothed line to read off corresponding values of P/am2.

• Plot P/amз against W/am2.

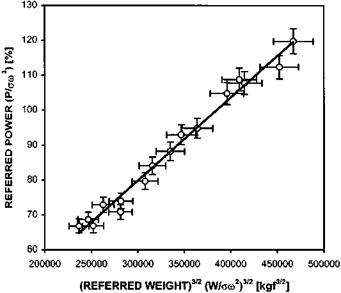
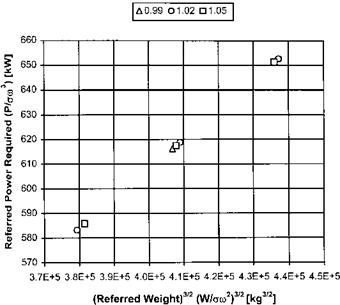
In Fig. 3.15 a typical set of test data is presented. A straight line fit has been applied along with error bars based on a 3% tolerance. Assuming that this is the accepted level of accuracy for the test it can be seen that the trend line falls within the error bars. Thus a single straight line fit is appropriate and RRPM effects can be ignored. This fit has been used to transfer the trend information to Fig. 3.16. (Note that the line presented in Fig. 3.16 is not straight since the independent variable is now W/am2.)

image58

Fig. 3.15 Typical hover performance test data.

image59

Fig. 3.16 Smoothed hover performance data.

3.5.2 Tethered hover testing

The same referred groups are used for tethered hovering tests as for free-air hover trials. In this case, however, hover height is an important parameter. The variation of

image60

Fig. 3.17 Typical tethered hover data.

ground effect with hover height can be measured accurately using tethering cables of different lengths. The relationship used is either:

p _ Jwz _m _p__ J_w_

5Ve V S ’ ’ 70/ or am* ’ ’ 70/

As discussed above the latter equation is most often used. The helicopter is established in a tethered hover with the cable taut and power is increased until the maximum permitted tension is achieved. Having taken all the relevant data, power is reduced in stages (data being recorded at each stage) until cable tension is almost lost. The cable tension simulates varying aircraft weights. Hover height is controlled by the cable length; various cable lengths providing a good range of heights is desirable. Results are usually presented as a carpet plot of Plam* against Wlam2 and Z. The ‘smoothing’ process described for free air hovering tests may be used for tethered hovering trials. Figure 3.17 illustrates the form in which the results finally appear. It is important to remember that tethered hovering trials must be carried out in as near still air conditions as possible, less than 3 kts is usually taken as acceptable [3.7].

Planning a level flight performance trial

3.4.9.1 Requirements

It is important that flight trials are carefully planned and that certain essential conditions are fulfilled if the maximum information is to be obtained from the minimum flight hours. The planning task may be summarized by the following questions:

• What test conditions are required?

• What characteristics (temperature and altitude) prevail at the proposed test site(s)?

• What test conditions can be obtained at the proposed test site(s)?

• What range of ballast and fuel states is required to complete the matrix of test conditions?

• How many flight hours are required?

3.4.9.2 Example: planning flight tests at constant W/сю2 and ю /^0

Suppose a helicopter is to be tested with an AUM range of 4000 kg to 5000 kg that is cleared to operate between sea level and 10000 ft pressure altitude The rotor speed can be varied in flight and has a power-on RRPM range of between 95% and 105% (standard RRPM is 100%). It is expected that in service the helicopter will experience temperature profiles between ISA — 30°C and ISA + 30°C. At the home establishment the trials will be conducted within the following constraints:

• Although the test aircraft can be ballasted to 5000 kg, a sensible minimum start mass is 4200 kg (2 crew and 45 minutes endurance).

• The helicopter has been authorized to operate at pressure altitudes up to 12000 ft for short periods to complete data runs as required.

• Average temperature profiles experienced at the home establishment are between ISA — 20°C and ISA + 15°C.

• Data gathering will not start below pressure altitudes of 2000 ft or above pressure altitudes of 10 000 ft.

• Referred rotor speeds will be selected using an ISA atmosphere as this is most representative of summer conditions at the test establishment.

From the test specification, it is possible to determine the range of referred parameters required to address the test objectives, see Table 3.2 and Table 3.3. Likewise the range of referred parameters available at the test site can be determined, see Tables

3.4 and 3.5. Comparing the test requirements with the available referred parameters reminds us that since rotor speed affects referred weight it will be impossible to target the maximum possible referred weight and rotor speed simultaneously. Therefore, a lower referred weight will have to be targeted for tip effects testing.

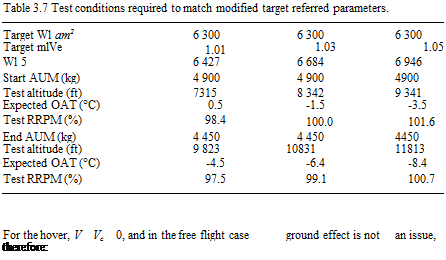
The interdependency of the test parameters requires an integrated approach to the selection of test parameters. Start by selecting a maximum referred weight of 7000 kgf for tip effects evaluation. This weight is the approximate mean referred weight available at 10000 ft. From the variation of referred rotor speed at 10000 ft, 1.00, 1.04 and 1.08 can be selected as the target referred rotor speeds. By assuming a fuel burn per data run (say 450 kgf) and an ISA atmosphere, the altitudes required to set the desired W/am2 can be identified, see Table 3.6. (Note that W/am2 multiplied by (m/V9)2 equals W/8, therefore a pressure altitude can be identified for any actual mass.) It can be seen that these targets are impractical since a pressure altitude above 12 000 ft is required to reduce the relative density as the rotor speed is increased to give the higher referred RRPM. Likewise as the altitude is raised to account for fuel burn the rotor

Подпись: 86 Helicopter Test and Evaluation

Table 3.2 Operational variation of referred weight (kgf).

Atmosphere

ISA — 30°C

ISA

ISA + 30°C

sea level

10000 ft

sea level

10000 ft

sea level

10000 ft

n

95

105

95

105

95

105

95

105

95

105

95

105

8

1.000

1.000

0.688

0.688

1.000

1.000

0.688

0.688

1.000

1.000

0.688

0.688

e

0.896

0.896

0.827

0.827

1.000

1.000

0.931

0.931

1.104

1.104

1.035

1.035

a

1.116

1.116

0.831

0.831

1.000

1.000

0.738

0.738

0.906

0.906

0.664

0.664

CD

0.95

1.05

0.95

1.05

0.95

1.05

0.95

1.05

0.95

1.05

0.95

1.05

4000

3971

3250

5331

4364

4432

3628

6002

4913

4894

4006

6673

5462

5000

4963

4063

6664

5455

5540

4535

7502

6141

6117

5007

8341

6828


Table 3.3 Operational variation of referred rotor speed (%).

Rotor speed (%)

Atmosphere

ISA – 30°C

ISA

ISA + 30°C

sea level

10 000 ft

sea level

10000 ft

sea level

10 000 ft

95

1.004

1.045

0.950

0.984

0.904

0.934

100

1.057

1.100

1.000

1.036

0.952

0.983

105

1.109

1.155

1.050

1.088

0.999

1.032

speed must be reduced in order to keep the desired referred RRPM. A revised test matrix can be developed but it will inevitably be more conservative, see Table 3.7.

From Table 3.7 it can be seen that a referred weight of 6300 kgf can be tested at three referred rotor speeds (1.01, 1.03, 1.05). On the assumption that tip effects are not present, additional referred weights to test at a fixed mean referred RRPM, say 1.03, can be selected. Table 3.8 shows a suitable range of referred weights.

Flight test techniques

Prior to take-off the helicopter loading is checked and the correct graphs, tables or hand-held computer program made available showing height to fly versus AUM or fuel gone and OAT. Care needs to be taken in selecting the combination of altitude and AUM used to obtain a given target referred weight as they both may limit the maximum and minimum speed that can be tested. Equally, consideration must be given to the order in which the speeds are flown so that the maximum coverage is obtained. It may therefore be necessary to either reballast or refuel the aircraft between a series of runs to contain the test height band within reasonable limits. It is worth remembering that provided the relevant referred parameters are kept constant, data gathered from several flights may be plotted together. This is one of the main advantages of the experimental method.

Before a test run is commenced, 1013 mbar is set on the altimeter sub-scale to ensure that it reads pressure altitude, and the position of all relevant secondary controls checked. The likely AUM of the aircraft at the start of the data run is calculated and a climb made to the altitude required to target the desired referred weight based on that estimated AUM. At this altitude the correct rotor RPM is set, if applicable, for the observed OAT. AUM, altitude, OAT and rotor RPM should then be re-checked and adjusted as necessary. Note that the target referred weight should be achieved approximately halfway through the conduct of the test point. If altimeter PECs are significant then due allowance will have to be made when reading the altimeter. If the atmospheric conditions are stable and the W/am2 method is being used time can be saved by first climbing to the top of the anticipated altitude band required for the complete sortie whilst documenting the outside air temperature. This provides the test aircrew with a complete air density profile thereby reducing the iteration required to obtain the target referred weights.

The following parameters are recorded when the helicopter is stabilized in level flight at the required airspeed:

• altitude;

• outside air temperature;

• airspeed;

• torque;

• rotor RPM;

• engine parameters (temperature and speed);

• fuel state;

• fuel flow;

• sideslip.

The test condition should be maintained for a minimum of one minute, ideally taking further readings of the above parameters at the middle and end of the period to determine a mean value of each parameter; the accuracy of the test condition itself and the fuel flow in the absence of appropriate instrumentation. In a given aircraft, the accuracy with which a test run can be flown will depend on the atmospheric conditions, the airspeed and the altitude. The following accuracies are typical:

• airspeed – no worse than +1 kt

• altitude – no worse than +20 ft of desired altitude with no perceptible change during the run

• rotor speed – essentially fixed

• slipball – central

• referred weight – within 0.5% of target.

In this context, the vertical speed indicator (VSI) rarely gives sufficiently accurate indications of zero climb or descent. On suitably equipped rotorcraft; maximum fuel flow measurement accuracy will be obtained by starting the stopwatch as a fuel counter clicks over and stopping timing, after approximately one minute, as click over of the final reading occurs, see Roots and Blake [3.6] for alternative methods.

General test conditions

Tests are normally made at three or four values of referred weight, which are selected to give a good coverage of results from the maximum to the minimum permitted AUM. Normally only a central CG is used, unless the CG range of the helicopter is large as changes in CG may affect the results significantly. Datum testing is conducted with the helicopter in a clean configuration before it is evaluated in its normal role fit. Accurate testing can only be conducted in clear air, away from clouds, fronts and turbulence. The best results are often obtained late in the evening, or at dawn, when the air is generally more stable [3.6].

A limited performance trial, targeting only three values of referred weight for example, may be conducted economically by using the same mass and testing across three altitude bands. To get the best coverage of results, one height should be as low as practicable and one should be close to the ceiling of the aircraft, with one intermediate altitude. The rotor RPMs to be used will depend upon the test methods selected and the aircraft’s engine and rotor governing system. If the rotor RPM cannot be varied in flight, tests are done at the normal governed RPM using the W/am2 weight group. Relative rotor speed (m) may also be ignored in the case of a constant­speeding rotor governing system, such as a FADEC equipped helicopter, as opposed to the system described above that does not allow the pilot to compensate for the effects of static droop in flight. Use of the W/a group permits a more compact presentation of results but does not portray the effects of changes in rotor Mach number. It should therefore be borne in mind that significant errors could arise if the results are used to predict performance in temperatures markedly different from those in which the tests were conducted.

Data is normally gathered throughout the speed range from the lowest speed that gives a sensible indication up to VH, in 10 kt increments, with 5 kt increments around VMP and close to VH. Engine air bleeds and other secondary controls (cabin heating, engine anti-icing, oil cooler shutters, blade de-icing and other heavy electrical loading) should be pre-set as specified by the test schedule or adjusted to maintain optimum engine conditions. Datum results are initially obtained with all secondary controls off, and fuel consumption penalties then determined with these systems switched on.

Choice of referred grouping

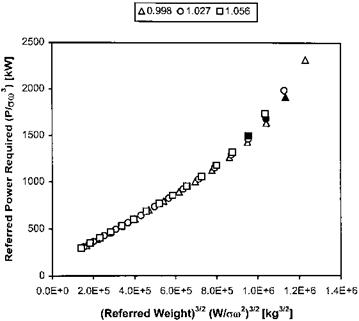
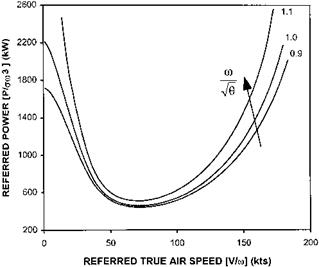
The choice of referred grouping is partly dependent on the test aircrew’s ability to adjust rotor speed in flight. Another factor to consider is the test objectives. If there is a requirement to assess the magnitude of compressibility and retreating blade stall effects (tip effects) then it is prudent to use the W/am2 method regardless. Consider the referred power required by a typical conventional helicopter as a function of referred true airspeed. If test data is plotted using the P/am3 grouping the absence of any tip effects, implied by a constant drag coefficient, will be immediately apparent by the coincidence of the curves. This is because all the referred parameters in this grouping contain RRPM (m) and so any increase in power in proportion to the increased rotor speed will be removed by the referring process. However, any increase in power not in proportion to RRPM (due in reality to an increased average drag coefficient) will be unaffected by the referring process and will be evident when plotted, see Fig. 3.14.

1.4.1 Engine characteristics

The manufacturer’s predictions of engine performance will be based on test bed data. It is important, therefore, during a comprehensive performance trial that engine

image57

Fig. 3.14 Effect of referred rotor speed on power required.

parameters are recorded on every flight so that these predictions can be confirmed. Additionally, the effects of inlet losses and air bleeds and of any deterioration throughout a prolonged flying period can be ascertained. If manufacturer’s engine performance data is not available then the effects of varying m/^0 and any other engine configuration parameter, such as the IGV or BCV position (A), on power available should be considered. Although experience has shown that these parameters do not generally alter the unique relationship between P/§V0, G/SV0, and N/-J0 over the working range of the engine they cannot be ignored in the absence of reliable data. They should be dealt with as follows. If m/^0 is critical then curves of referred power against referred N will vary with m/^0 due to changes in the efficiency of the free power turbine (FPT). Tests can be made at high, low and intermediate values of m/V0; interpolation will then be possible between them. If rotor speed does not vary, sorties can be flown at extremes of OAT to establish the required spread of values of 1/V0. If A is critical, generally because the IGVs are not fully open over the working range of the engine, differential corrections will have to be calculated to obtain the correct values of power and fuel flow.

When undertaking an evaluation of the level flight performance accurate calibration of the engine, the power instruments and the fuel flow measurement system is essential. Usually the engine will be bench tested at the manufacturer before and after the tests so that the results can be compared with the manufacturer’s predictions based on accurate test bed data. Some deterioration of engine condition is inevitable during a prolonged trial and so the post-trial engine bench tests are as important as the pre­trial bench tests. Test bed data is also used for the correction of the effects of engine bleeds, although the bleed ports can be blanked off to ensure that they do not affect the results. Roots and Blake [3.6] give more details on the use of calibrated engines and the importance of gathering engine data whilst conducting evaluations of aircraft performance.

Reduction of level flight performance data

It has been already been shown that the power required by a helicopter can be written in terms of referred groups as:

p = Уw V V Z _ш

aw3 lam2’ m’m’ ’VqJ

P = УW V V Z _m_

§7Q 5 , m, m ’ ’7ё/

In level flight, Vc = 0 and generally the aircraft will be outside ground effect. Thus:

P = УW V _m

aw3 I am2’ m ’ VQ!

P = У W V _m_

5V9 5 m VQ/

It is interesting to compare the latter relationship with the power coefficient formula reviewed earlier:

1 f 1

CP = 1.2XCT + 2 V A + – v(1 + 4.3^2 )CD + CPm + CPs

It has already been shown that X = f(p). Additionally it can be surmised that the power increment due to retreating blade stall will be a function of rotor speed and forward speed (advance ratio) hence CPs = f(p). Also the power loss due to com­pressibility will depend on rotor speed, forward speed and Mach number, so CPm = f(p, MB). Thus, the power coefficient formula can be written as:

CP = f(CT, p, MB)

Noting that for a given helicopter:

^ P P P

CP Л тлЗ ё r3 ё З

pAV 3 p )3 am3

„ T w w

CT ЛТ/2 ё n2 ё 2

pAV 2 p )2 affl2

V V V

Reduction of level flight performance data

P = — ос— ё — Vt ) m

The direct correlation between performance expressed in coefficient terms and perfor­mance expressed using referred parameters can be seen readily.

Since SFC is rarely constant with power it is necessary to document the variation of referred fuel flow rate with referred TAS, referred weight and referred rotor speed

image55

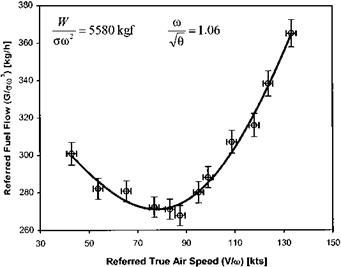
Fig. 3.12 Variation of referred fuel flow with referred TAS – test data.


to determine the endurance performance. Since the fuel flow rate of a gas turbine engine will be dependent on the power generated it can be assumed that G = f(P). Thus referred fuel flow is directly related to referred power:

G = Jw V _m_

am3 Uffl2’m ’ Vq)

G = JW V _m

s Vq | s m Vq/

Figure 3.12 shows a typical variation of referred fuel flow (G/am2) with VIm for a single value of Wlam2 and ml-VQ.

Reduction of level flight performance data Reduction of level flight performance data Reduction of level flight performance data Reduction of level flight performance data

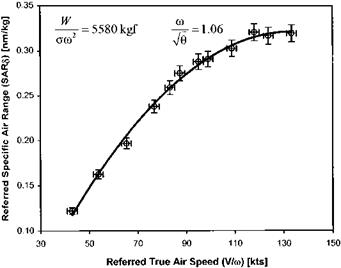
Likewise, it is necessary to document how referred specific air range varies with referred weight, referred true airspeed and referred rotor speed. Since SAR is equal to the ratio of true airspeed and fuel flow, their referred forms can be used in order to find the referred form of specific air range. Thus:

Подпись: Um2’ m ’VQ’Qam2! lam^ m ’VQ’Qa/ lam^ m ’VQ’S= f(W V _m________ =f(W V m _L = JW V m 1

image56

Fig. 3.13 Variation of referred SAR with referred TAS – test data. and:

cad s A w V m

SAR 8 = f —r, —, ^

offl2 m V6/

Figure 3.13 shows a typical variation of referred SAR (SAR 8) with V/m for a single value of Wlam2 and m/^0.

Effects of variable specific fuel consumption

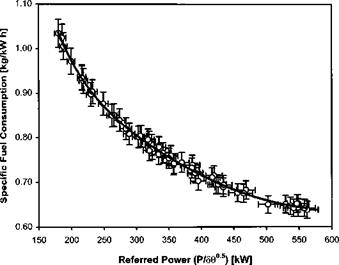
The foregoing discussion has assumed constant SFC but a real engine will almost certainly not conform to this. Specific fuel consumption will almost certainly vary

image53

Fig. 3.10 Estimating VME from variations in power for level flight.

image54

Fig. 3.11 Variation of SFC with referred power – test data.

with power, altitude and RRPM, usually falling as power and altitude increase and as RRPM decreases. Figure 3.11 shows a typical variation of SFC with referred power (P/8V0). As power increases, the engine operates more efficiently and SFC decreases. It is, therefore, often better to set a higher RRPM and fly at a higher true airspeed than that predicted by the simple theory if maximum SAR is to be achieved. Likewise, the endurance may be improved by operating at a slightly higher rotor speed. Based on research by Langdon [3.5] it can be shown that the extra power required to fly is offset by the improved SFC.