Category Helicopter Test and Evaluation

Performance Testing

3.1 INTRODUCTION

Methods for measuring the steady-state performance of gas turbine-engined helicopters commonly use non-dimensional parameters [3.1]. These parameters consist of groups of relevant dimensional quantities arranged by means of dimensional analysis. Perfor­mance flight test then involves determining the relationship between pairs of non­dimensional parameters whilst the others are held constant. We shall see that this experimental method of testing reduces any limitations in the applicability of forward speed, rate of climb, power and fuel flow test data. This is because data converted into a non-dimensional form can be used to produce information relevant to atmospheric conditions and aircraft masses different from those actually tested. Consequently, with few exceptions, a relatively small number of tests at carefully chosen test sites can produce information relevant to much of the helicopter’s flight envelope. The experimental method does however have some disadvantages in terms of planning and in the choice of non-dimensional grouping:

• Although the test method can yield large quantities of relevant data from a few test points [3.2] it requires detailed and careful pre-flight planning if the full utility of the method is to be achieved;

• The method can appear vague with alternative groupings possible;

• It is possible to require flight conditions, in terms of the non-dimensional groupings, that are outside the limitations of the aircraft;

• Performance limiting factors that depend on actual conditions may not be fully replicated although matching non-dimensional values have been targeted successfully.

High hover height

If the pilot suffers a total power failure when hovering some distance from the ground his subsequent actions are somewhat different than those described above. He cannot simply bleed energy from the rotor in an attempt to arrest the rate of descent since the hover height is too high and he would achieve minimum sustainable rotor speed long before reaching the surface. Instead the pilot will initially dive the aircraft, increasing the kinetic energy of the vehicle at the expense of its potential energy, whilst attempting to maintain rotor speed within the power-off limits. At some altitude much lower than the original hover height he will conduct a cyclic flare EOL at a speed close to VMP. Since VCR is dependent on both aircraft and rotor performance (VMP and CL/s) it is possible to relate the high hover height (hHI) to this critical speed [2.28 and 2.29]. For the example light helicopter, hHI = 276 ft.

1.15.1 Scaled avoid curve

Using the four key data values: hLO, hCR, VCR and hHI, a scaled avoid curve can be constructed. Figure 2.40 shows such a curve for the light helicopter example and compares it with published data for an actual helicopter of broadly equivalent size and mass. Note that the avoid area expands somewhat if the AUM is raised from 1800 kg to 1900 kg (the limit of applicability of the published data) and a minimum power speed of 65 KTAS is used. Alternatively if the original VMP is used with the higher AUM and a longer delay time is assumed then although modified charts are required to determine VCR and hHI [2.6] a closer approximation can be achieved, see also Fig. 2.40. CR HI

image43

Fig. 2.40 Scaled avoid curves.


Chapter 3

The knee point

The knee point (hCR, VCR) is determined next by calculating the minimum power speed for the particular all-up-mass, rotor speed and atmospheric condition of interest. This point represents the minimum speed below which there exists a range of heights (AGL)
that should be avoided. The minimum, or critical height, is not scaled and is taken as a fixed value regardless of aircraft configuration and only alters if the pilot delay time is changed. In FARs a one-second delay is assumed for height-velocity points above the knee and hCR is taken as 95 feet. US Military Standards on the other hand assume a two-second delay and therefore hCR is raised to 120 feet. Pegg [2.28] relates empirically the critical speed (VCR) to the minimum power speed and the mean aerofoil lift coefficient (CL/s) at the same speed. Although derived from a small data set this relationship does include the key variables. In most cases following an engine failure the pilot will attempt to accelerate to an EOL speed of around VMP and the prevailing value of CL/s will indicate the margin, below rotor blade stall, in which the pilot can operate. Note that CL/s is given by:

CL = 2 Cl = 2(_VlY mg = 2mg

s s ^VMP) pAbVl pAbVMP

For the example light helicopter (Ab = 4.4 m2, m = 1800 kg) the minimum power speed is 55 KTAS and thus CL/s = 8.2. Consequently VCR equals approximately 30 KTAS.

Lower hover height

First estimation is made of the maximum height from which a vertical engine-off landing can be performed without damage to the undercarriage. This lower hover height, hLO, is calculated by assuming that the whole manoeuvre is conducted at a RoD equal to the limiting sink rate for the landing gear, VLG, and lasts as long as the energy stored in the rotor can be used to provide hover power. Since the rotor RPM will decay, as energy is bled away, the blade loading coefficient will rise even though the thrust produced will remain approximately constant. Thus the time available for the engine-off (which is analogous to the rotor decay time mentioned earlier) can be related to the ratio of the blade loading at the instant of engine failure to some nominal maximum value (Pegg [2.28] uses 0.2). Hence:

1


mg


VLGI)n2»,


0.2 І pAb(R)nom)


image40

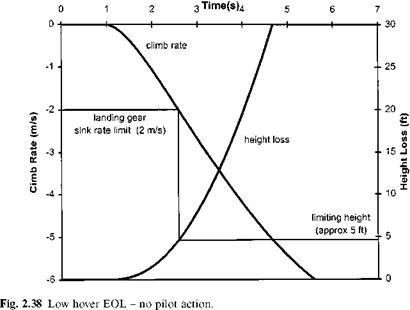
Consider a light helicopter fitted with an undercarriage stressed to accept a sink rate of 2 m/s and operating in SL-ISA conditions. Thus if I = 1000 kgm2, R = 5.25 m, Ab = 4.4 m2, m = 1800 kg, )nom = 39.8 rad/s, and PIGE = 191.7 kW, then hLO = 9.6 ft. It is of interest to compare this crude estimate with the results from a more sophisticated model. Using the equations developed above it is possible to predict the thrust developed and the torque required by the main rotor as a function of rotor speed and collective pitch. This data can then be used to predict the rate of descent, and subsequent height loss, following a power failure in the hover. Figure 2.38 shows the situation if the pilot elects to maintain the collective pitch fixed at its hover value.

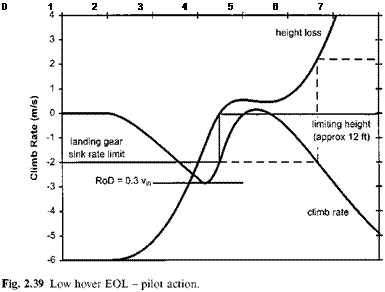
Approximately 1.6 s after total power loss the helicopter is descending vertically at 2 m/s and has fallen 5 ft. Thus if the engine(s) were to fail at some higher hover height and the pilot failed to react, damage to the undercarriage would occur. In reality a higher value of hLO is allowable since the pilot can be expected to utilize the energy stored in the rotor to cushion the landing. This situation is shown in Fig. 2.39. Here the pilot allows the RoD to build up to the onset of incipient vortex ring (0.3vih) before rapidly raising the collective lever to reduce the vertical velocity. The height lost before the RoD reduces back to 2 m/s is around 12 ft. Thus if the pilot increases collective pitch rapidly at just the right time he can suffer a total power failure whilst hovering at about 10 ft without damage to the aircraft.

Time(s)


image41

Подпись:20

18

16

14

12 £ 0 W

10 ° +•» Г

о Ш

8 о z

THE AVOID CURVE

The foregoing paragraphs have discussed the factors affecting the rate of rotor speed decay following an engine failure and noted how timely action by the pilot can establish the helicopter in a stable autorotation. The flare manoeuvre has been described and using a relatively simplistic analysis of the trajectory of the helicopter it has been possible to determine the optimum height/speed combination at which to execute this manoeuvre. It is now necessary to consider the effect of airspeed on the risk associated with operating a single-engined helicopter close to the ground.

Given an appropriate combination of airspeed and height (AGL) the pilot will be able to manage the balance of kinetic energy (stored in both the rotor and the fuselage) and the potential energy to arrive at a gate condition from which a safe EOL is assured. However at low speed the pilot may have insufficient height, or potential energy, available to accelerate the aircraft to the gate speed. Alternatively when operating at low speed very close to the ground, say in a high hover, there may be insufficient kinetic energy available in the rotor to reduce the rate of descent to a survivable value. Equally a transit at high speed and low height may not give the pilot sufficient time to react to the engine failure cues and initiate a zoom climb to the EOL gate condition.

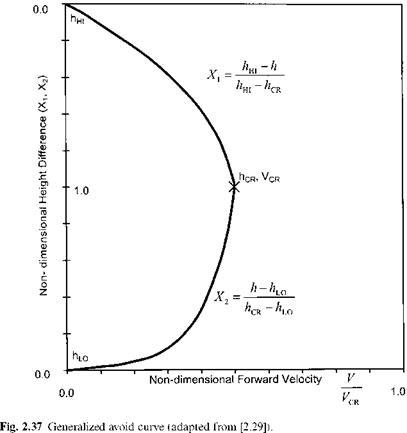
Consequently for most helicopters there exists a set of height-airspeed combinations which should be ‘avoided’ to prevent hazarding the aircraft in the event of total power loss. These critical parameters are typically presented graphically in an avoid curve or height-velocity diagram. The similar shape of most avoid curves makes it possible to produce a generalized non-dimensional curve, see Fig. 2.37, that can then be applied to a variety of rotorcraft and also scaled to take account of density altitude and gross weight [2.28].

Estimating the minimum touchdown speed

It is possible to estimate the theoretical minimum touchdown speed resulting from an idealized engine-off landing using some of the concepts introduced above [2.6 and 2.27]. The flare angle that can be employed will be affected by the maximum pitch rate that can be generated and the time the pilot has to level the aircraft. During the level manoeuvre, because the helicopter is still moving forward, it can be assumed that OGE hover power and thrust must be maintained even though the rotor speed is rapidly decaying. Since useable energy is stored in the rotor in the form of kinetic energy of rotation if the pilot could allow the rotor speed to decay to zero at touchdown then he could make use of the theoretical maximum, given by:

maximum energy available = 2 I)2om

Unfortunately this is not possible since as the rotor speed decays the angle of attack must be increased if the thrust produced is to remain constant. Consequently the thrust coefficient, or rotor blade lift coefficient, will rise, as NR reduces, up to some maximum value beyond which rotor performance is not sustainable. Hence:

Подпись:Подпись: 2 nom useable energy = 21()

Since:

) =) “min ЙЬпош

then:

Подпись: C і ^Lnom 1 _ C useable energy = 21)

This energy is used to provide hover power and therefore the available time during which the pilot must level the helicopter will be given by:

time available to level aircraft = *t =

I


C,


2P0


C,


Estimating the minimum touchdown speed

Thus:

Y )

0max = aTPPmax = qmax*t = 16 *Bl*t

Therefore 0max is the maximum fuselage pitch angle change that can be generated in the time available. If this calculated angle exceeds 45° then, as suggested above, 45° is used since this angle gives the theoretical maximum reduction in both horizontal and vertical velocities. (In many instances the pilot will be very reluctant to flare by more than 25% being concerned about either a tail strike or loss of forward vision.)

Подпись: Fig. 2.34 EOL glide geometry.

Having determined the flare angle, the forward speed achieved before the pilot begins to level the aircraft is then related to an equivalent stable autorotative condition. This simple approximation assumes that the flare reduces the sink rate to approximately zero. From Fig. 2.34, which shows the glide geometry, it can be seen that just before the helicopter is rotated nose-down the forward advance will equal the value of Vg, or Vf cos 0max, obtained from steady autorotative data.

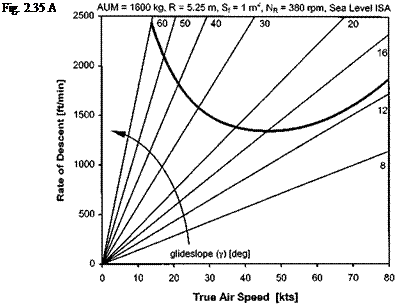
Figure 2.35 shows the steady autorotative performance for an example helicopter. At an AUM of 1600 kg this helicopter will be operating at a mean lift coefficient of 0.133, given by:

2mg

P )2ош bcR1

Under sea level, ISA conditions the rotor speed at 75% rotor radius equates to 0.45M and the hover power is 196.6 kW. If the rotor has an inertia of 1000 kgm2 and is fitted with a NACA 0012 aerofoil then CLmax is approximately 1.0 and At equals 3.5 s. Such a large value of At gives the pilot plenty of time to level the aircraft. Therefore the only concern for the pilot when selecting a flare angle is ensuring that a reasonably low run-on speed is achieved without undue risk to the tail boom and empennage.

Just before the pilot begins to level the aircraft vertical forces are assumed to be in equilibrium. As the aircraft is levelled a steadily diminishing rearwards component of thrust continues to provide a decelerative force. The average deceleration is therefore give by:

F T

Подпись: maximage38
a = — = — sin 0 m 2m

Estimating the minimum touchdown speed

But:

Therefore, assuming a constant deceleration, the velocity reduction during the level manoeuvre is determined using:

image39

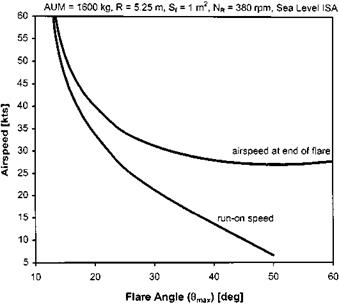
Fig. 2.36 Effect of flare angle on run-on speed.

g

A v = aAt = 2 tan 0max At

This relationship indicates that if the pilot is able to select a high flare angle he can significantly reduce the run on speed. Figure 2.36 shows the reduction in speed that can be achieved at various flare angles.

In practice the method described here gives reasonable approximations to the minimum possible run-on speed although it ignores important actions the pilot will typically make in a real EOL. First it is common practice to allow NR to increase during the flare, this capitalizes on the natural tendency of the rotor to accelerate and, at the expense of a slightly higher closure rate, puts energy into the rotor for use during the ‘check’. During the check, a manoeuvre not included in the previous analysis, the collective pitch is rapidly increased causing a temporary rise in thrust and further reducing the glide velocity below that determined by the pitch attitude. Note also that some helicopters will accelerate if levelled completely.

Even in the most advantageous circumstances with tight control of airspeed and rotor RPM maintained during a period of stable autorotative flight, the pilot must still assess the optimum time to commence the flare manoeuvre with a high degree of accuracy. If the flare is commenced too high or too low the subsequent landing may be more hazardous than necessary! Equally if the airspeed on entry to the flare is excessive the flare will be less effective in reducing the horizontal velocity component resulting in a high run-on speed. Alternatively if the airspeed on initiation of the flare is too low insufficient rotor energy may be available to cushion the landing. Con­sequently within the qualification process for new single-engined helicopters there will be an EOL testing phase during which flares at various combinations of airspeed and

height will be performed. Such tests will be conducted in order to determine which combination minimizes the difficulty of the complete engine-off landing.

The flare, the check and the level manoeuvre

A successful touchdown occurs at the end of a series of manoeuvres designed to transfer the helicopter from a condition of moderate horizontal and vertical velocity to a condition of little or no velocity in either direction [2.6]. The following design features, along with an assessment of the acceptable level of damage, will affect the flare angle the pilot can employ and the aircraft attitude, sink rate and run-on speed allowed at ground contact: [1]

The idealized manoeuvre begins with a cyclic flare at constant collective pitch during which the increased rotor thrust (affected by any change in rotor speed) and aft disk tilt are used to decrease both the horizontal and vertical velocity components. The maximum pitch angle used by the pilot in the flare is often a matter of personal preference being affected by issues such as field of view. A maximum flare angle of 45° is used in the analysis given below as it gives a minimum theoretical result by ensuring that the sink rate is reduced by the greatest possible amount. At the end of this flare the aircraft should be close to the ground with its vertical velocity equal to zero (or at least below the design sink rate of the undercarriage) and with its horizontal velocity corresponding to autorotation at the angle of attack to which the rotor has been pitched. At this stage the pitch attitude will be typically much greater than that necessary to avoid a tail strike and considerable stored energy will remain in the rotor. The pilot will therefore rotate the helicopter nose-down towards a level attitude and use collective pitch to cushion the landing. Although in the idealized manoeuvre the pilot can use longitudinal cyclic and collective pitch in combination to level the aircraft whilst maintaining hovering thrust, at the expense of rotor speed, a different strategy is often adopted. The pilot will perform cyclic flare as previously described and will maintain it as long as possible. Eventually the flare effect will diminish to the point that the RoD reaches a minimum and starts to increase again. At this instant a rapid collective pull, or ‘check’, is made using some of the rotor energy to further reduce the horizontal and vertical velocity components. Shortly afterwards the helicopter is rotated nose-down and more collective pitch is used to minimize the sink rate as the aircraft is run on to the ground. This technique is summarized using the maxim ‘flare – check-level ’.

Speeds for maximum range and endurance

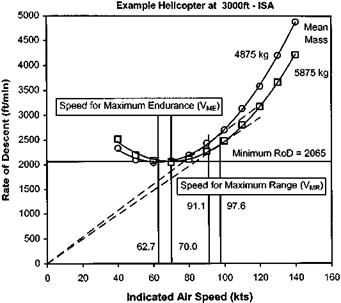
Since the variation of RoD in autorotation with airspeed resembles a power curve it is possible to use it to identify speeds for maximum range or endurance. In an autorotative descent the helicopter will obviously remain aloft longer if it is flown at the speed that results in the lowest rate of descent. Therefore VME is the ‘bucket speed’ obtained from the performance curve, see Fig. 2.33. An autorotative performance curve typically presents RoD versus indicated airspeed. If the pitch attitude of the aircraft during the descent is not excessive and the pitot-static system is free of significant errors it can be assumed that the curve presents two velocities along orthogonal axes (forward advance and rate of descent). Consequently the slope of a line from the origin that intersects the performance curve represents the angle of glide and therefore the speed that gives the minimum angle (that is tangential to the performance curve) will be VMR, the ‘range speed’ in autorotation, see Fig. 2.33.

2.13 FLARE CHARACTERISTICS AND ENGINE-OFF LANDINGS

By examining the autorotative performance of a typical helicopter and noting the conditions leading to entry into vortex ring it has been possible to show that engine – off flight can be conducted safely at all airspeeds provided the rotor speed required falls within the power-off range for the rotor. In fact stable autorotations are possible even in vertical flight but these often result in high rates of descent. High RoDs do not present a problem provided they allow sufficient time for the pilot to select a suitable landing site and compose himself for the ensuing engine-off landing. In theory,

image36

Fig. 2.33 Autorotative performance speeds.

if the problems of vortex ring are ignored, it is possible to autorotate vertically and by applying increased collective pitch, at the correct moment, arrest the sink rate to land with zero ground speed. However, from the typical autorotative performance detailed above it is more likely that the pilot will be descending at VME. Although he may have opted to accelerate to VMR and/or droop the rotor, to increase his time aloft or cover ground more efficiently, he will inevitably reselect VME and raise the rotor speed before attempting a landing. The raised NR stores more energy for use in the landing phase of the manoeuvre.

AUTOROTATIVE PERFORMANCE

As a consequence of the problems associated with the vortex-ring state and visually clearing the proposed landing sight, it is common practice for pilots to conduct autorotative descents in forward flight rather than in vertical flight. It is therefore often necessary to determine the performance of helicopters operating in a stable autorotation at some forward airspeed. The approach [2.26] is based on the familiar equations of forward flight and starts by calculating the vertical (FZ) and horizontal (FX) forces that must be balanced by rotor:

FX = 2 pV 2Sf

FZ = mg

where Sf = frontal drag area.

The drag force, FX, gives rise to a power requirement (the parasite power Ppar) which is added to the rotor profile power to give the shaft power (PS) that must be provided by the rate of descent:

PS = Ppr + Ppar = 8 pbcVT RCd(1 + 4.3p2) + FXV

image32

Fig. 2.29 Blade conditions – hover and vertical autorotation.


Because this shaft power must be extracted from the rotor, by a rate of descent, it is given a negative sign before being normalized using the hover power (PH):

AUTOROTATIVE PERFORMANCE Подпись: (2.26)

– (P)

where 0 is the disk tilt (tan 0 — FX/FZ) and w0 is the vertical component of the induced velocity.

Подпись: (1 + tan2 0) Подпись: Wo Vi,_ AUTOROTATIVE PERFORMANCE Подпись: Wo Vi,_ AUTOROTATIVE PERFORMANCE Подпись: Wo Vi,_ AUTOROTATIVE PERFORMANCE

A momentum analysis of a descending rotor in forward flight yields [2.26]:

(2.27)

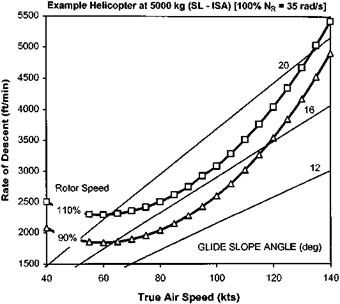
Equations (2.26) and (2.27) can be solved simultaneously for given values of PS/PH, Vf and vih to determine Vv (the autorotative rate of descent, RoD). These equations can also be used to predict the effect of aircraft configuration and flight condition on the autorotative performance, see Figs 2.30 to 2.32, which show the effect of aircraft mass, altitude and rotor speed.

AUTOROTATIVE PERFORMANCE

image33

Fig. 2.30 Autorotative performance – effect of all-up-mass.


Example Helicopter at 5000 kg

image34

Fig. 2.31 Autorotative performance – effect of altitude.


image35

Fig. 2.32 Autorotative performance – effect of rotor speed.

Windmilling rotors and autorotation

In power-off flight the rotor blades may be in a state of true autorotation or they may be ‘windmilling’. In a true autorotation the blades are set at a pitch angle that

nominal rotor speed 35 rad/s 0 2 4


Time (s)
10


14


16


18


20


12


If

і I

P r


о £


Подпись: Vertical Velocity (ft/min)
Подпись: Performance Theory 49

Fig. 2.25 Effect of pilot action on autorotative flight conditions.


image28

image29

Fig. 2.26 Definition of key rotor speeds associated with delay time testing.

image30

Fig. 2.27 Effect of increasing delay time on rotor speed decay.

combines with the rate of descent to produce no net torque and thereby stabilizes the rotor speed. From this condition the pilot can make minor changes in collective pitch to reduce or increase the rotor speed. If the balance of in-plane forces results in an accelerative condition the rotor blades are said to be windmilling. Figure 2.29 compares

image31

Fig. 2.28 In-flight cross-plot – recovery NR versus minimum NR.

the radial variation of elemental thrust and torque for the example rotor in a hover (at 5000 kg) and in a true vertical autorotation. Note how the requirement to balance the accelerative and decelerative in-plane forces along the blade length changes the lift distribution. Likewise the drag associated with the blade root and the tip-loss region results in the need for negative torque in the region 0.25 < rIR < 0.85.