Category Management and Minimisation of Uncertainties and Errors in Numerical Aerodynamics

The Method of Iterated Defect Correction

The defect correction approach was originally proposed by Zadunaisky ([22], [23]) for the estimation of the global discretization error in ordinary differential equa­tions. The method was then generalized by Stetter [18] who introduced the iterative procedure which is applied in this work to partial differential equations. A number of theoretical investigations were done for ordinary differential equations by Frank ([5], [6]). Further papers of Pereyra ([15], [14]) show a different way of applying the defect correction method and gives additional analysis of the method. A nice overview on the defect correction approach can be found in Stetter [19] where he gives an overview of the different procedures. The proposed iterative defect correc­tion method in this work is based on the procedure introduced by Stetter in [18] for ordinary differential equations. As was shown by Frank and Ueberhuber in [7] the iterated defect correction can also be applied on partial differential equations.

For the sake of simplicity we describe in the following the employed iterated defect correction on the example of a scalar one dimensional evolution equation

Mt + f {M)x = (1)

Подпись: LhMh rh Подпись: with Lll = -r—, dx Подпись: (2)

keeping in mind that the whole procedure can be extended to multi dimensions and to diffusion fluxes which additionally depend on Vm, as it is the case for the Navier-Stokes equations. As mentioned before, we focus on steady solutions, i. e., ut = 0. The time dependence in (1) is used only for the iteration of the approximate solution to a steady state. Conform with the convention in the cited papers we write the equation (1) in the abstract form

where the operator L is the exact linear or nonlinear differential operator and Lh is the discretized operator with the mesh width parameter h. For Lh we impose a stable, consistent and fast invertible operator, which is easily achieved by an oper­ator with a low consistency order of one or two. For the theory of the iterated defect correction the operator Lh can also be of higher order. For practical calculations it is more interesting to correct a first or second order accurate method which is often applied in practice. Equation (2) will be called the basis method with the solution uh computed by inversion of the operator Lh:

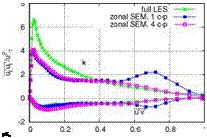
Mh = L-1rh. (3)

Additionally we need another numerical method for the original problem (1) on the same mesh, but with a higher consistency order

Подпись: (4)ShWh = rh-

(4) . This higher order discretization will only be used to estimate the local defect and is applied once per defect iteration in that form. Instead of solving directly the higher order discrete problem which may need a lot of time and development of the solution procedure, the modified problem

LhMh rh dh (5)

is solved using the basic method (2). With dh = Shwh – Lhuh the local defect we apply equation (5) iteratively

LhM[k+1]= rh – df+1] k = 1,2,3,… ,NiDeC (6)

with the defect iteration index k and NIDeC the maximum defect correction iterations, converging towards the solution wh, the reconstruction polyomial higher order. The whole defect correction procedure can be formulated in the following step by step description.

1.

The Method of Iterated Defect Correction Подпись: L-1f[0] Lh rh Подпись: [0] with rh = rh Подпись: (7)

We start with a steady solution

of our basic method (2). The approximated solution uh is then reconstructed with the weighted essentially non oscillatory scheme, which will be described in sec-

[k]

tion 3. The reconstruction produces a polynomial distribution wlh of the integral average in each grid cell.

2. Applying now the operator of higher order consistency Sh to the reconstructed

[k] [k+1]

Подпись: d[k+1] dh The Method of Iterated Defect Correction Подпись: [ k] [ k] Shwh Lhuh 7 [ k] rh- dlh ■ Подпись: (8)

solution wh we compute the local defect dlh J for the next defect correction iteration k +1:

3. This defect is then subtracted as a source term on the right hand side of equation

(2) and the modified equation

Lhuhk+1]= rh – df+1] (9)

= rh – (Shwh – Lhuf^

is solved with the basic method, applying the inverse operator Lh-1. One gets then the corrected solution uhk+1] after the k-th defect iteration, converging for

Lhul+l]« Lhuf. (10)

With this convergence criteria, equation (9) reduces to the method higher order (4), with wh the reconstruction polynomial.

Equation (5) is also called the "neighboring problem" with respect to the original formulation of the defect correction by Zadunaisky. For the process of iterated defect correction one must assume that (6) and (2) are neighboring mathematical problems. Since wh represents a polynomial reconstruction of the basic solution uh on the same mesh, the defect dh as defined in equation (8) is "small" and so the assumption of the "neighboring problem" is plausible.

The Method of Iterated Defect Correction The Method of Iterated Defect Correction Подпись: (11)

As we use a finite volume scheme for the basic method we can write the modified equation (5) in a semi discrete form defined on the interval, xj+i]x[ftn +At] with u = uh, being the discrete state in the cell i, as

tn+Atxi+1/2

Подпись: with

Подпись:R(Qi) = j J f (Qi)xdxdt,

tn xi-1 /2

whereas Qi is considered as a placeholder for uf u[k+1] and wf^. As common for a finite volume approach the unknown physical flux f (Qi) is replaced by an appro­priate numerical flux approximation g. і on the cell border of two adjacent cells. The numerical flux depends only on the states left and right of the cell interface:

g.+1 = #(=£?“ і, і), with defining the state on the interface in the cell itself

and Q+ being the state on the interface in the neighboring cell. If we choose as a simple example a basic method of first order in time and space, equation (11) yields

[k+i],+ )^_dk+i] (13)

Подпись: [k+i] _ At_ dh ~ Ax Подпись: g(wi: Подпись: [k],+ [k],- [}],+ , 1 )-g(w 1 1 ) Подпись: (14)

with

At f , [k]

Подпись: Ax— Spli

an approximation of the corrected state uf+1] in the cell i. We point out that the

The Method of Iterated Defect Correction Подпись: [ k] , - [ k] , + wi]’ , wi ]’ Подпись: ndS f The Method of Iterated Defect Correction The Method of Iterated Defect Correction Подпись: OKSK , Подпись: (15)

integral of the higher order fluxes f (wf) have to be computed with an appropriate numerical integration of accuracy higher than the one of the basic method. In the case of 1D there is no need of such an integration, the interface being the only integration point. For 2D or 3D discretizations an efficient integration scheme is necessary. In our case we use Gauss quadrature. This leads to an approximation of the flux integral in cell i as

where noP and rnj denote the number and the weights of the Gauss integration points j on the interface K, respectively, SK is the length or the surface and nK is the outward pointing unit normal vector. If the polynomial degree of the reconstruction is chosen to be p’ > p, with p, being the polynomial degree of the basic method, we take nop = p-^- for the 2D case, which is accurate up to a polynomial degree of p’. In the 3D case we use a rather sub-optimal number hgp = (p^)2 of Gauss points which is nevertheless accurate up to a polynomial degree p’.

The Application of Iterated Defect Corrections Based on WENO Reconstruction

Alexander Filimon and Claus-Dieter Munz

Abstract. In this article we apply the procedure of the iterated defect correc­tion method to the Euler equations as well as to the Navier-Stokes equations. One building block in the defect correction approach is the lower order basic method, usually first or second order accurate. This scheme gives a steady solution of low accuracy as the starting point. The second building block is the WENO reconstruc­tion step to estimate the local defect. The local defect is put into the original equation as source on the right hand side with a minus sign. The resulting modified equation is then again solved with the low order scheme. Due to the source term with the local defect the order of accuracy is iteratively shifted to the order of the reconstruction. We show numerical results for several validation test cases and applications.

1 Introduction

Numerical simulations of the equations of fluid mechanics contain unavoidable er­rors due to several necessary approximations. To analyze these errors is crucial for the evaluation of the reliability of the numerical results. In the following we fo­cus ourselves to the discretization errors. This means, that the modeling errors are excluded and the exact solution of the governing equations is supposed to be the reference solution of the described physical phenomenon.

The discretization errors can be separated into local and global discretization errors. By inserting the exact solution into the discretized equations, the local dis­cretization error, also known as the local defect of a numerical approximation, can be determined. The more significant global discretization error gives the difference

Alexander Filimon • Claus-Dieter Munz

Institute of Aerodynamics and Gas Dynamics, 70569 Stuttgart, Germany e-mail: {filimon, munz}@iag. uni-stuttgart. de

B. Eisfeld et al. (Eds.): Management & Minimisation of Uncert. & Errors, NNFM 122, pp. 129-154. DOI: 10.1007/978-3-642-36185-2_6 © Springer-Verlag Berlin Heidelberg 2013

between the numerical and the exact solution. In both cases the exact solution is needed, which makes the error approximation for real applications cumbersome. A common approach is to run the same problem on several meshes with differ­ent step size h. A mesh convergence study allow then to compute the so called experimental convergence rate. Finally, a Richardson extrapolation can be used to determine the best approximate solution together with an estimation of the global discretization error. In practical 3D applications with complex geometries, this ap­proach becomes cumbersome and sometimes even unfeasible because of the high computational costs. Our approach allows an error approximation for steady prob­lems on the original mesh by using a polynomial reconstruction within the defect correction method.

Starting with a steady solution of a first or second order accurate finite volume scheme, we employ the modified weighted essentially non oscillatory (WENO) re­construction scheme of Dumbser and Kaser [4] for unstructured meshes. The res­ulting polynomial distribution allows an improved flux computation which can be applied to estimate the local discretization error. The method of the iterated defect correction (IDeC) consists of subtracting this local defect as a source term on the right hand side of the original equations [23, 19]. The now modified equations are solved with the original method of first or second order accuracy, in the following also called the basic method or the basic scheme, resulting into a new corrected steady solution. A further reconstruction of the corrected solution yields a better estimation of the local defect which is now used in the modified equations. Iterat­ively applied, the method of the defect correction shifts the order of accuracy of the basic scheme to the higher order of the used reconstruction. By this approach, an approximation of the global discretization error up to an accuracy of the higher order reconstruction is available.

DRA2303 Transonic Profile

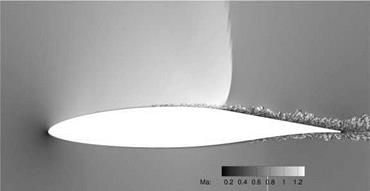
The DRA2303 transonic airfoil [10] was chosen as the aerodynamic reference case for the buffet phenomenon. Associated with buffet are self-sustained shock wave oscillations on airfoils at transonic flow. The flow configuration, which was to lie well within the buffet boundaries, was chosen with Ma = 0.72, Re = 2.6 • 106 and a = 3°. For this flow configuration, experimental data is not yet available.

In this work the buffet is computationally targeted with three different simu­lations: a full domain RANS-simulation based on the Baldwin-Lomax turbulence model [1], a full domain LES which constitutes the reference solution and a fully coupled zonal RANS-LES solution. First, the full LES solution of the DRA2303 is investigated. The RANS simulation, which was also a calibration case for the sensor in section 3.1, is compared with the reference LES solution. Finally, a fully coupled zonal RANS-LES solution yielding preliminary results is presented. The numerical details of the full LES solution and the zonal RANS-LES are given in Tab. 7 and Tab. 8, respectively. Similar to the SWBLI case the number of required grid points

streamwise x

wall normal y

spanwise z

Domain size in c

20

20

0.021

Grid points (30.4-106

2364

130

99

Resolution, wall units

Ax+ – 100

Ay+ 1.0

min

Az+ – 20

for the zonal RANS-LES simulation contains less than 50 % of the grid points used in the full domain LES simulation.

Подпись: c
DRA2303 Transonic Profile

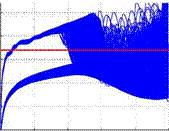
The focus of this numerical investigation using a full RANS simulation was on the evaluation of the reduced frequency a* = ac/U^ for the given flow configura­tion. In Fig. 13 the instantaneous pressure coefficients cp and the average pressure coefficient fluctuation at the upper side of the airfoil for the full RANS simulation are shown. At this flow configuration the extension of the horizontal shock move­ment is about 0.25 c. High level pressure fluctuations are found downstream of the shock, especially near the trailing edge where the strength of these fluctuations even exceeds the pressure amplitude of the shock.

DRA2303 Transonic Profile DRA2303 Transonic Profile

Fig. 13 Fluctuating wall pressure coefficient Cp (left) and corresponding rms-values at the upper side of the profile (right) for a RANS simulation

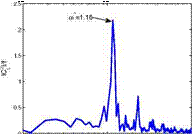
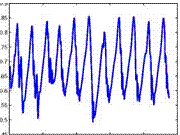
Fig. 14 Fourier transformed fluctuations of the lift coefficient Cl and corresponding fluctu­ations over time for a RANS simulation

In Fig. 14 the lift coefficient is investigated. The shock oscillation is highly peri­odic indicated by the pronounced peak in Fig. 14 (left). The reduced frequency shows a value of 1.16 which is about twice as high as it was expected from exper­iments at higher Reynolds numbers [28] and it is known that the influence of the Reynolds number on the reduced frequency is small [17]. The amplitude of the lift coefficient ACl is about 0.3 (see Fig. 14, right). It is known from previous numer­ical investigations [26] that for the DRA2303 case the reduced frequencies of the RANS simulations were far off the expected values. However, numerical investiga­tions with RANS on other airfoil types proved to be much more promising and more successful than for the DRA2303 case [22].

For this reason, a full LES simulation was set up to examine the physical aspects of buffet without using standard turbulence models. The simulation time for this configuration was about 40c/Ц» which can be considered as a long term simulation where effects of initial perturbations or flow developing effects possess no influence anymore on the solution and a periodic flow behavior determines the result.

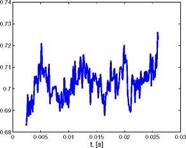
In Fig. 15 the instantaneous pressure coefficient cp and the average pressure coef­ficient fluctuations at the upper side of the profile are presented. Note that the ex­tension of the horizontal shock oscillation is about 0.07 c. That is much smaller compared to the outcome of the RANS simulation. The peak in the average pressure fluctuations is more pronounced (compare Fig. 13, right) and near the trailing edge the intensity of the fluctuations increases but they never exceed the strength of the shock. Upstream of the shock the pressure fluctuations are very small compared to the fluctuations at the shock position and downstream of the shock. The reduced frequency a* of the lift coefficient oscillation of the full LES solution presented in Fig. 16 is about 0.74 and thus much lower than the one obtained by the RANS simulation. Again, the oscillation is highly periodic which is indicated by the peak in the frequency spectrum. The amplitude of the lift coefficient ACl « 0.03 is small compared to that of the RANS simulation. This finding is due to the smaller ho­rizontal shock oscillation amplitude and the less pronounced pressure fluctuations downstream of the shock.

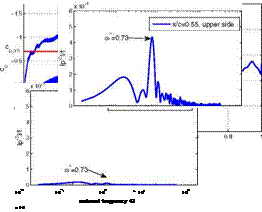
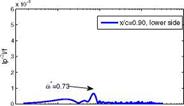
Figure 17 compares the fluctuating pressure intensity at different locations. At the upper side at 0.25 c the amplitude of the fluctuation is very low, however, a small distinctive bump is evident at a* « 0.7. Near the shock at 0.55 c a peak oc­curs at the reduced frequency a* = 0.74 and the distribution of the values is very similar to that in Fig. 16. Close to the trailing edge at 0.9 c the major peak is still at a* « 0.73 but the pressure fluctuations at higher reduced frequencies have grown stronger compared to the position near the shock. This is due to the turbulent shear layer which is at this flow configuration maximum in size at the trailing edge. Al­though the pressure fluctuations are averaged in the spanwise direction the pressure fluctuations at very high reduced frequencies can be related to the turbulent shear layer. At the lower side of the profile at 0.9 c the intensity level of the fluctuations is one order of magnitude smaller compared with the corresponding position at the upper side. However, a distinct peak at a* « 0.73 is visible which is caused by the direct influence of the oscillating shock at the upper side.

Fig. 15 Fluctuating wall pressure coefficient Cp (left) and corresponding rms-values at the upper side of the profile (right) for an LES simulation

DRA2303 Transonic Profile

DRA2303 Transonic Profile

X 10 [2]

DRA2303 Transonic Profile

Подпись:Подпись:DRA2303 Transonic Profile– x/c=0.90, upper side I
© =0.73

….

Подпись: 10-2 10-1 100 101 102 reduced frequency ©*

Fig. 17 Fourier transformed pressure fluctuations at different positions of the DRA2303 airfoil

DRA2303 Transonic Profile

Fig. 18 Reynolds shear stresses at two different positions at the DRA2303-profile: at x/c = 0.4 (left) and x/c = 0.6

The Reynolds shear stresses of the averaged full LES solution at two different locations is exhibited in Fig. 18. At 0.4 c the distribution resembles that of a flat plate boundary layer flow and its turbulent features. Behind the shock, however, the maxima of all components moves to the center of the boundary layer and the intensity level of (v’v’), (w’w’), and (u! v’) is much higher compared with the pos­ition ahead of the shock. Downstream of the shock the intensities of (u’u’), (v’v’), and (Ww’) are at the same level which indicates that the turbulent structures show an isotropic behavior compared with the high level of anisotropy of the near-wall turbulence upstream of the shock.

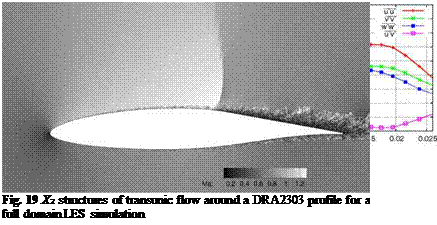
The A2-contours [13] are shown in Fig. 19. After the interaction with the shock, the turbulent boundary layer separates and a shear flow is formed that develops large coherent structures that convect near the trailing edge. These large structures are responsible for the high level pressure oscillations at high frequencies near the trailing edge.

Due to the very different transient behavior regarding buffet and the subsequent consequences for the boundary layer downstream of the shock location the rms

DRA2303 Transonic Profile

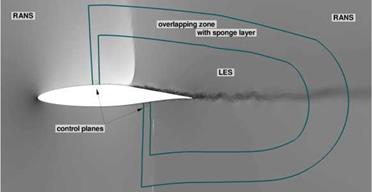
Fig. 20 Computational setup of a fully coupled zonal RANS-LES simulation

values of the pressure coefficient fluctuations diverge in the region between 0.4 c and the trailing edge at the upper side of the airfoil (figs. 13 and 15). Because of the known drawbacks of RANS simulations (see section 1) a zonal RANS-LES compu­tation was set up to overcome the turbulence modeling issue at the shock location and downstream of it. The extent of the LES domain was chosen like in the evalu­ation of the sensor results which have been discussed in section 3.1. The resulting computational set up is shown in Fig. 20. Due to the complexity of this particular case the results can be considered just preliminary.

At the inlet of the LES domain on the upper and lower side of the airfoil, the zonal SEM approach (see section 2.3) is used to generate synthetic turbulent structures. Downstream of the inlet four control planes are located between 0.37 c and 0.4 c at the upper side and between 0.7 c and 0.73 c.

Since pressure waves, caused by the transient shock behavior, travel from the LES domain to the RANS domain and vice versa the time window where the solutions are averaged has to be carefully defined. On the one hand, the turbulent flow properties of the LES solution have to be averaged properly over a sufficiently large time window before being transferred to the RANS domain. On the other hand, the amplitude and frequency of the traveling pressure waves caused by the shock must be captured in a time window which is as small as possible to prevent a signi­ficant alteration of the pressure wave signal. A time window of the size of 1 c/U^ was found to satisfy these requirements.

Table 8 Numerical details of the LES domain for the zonal RANS-LES simulation

streamwise x

wall normal y

spanwise г

Grid points (13.7-106) Resolution, wall units

1430

4x+ « 35

97

99

4z+ « 20

DRA2303 Transonic Profile

x/c

Fig. 21 Comparison of instantaneous wall pressure coefficient Cp between full domain LES and zonal RANS-LES computation

DRA2303 Transonic Profile

Fig. 22 Я2 structures of transonic flow around a DRA2303 airfoil for a fully coupled zonal RANS-LES solution

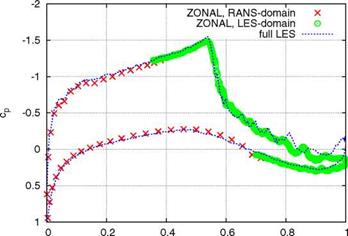
In Fig. 21 the instantaneous pressure coefficients cp are given. The zonal RANS – LES solution shows a good agreement with the full LES solution concerning shock position and strength. Downstream of the shock the cp evolution shows minor dis­crepancies near the trailing edge. However, upstream of the shock the zonal RANS – LES results agree pretty well with the findings of the full LES. Note the smooth transition from RANS to LES of the pressure coefficient near the overlapping zones at approximately 0.37 c (upper side) and 0.7 c (lower side).

The A2-contours of the instantaneous zonal RANS-LES solution are depicted in Fig. 22. They show the same features compared to the contours of the full LES simulation such as large coherent structures downstream of the shock interaction zone convecting towards the trailing edge.

4 Conclusion

In this article, a sensor was presented which is capable of detecting flow regions of RANS simulations, where the intricacy of the flow field requires a higher or­der turbulence model. This sensor was applied to several flow cases with complex flow phenomena such as transonic airfoil flow with buffet, or shock wave turbu­lent boundary-layer interaction. For these specific cases the flow regions, where the structure of the flow is highly complex, were replaced by LES domains. To couple the RANS with the LES domain synthetic turbulence generating approaches and control planes were used which transferred the turbulent intensities of the RANS solution to the LES domain. Two different STGM were tested and validated for a subsonic zero pressure gradient boundary layer flow (see section 3). The zonal SEM approach was found to be superior compared to the zonal Batten approach and therefore used in subsequent computations.

Different configurations of control planes were tested on a supersonic zero pres­sure gradient boundary layer flow to evaluate the quality of the transition from the introduced synthetic turbulent structures to fully turbulent flow.

The case where an oblique shock impinges on a compressible turbulent boundary layer was numerically investigated and discussed. First, the sensor detected the re­quired size of the required LES domain by evaluating the corresponding full domain RANS solution. Second, the RANS domain was coupled with the LES region by the zonal SEM approach and control planes downstream of the inlet. This constituted the transition from RANS to LES. The transition from the LES back to the RANS domain was done by applying the approach of Konig et al. [15]. The results have shown that the full domain LES and the zonal RANS-LES provided superior solu­tions compared to a full domain RANS simulation. The extension of the required LES domain in the zonal RANS-LES approach was well predicted by the sensor.

Finally, the computational results of the DRA2303 airfoil in a transonic flow con­figuration were thoroughly discussed. The results of a full domain RANS and full domain LES were compared and the sensor was applied to the RANS solution. The resulting LES domain extensions were implemented into a zonal grid. The coupled zonal RANS-LES approach provided preliminary results and indicates that the qual­ity of the solution is comparable to that of the full domain LES solution.

These two presented cases have shown that the solution computed by a zonal RANS-LES simulation agree well with the corresponding full domain LES solu­tions. However, the computational costs due to the considerable reduction of grid points were reduced by a factor of 2.

Oblique Shock on Flat Plate (SWBLI)

In section 3.1 the sensor was tested for an oblique shock impinging the turbulent boundary layer of a flat plate. This case was investigated experimentally by Dus – sauge etal. [6] [7] with the corresponding configuration ofRe$1 = 19300, Ma = 2.3, and an oblique shock angle a = 8°. In the following three simulations are analyzed: A full domain RANS simulation with Spalart-Allmaras turbulence modeling was computed for the sensor application to determine the size of the computational do­mains for the zonal RANS-LES simulation. For comparison purposes a full LES was simulated and finally, a fully coupled zonal RANS-LES approach to validate the zonal concept. The LES domain indicated by the sensor evidenced in Fig. 1 is slightly extended since the synthetic turbulence generation needs additional space in the streamwise direction to evolve properly. Figure 9 presents the computational setup of the fully coupled RANS-LES simulation emphasizing the computational domains of RANS and LES as well as four control planes downstream of the LES inlet. The computational set up of the full LES simulation and of the LES part of the zonal RANS-LES simulation are given in Tab. 5 and Tab. 6, respectively. The number of grid points for the zonal RANS-LES simulation is more than 50 % lower compared to the number of points of the full domain LES simulation.

Oblique Shock on Flat Plate (SWBLI)

Periodic boundary conditions are used in the spanwise direction and a no-slip, adiabatic condition is set at the wall. The top boundary uses characteristic boundary conditions to minimize spurious reflections from the other boundaries. The oblique shock is introduced at the inlet boundary applying the Rankine-Hugoniot conditions. The inflow condition of the RANS part uses the rescaling method of El-Askary et al. [8] while the inflow of the LES was set to the above described zonal SEM ap­proach. At the LES outflow the condition of Konig et al. [15] was applied to ensure a proper transition of the turbulent flow properties from the LES to the RANS domain.

Table 5 Numerical details for the full LES simulation for the SWBLI case

streamwise x

wall normal y

spanwise z

Domain size in So

20

6.3

0.6

Grid points (3.9 106)

512

153

50

Resolution, wall units

Ax+ – 35

Ay+ 1.1

min

Az+ – 18

Table 6 Numerical details for the LES domain of the zonal RANS-LES simulation of the SWBLI case

streamwise x

wall normal y

spanwise z

Domain size in S0

20

6.3

0.6

Grid points (1.9106)

256

153

50

Resolution, wall units

Ax+ – 35

Ay+ -1.1

min

Az+ – 18

A sponge zone at the LES outflow ensures the damping of turbulent fluctuations. The streamwise evolution of the skin friction coefficient Cf is displayed in Fig. 10 (left). First, it is noticeable that the RANS, i. e., full RANS and zonal RANS part, and the full LES solution differ for this zero-pressure gradient boundary layer. This difference is caused by different grid resolutions of the full LES and the RANS domain. For all cases the onset of flow separation is located at about x/S0 = 4.5. The experimental results of Dussauge et al. show an increased Cf level at the inlet compared to the full LES and predict the separation point slightly more upstream. The results of the full LES and the zonal RANS-LES regarding the length of the separation bubble are in good agreement with the LES results of Garnier et al. [11]. Downstream of the interaction zone the increase of Cf is very similar between ex­periments, full LES and especially the zonal RANS-LES solution where the LES to RANS transition method of Konig et al. [15] proved to provide good results. One can notice that the result quality of time averaged Cf of LES and zonal LES is clearly superior to that obtained by a RANS approach in the same configuration.

Figure 10 (right) compares the van Driest velocity profiles obtained at x/S = 3.3 which is located slightly upstream of the interaction zone. All computations show the expected asymptotic near wall behavior. However, the logarithmic region of the full LES computation lies somewhat above the analytic result because the streamwise grid resolution. The corresponding profile of the zonal RANS-LES solution is located in between that of the full RANS and that of the full LES as it just passes the control planes and hence, still contains the shear stress profile of the target RANS values.

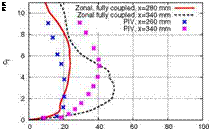
In Fig. 11 (left) the comparison of PIV results [6] with the zonal RANS-LES outcome of the wall-normal velocity fluctuations is given. At position x = 280mm (x/So = 3.2), which is about two boundary layer thicknesses downstream of the PIV measurement position, the fluctuations show a higher intensity at the middle of the boundary layer than the corresponding PIV measurements. This is due to the

Oblique Shock on Flat Plate (SWBLI)

Fig. 10 Longitudinal evolution of skin friction coefficient Cf (left) and van Driest velocity profile (right) for SWBLI flow case for different computational – and control plane configura­tions

Fig. 11 Comparison between PIV [6] and zonal RANS-LES of the rms-wall-normal velocity fluctuations (left) and of the Reynolds shear stress (right)

STGM at the inlet which assigns too much energy in the outer part of the boundary layer. At position x = 340mm (x/ 8 = 9)the high energy fluctuations which were introduced by the STGM at the inlet in the outer part of the boundary layer did not survive the interaction region and the fluctuation level decreases below that of the PIV measurements.

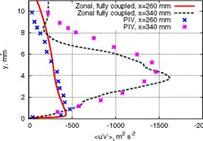
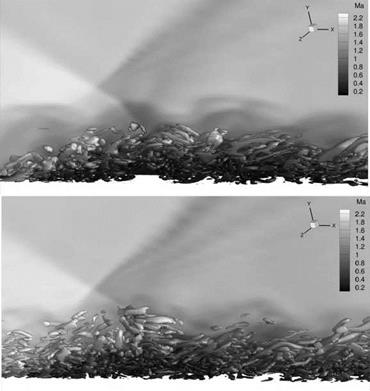
Figure 11 (right) represents a similar comparison for the Reynolds shear stress. The distribution at x = 260mm (x/8 = 1)) shows a good agreement between the zonal RANS-LES results and the PIV measurements. Downstream of the interac­tion zone, at x = 340mm (x/8 = 9), the results of the zonal RANS-LES agree again fairly well with the PIV measurements. The A2-structures at the interaction zone of the oblique shock and turbulent boundary layer for the full LES and the zonal RANS-LES simulation are depicted in Fig. 12. Large coherent structures are formed at the proximity of the impinging shock which transport the maximum of the turbulent kinetic energy towards the center of the boundary layer. Such turbulent features are evident in the full LES and the zonal RANS-LES solution.

Oblique Shock on Flat Plate (SWBLI)

Fig. 12 Я2 structures in the shock boundary-layer interaction zone computed by (top) a full LES and (bottom) a fully coupled zonal RANS-LES

Validation of STGM

A zero-pressure gradient boundary layer was investigated and compared to reference solutions using two synthetic turbulence methods, based on the controlled forcing approach downstream of the inlet. Four simulations were carried out: a full domain LES (referred to as ’full LES’), a full domain RANS, and two synthetic turbulence – LES simulations with controlled forcing. All four cases were computed with the same flow and numerical configuration, M„ = 0.4, Reg = 10000. The numerical details are given in Tab. 3.

The reference full LES was computed using the rescaling method according to El-Askary et al. [8]. The full domain RANS calculation based on the Spalart – Allmaras model (referred to as ’RANS S-A’) was performed for comparison

Validation of STGM

Validation of STGM

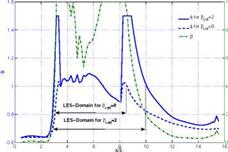
Fig. 1 Sensor value ф for two different critical Clauser parameters Pcrjt for the case of the oblique shock at flat a plate


Validation of STGM

Fig. 2 Sensor value ф for two time steps to and ti for transonic profile flow


Validation of STGM

Fig. 3 Sensor value ф for two different critical Cf, crjt for subsonic profile flow


Table 3 Numerical details for the simulation of turbulent boundary layer at Ma = 0.4 and Reg = 10000 for LES and RANS solutions

streamwise x

wall normal y

spanwise z

Domain size in Sq

15

5

0.7

Grid points

484

65

49

Resolution, wall units

Ax+ – 20

Ay+ ^ 0.8

min

Az+ – 12

purposes and to provide the target data for the synthetic turbulence inlet and for the control planes. In the zonal simulations the control planes are distributed over a length of one boundary layer thickness So.

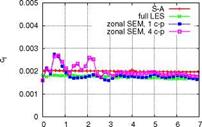
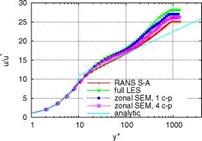
Figure 4 (left) compares the evolution of the wall friction coefficient Cf for all four flow cases. The solutions of full LES and full RANS do not differ much re­garding the wall shear stress for this simple zero-pressure gradient boundary layer. Thus, the applied rescaling method at this numerical configuration is valid for LES and RANS simulations and poses no difficulty to match them at the beginning of the computational domain. Both, the zonal SEM and the zonal Batten approach, show, despite their fundamental differences in their formulations, a comparable required length until they converge to the full LES solution. The van Driest velocity profiles obtained at x/So = 5 which are presented in Fig. 4 (right) show that both STGM pro­duce the expected asymptotic near-wall behavior of a turbulent flow, but the results differ somewhat at the edge of the boundary layer.

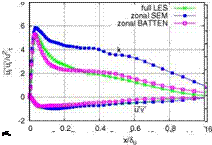
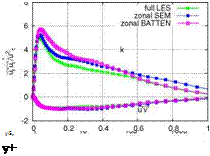
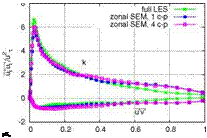
Figure 5 depicts the turbulent kinetic energy k and Reynolds shear stress com­ponent (u’v’) at two different locations downstream of the inlet. It is shown that the flow generated by the zonal Batten approach undergoes a slight laminarization process downstream of the interface but the control planes increase the turbulent shear stress budget to the full LES level. The turbulent structures generated by the zonal SEM approach do not dissipate downstream of the inlet but the control planes introduce a local overshoot of the turbulence level which decreases to the full LES turbulence level at around 5 x/SQ. By improving the response of the control planes to the local flow events, the turbulent shear stress level of the full LES could be reached within one boundary layer thickness Sq.

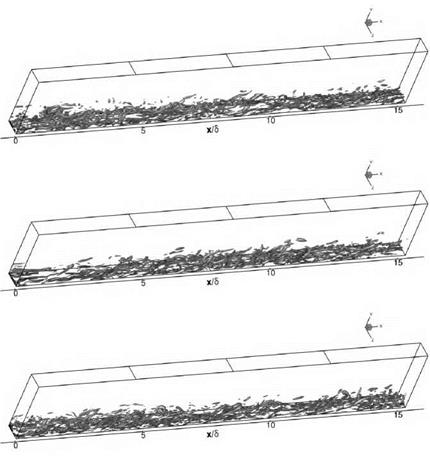
Яг-contours (Jeong et al. [13]) of both zonal cases and the full LES are visualized in Fig. 6. It is shown that the structures which are introduced into the domain by the zonal SEM approach are not dissipating. The structures at the inlet of the case com­puted with the zonal Batten approach fade away and the control planes downstream of the inlet have to enhance the locally rare events like turbulent bursts and sweeps to reach the turbulence level of the full LES computation.

Due to the low Reynolds number for this case it was expected that the ’artificial’ turbulence would dissipate at the beginning of the domain to develop ’physical’ turbulence further downstream after the transition process at about x/S0 — 10. How­ever, Figs. 4 (left) and 5 (left) show that when the zonal SEM approach is used the Reynolds shear stress (u’v1) does not decrease below the level of the full domain

Validation of STGM Validation of STGM

Fig. 4 Evolution of skin friction coefficient Cf (left) and van Driest velocity profile (right) for boundary layer flow at Ma = 0.4 and Reg0 = 10000 for different computational configurations

Fig. 5 Turbulent kinetic energy k and Reynolds shear stress {u’v’) at x/ S = 1 (left) and at x/So = 5 (right)

LES but generates an overshoot of turbulent kinetic energy. The zonal Batten ap­proach tends to provide a lower Reynolds shear stress level which is to be increased by the control planes which are located downstream of the inlet. For the follow­ing computations the zonal SEM approach is used since the quality of the results is acceptable and it is computationally less expensive than the zonal Batten approach.

A compressible zero-pressure gradient boundary layer (Ma = 2.4, Res„ = 52000) was also investigated to evaluate the efficiency of STGM in compressible flows. A full LES simulation was used as reference and a full RANS simulation provided targets for the zonal RANS-LES solution. In this case just the zonal SEM approach was used and evaluated concerning two different control plane configurations. The first configuration uses one single control plane (referred to as ’1 c-p’) which is located at x/So = 0.7. The second configuration applies four control planes (referred to as ’4 c-p’) which are located between x/S0 = 0.3 andx/S0 = 2. Numerical details are given in Tab. 4.

The downstream evolution of the skin friction coefficient Cf is shown in Fig. 7 (left). It seems that the zonal SEM solution with one control plane already con­verges at about x/So = 1.5 whereas the case with four control planes still regulates

Validation of STGM

Fig. 6 Я2 structures of a mildly compressible flat plate boundary layer flow computed by (top) a full LES, (middle) using zonal Batten approach and (bottom) applying the zonal SEM ansatz

Table 4 Numerical details for the computation of a turbulent boundary layer at Ma = 2.4 and Reg = 52000 for LES and RANS solutions

streamwise x

wall normal y

spanwise z

Domain size in g

10

3

0.7

Grid points

140

65

49

Resolution, wall units

Ax+ – 20

АУтіп ~ °-8

Az+ – 12

the shear stress budget. However, Fig. 8 compares the turbulent kinetic energy k and Reynolds shear stress (u’v1) at position x/g = 1. A second spurious peak is ex­hibited at y/g0 = 0.7 for the zonal SEM simulation with one control plane. This

Validation of STGM Validation of STGM

distribution of turbulence energy is due to the presence of a low frequency mode which is introduced at the inlet and may survive at least the first control plane. Touber et al. [25] observed the same phenomenon when applying synthetic turbulence tech­niques to compressible boundary layers. This might occur due to the high Reynolds and Mach numbers used here which stabilizes the outer mode. However, this mode was not found in subsonic boundary layers. When four control planes are used the flow already passes two control planes and the spurious peak in the wake region of the boundary layer at position x/S = 1 is somewhat more damped. At position x/S = 5 both control plane configurations show no trace of this second peak in the turbulent kinetic energy k. From these results it is suggested to apply more than one control plane in supersonic boundary layers at high Reynolds numbers to avoid the large wave length mode introduced by the STGM and thus to keep the transition region as small as possible. The van Driest velocity profiles obtained at x/S0 = 5 in Fig. 7 (right) show that both STGM produce the expected asymptotic near-wall behavior of a turbulent flow, but the results differ somewhat at the edge of the boundary layer.

Подпись: y/5„ Подпись: y/5„

Fig. 7 Evolution of skin friction coefficient Cf (left) and van Driest velocity profile (right) for boundary layer flow at Ma = 2.4 and Re^ = 52000 for different computational – and control plane configurations

Fig. 8 Turbulent kinetic energy k and Reynolds shear stress (u’V) at x/So = 1 (left) and at x/ Sq = 5 (right)

Sensor Validation

Three different test cases for sensor calibration are considered in detail in the follow­ing sections showing the influence of the user defined critical values on the sensor value ф. The configuration of these simulations is given in Tab. 2.

In Fig. 1 the application of the sensor on a flow case, where a shock wave im­pinges on a compressible turbulent boundary layer (SWBLI) causing a local flow separation, is presented. The Spalart-Allmaras turbulence model [23] (referred to as ’S-A’) was applied for this simulation. Regardless the computational configur­ation, the sensor value ф exceeds 1 where the flow is separated. Downstream of the separation the boundary layer returns to an equilibrium state. Depending on the user defined critical Clauser parameter the suggested corresponding LES domain is smaller (for ва-и=8) or larger (for ва-и = 2). In section 3, this particular case is regarded thoroughly using RANS, LES and zonal RANS-LES computations.

Fig. 2 presents the resulting sensor values ф for the upper side of the DRA23032- profile for two different time steps. The Baldwin-Lomax turbulence model [1] (re­ferred to as ’B-L’) was applied for this case. The sensor value at time step t0 exceeds the allowed limit of 1 at 0.55 c where the shock is located. However, the flow does not separate before passing 0.65 c (not shown here). The high pressure gradient

Table 2 Test cases for Sensor validation

Transonic airfoil flow

Oblique shock on flat plate Subsonic airfoil flow

Re

2.6106 (reference c)

19000 (reference 60)

2.1 106 (reference c)

Ma

1

1

1

a

13°

T-M

B-L

S-A

S-A

and the rapid decline of Cf lead to an increase of ф. Downstream of the shock posi­tion the sensor value ф does not fall below 1 for more than several percent chord due to the reason that the boundary layer is locally separated and/or in a non-equilibrium state. The skin friction coefficient and Clauser parameter are the major contributors to the sensor value ф. At t0 the shock position is located further upstream which is in fact the most upstream location of the shock. This shows that the size of the inten­ded LES domain should be evaluated over a time span of several shock oscillations. This case is also thoroughly investigated with in section 3.

Figure 3 shows the results of the sensor application on the case of a subsonic profile at high angles of attack [4] (see Tab. 2 for two different values of Cf, crit). The turbulence model of Spalart and Allmaras was used for this case. Due to a laminar separation bubble at about 0.12 c the sensor value ф is higher than 1 up to 0.20 c. For a user defined critical Cf, crit of 1-10~4 the sensor predicts the end of the confidence domain at about 0.75 c which is located upstream of the experimentally determined separation point of 0.85 c. For cf, crt = 5-10~4 the sensor value ф exceeds the value 1 at about 0.60 c, thus the proposed LES domain is larger compared to the case using the lower cf, crit value. This is due to the more or less equal contribution of cf, в and Reynolds shear stress gradient V(u’v’) to the sensor value ф (see Eq. 1). This case was also extensively investigated by Celic and Hirschel [4] where the results agree with the present RANS simulation. The presented RANS simulation indicates that all the investigated turbulence models (algebraic, one, two-equation models and RSM) show an unsatisfying behavior from 0.7 c to the trailing edge due to the steep decline of cf and the beginning increase of (u’v’).

These three examples demonstrate that the sensor provides a comprehensible interpretation about the confidence domain of RANS solutions for different aero­dynamic flow configurations, i. e., various free stream Mach numbers and Reynolds numbers. Most shock boundary-layer interaction problems are transient problems with a time dependent behavior of i. a. cf, в, and (u’v’). As shown in the transonic flow case, the extreme positions of the critical sensor values ф at the upper side of the airfoil are used to span the flow field where the confidence in the RANS solution is low.

Spille-Kaltenbach Control Planes

Synthetic turbulent methods provide a reasonable first estimate of the fluctuating turbulent velocity field at the LES inlet. Downstream of the inlet, however, many of the relevant turbulent scales may have been dissipated retarding the transition to fully turbulent flow. Local control planes which introduce a volumetric forcing term to the Navier-Stokes equations regulate the turbulent production in the shear stress budget [24]. As discussed, for example, in the work of Keating et al. [14] or Zhang et al. [29], local flow events such as bursts and sweeps are enhanced or damped by the local forcing thus contributing to the Reynolds shear stress (u’v’)

e (y, t) = (u’v’)*’ (x0,y) – (u’V)z, t (x0,y, t) (12)

where (u’v’)* is the target Reynolds shear stress at the control plane which is provided by the RANS solution and (u’v’)z, t is the current Reynolds shear stress in the LES domain which is averaged over the spanwise direction and time. For the time average a window function with a time constant equal to « 10050/u,5 is used. The force magnitude is given by

Подпись:f (xq, y, z, t) = r (y, t) [u (xq, y, z, t) – (u)z’‘]

with

r (y, t) = ae (y, t) + в e(y, t’) dt’ . (14)

The proportional part is the main contributor to the force when the error e in Eq. 12 is high at the beginning of the simulation. Proceeding in time, the integral part gives the force the necessary response to enhance or damp the local flow events. The constants a and в were set to 10 and 25 respectively, to ensure on the one hand, a rapidly decreasing error e and on the other hand, a stable simulation process. In subsequent sections the STGM of Jarrin et al. combined with the control plane approach is referred to as ’zonal SEM’ and the STGM of Batten et al. combined with the control plane approach is referred to as ’zonal Batten’.

2 Results

Synthetic Turbulence Generation Methods (STGM)

In this study, the identification of flow regions where RANS should be replaced by a higher order turbulence model represents the first step for the zonal approach. The second step is the proper coupling of RANS and LES flow domains. In order to keep overlapping regions of both computational domains as small as possible, effective mechanisms for turbulence generation have to be applied in LES inflow regions. The turbulent intensities coming from the RANS domain are introduced first at the LES inflow plane via synthetic turbulent eddies (Jarrin et al. [12], Batten et al. [2]) and controlled further downstream by employing control planes according to Spille and Kaltenbach [24]. The synthetic turbulence generation methods of Jarrin et al. and Batten et al. were implemented and tested for incompressible and compressible flows.

Method of Jarrin et al.

The method of Jarrin et al. [12], called synthetic eddy method (SEM), is based on the considering of turbulence as a superposition of coherent structures. These structures are generated over the LES inlet plane and are defined by a shape function which describes the spatial and temporal characteristics of the turbulent structure.

The shape function fa that has a compact support on [-a, a] where a is a length scale which satisfies the normalization condition

Table 1 Suggested critical and reference Values for three different flow types

Oblique shock at flat plate

Transonic profile flow

Subsonic profile flow

c f, re f

0.002

0.004

0.004

ftref

1

1

1

cf, crit

0.0001

0.0001

0.0001

Pcrit

4

4

4

where A defines the extent of the domain. A one component velocity signal can then be described by the sum of the contribution u(i)(x) of a turbulent spot i to the velocity field. Let N be the number of prescribed synthetic eddy cores at the inlet and ei is a random number within the interval from — 1 to +1 then the one-dimensional velocity fluctuation component reads

(4)

The generalization of the one-dimensional procedure to time dependent two-dim­ensional fluctuations is straight forward.

Turbulent length and time scales are determined by the Reynolds shear stress component (u’v’) and the turbulent viscosity vt; both are extracted from corres­ponding RANS simulations. In this work, the Spalart-Allmaras turbulence model [23] was used for the incoming RANS solution. The turbulent time scale can be written as t = к/є and the turbulent length scale as L = t Vb with Vb = Vk where к and є stand for the turbulent kinetic energy and turbulent dissipation, respectively. By applying the experimental correlation of Bradshaw et al. the turbulent kinetic energy is related to the Reynolds shear stress (u’v1) and the turbulent viscosity vt which is available from the RANS solution

Подпись: dll dy Подпись:Подпись: -a1 k

Synthetic Turbulence Generation Methods (STGM)
Подпись: 1 A
Подпись: ()

| — (u’v’)| = Vt

Подпись: є Synthetic Turbulence Generation Methods (STGM) Подпись: (6)

with fli = уґсЦ and = 0.09. The turbulent dissipation є is approximated by the definition of the eddy viscosity from the k — є turbulence model (Menter [20])

The final flow field at the inlet is constructed from the resulting vortex field of Eq. 4

ill — Hi I иijiij (7)

where aij is computed from the prescribed Reynolds stress tensor applying a Cholesky decomposition.

Method of Batten et al.

The second method was introduced by Batten et al. [2] based on the work of Smirnov [21] and initially developed by Kraichnan [16]. To create a three-dimen­sional, unsteady velocity field at the inflow plane of the LES region, velocity com­ponents are constructed using a sum of sines and cosines with random phases and amplitudes. The intermediate velocity, vi, reads

Vj(xj. t) = — jr [p" cosd’j fj + cont + q" sind’jfj + cont],

Подпись: (8)n=1

where X are spatial coordinates being normalized by turbulent length – and time scales. These scales are reconstructed from the incoming RANS solution via Eqs. 5 and 7. The amplitudes of the signal are calculated by

pn = EijkZjdl, qn = £l}k^jdkk (9)

Synthetic Turbulence Generation Methods (STGM) Synthetic Turbulence Generation Methods (STGM) Подпись: (10)

where | and Z are equal to N (0,1) and dn = dnV/cn. The wave number d, n = N (0,0.5) is elongated by the following relation according to Batten [2]:

In Eq. 8 the random frequencies con are taken from the normal distribution N (1,1). Like in the method of Jarrin et al. the synthetic turbulent fluctuation field is fi­nally reconstructed using the Cholesky decomposition. The methods are suitable in incompressible flows. In compressible flows, however, the velocity fluctuations are coupled with the density field. Thus, Morkovin’s hypothesis is applied to relate density and velocity fluctuations by assuming that the pressure fluctuations over the inflow plane are negligible

^ = (y-l)M2- . (11)

p u

Sensor Development

To identify adequate sensor parameters for aerodynamic problems, simple internal flows at variable pressure gradient were investigated. Especially the experimental data of Driver and Johnston [5] was used. In the experiment, an axial incompress­ible flow over a cylinder is subjected to a variable pressure gradient. It is known that there is a consistent correlation between pressure gradient and local maximum of main Reynolds stress tensor component. The quality of the prediction of the skin friction coefficient and (u’v’)max highly depends on the RANS-turbulence model that is used for that kind of flow. Upstream of the boundary layer separation point the local quantities Cf = Tw/ (0.5pu^) , cp = pw/ (0.5pu^) and (u’v’)max deviate from the experimental findings, because the wall bounded boundary layer is in a non-equilibrium state [5]. Turbulence models such as algebraic, one – and two equa­tion models do not account for such type of boundary layer flow since for instance turbulent production and dissipation are no longer in the same order of magnitude. The thorough investigation of the flow field yielded the main influence parameters of the sensor; the Clauser-parameter /3 = 5i/rw the wall shear stress coefficient Cf, and the local maximum of the main component of the Reynolds shear stress (u’v’)max. Other parameters such as turbulent production and dissipation could not be used separately because they were not applicable for all kinds of turbulence mod­els. The value ф of the sensor is computed by applying the following summation:

with


Sensor Development

{u’v’)


7і = Пд—J8, Pcrit


T3 — Y3V


(2)


u


where T1, T2 and T3 depend on Cf, в and (u’v1) and their user defined critical values (Cf, crit and ecrit). The values of the prefactor yi, that contains reference values being extracted at a zero pressure gradient location in the flow domain, determine the priority of each term in Eq. 1. The calibration of the sensor is done via critical values where the RANS solution is no longer expected to yield reliable solutions. The sensor in this form should not be applied to flows with highly three-dimensional boundary layers or strong vortex interactions. An example configuration for three different flow cases is given in Tab. 1.

Numerical Methods

1.1 Large-Eddy Simulation

The three-dimensional unsteady compressible Navier-Stokes equations are solved based on a large-eddy simulation (LES) using the MILES (monotone integrated LES) approach [3]. The vertex-centered finite-volume flow solver is block-structur­ed. A modified AUSM method is used for the Euler terms [18] which are discretized to second-order accuracy by an upwind-biased approximation. For the non-Euler terms a centered approximation of second-order is used. The temporal integration from time level n to n +1 is done by a second-order accurate explicit 5-stage Runge – Kutta method, the coefficients of which are optimized for maximum stability. For a detailed description of the flow solver the reader is referred to Meinke et al. [19].