Category Management and Minimisation of Uncertainties and Errors in Numerical Aerodynamics

Application of Hexfine and Results

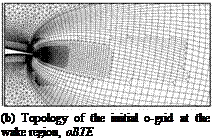
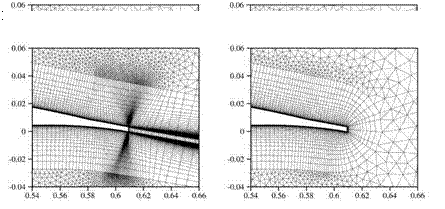
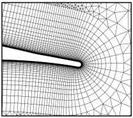
To test the method of local hexahedra refinement a set of two main grids were con­sidered. The first one is the grid cBTE-v2 (including its coarse and fine derivatives) shown in Figure 21(a) which is a c-type grid and has 37,871 grid points. The second grid oBTE shown in Figure 21(b) was derived from cBTE-v2 (including a finer de­rivative) by remeshing the region around the trailing edge and the wake in o-type. At the trailing edge a structured block was attached to obtain a structured domain reaching far into the wake. It has a total number of 30,127 grid points.
Application of Hexfine and Results Application of Hexfine and Results

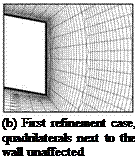
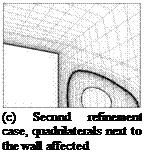
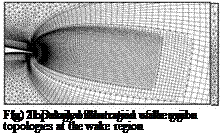
During the first run, the structured wake block of oBTE was refined twice. The result of the refinement is shown in Figure 21(c) in comparison to the initial grid in Figure 21(b). This local refinement had the aim to increase the number of grid points in the wake in order to better capture and preserve the flow field gradients. The quadrilaterals at the trailing-edge surface were not affected by the refinement (cf. Figure 22(a) and 22(b)). The number of grid points was raised by about 28% to 38,680 grid points. In a second run, oBTE was refined three times. This time, the

(c) Topology of the o-grid after refined (d) Topology of the o-grid after refined twice thrice
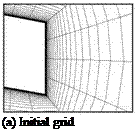
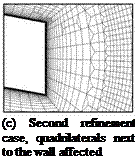
Подпись: (a) Initial grid Подпись: (b) First refinement case, quadrilaterals next to the wall unaffected Подпись: (c) Second refinement case, quadrilaterals next to the wall affected

Fig. 22 Comparison of the grid topology at the trailing edge

Application of Hexfine and Results

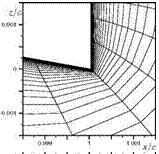
first refinement affected quadrilaterals up to the wall (cf. Figure 22(c)). The second and third refinement affected a portion of the grid downstream of the trailing edge. The resulting wake grid topology is shown in Figure 21(d). In addition, the grid was refined another three times around the upper corner of the trailing edge with the intention to better discretise the sharp corner. Flow solutions were obtained on
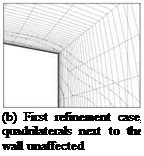
Подпись: (a) Reference c-grid Подпись: (b) First refinement case, quadrilaterals next to the wall unaffected Подпись: (c) Second refinement case, quadrilaterals next to the wall affected

Fig. 24 Grid topology and flow condition at the upper trailing edge corner

these grids. The resulting polar curves are shown in Figure 23. For a = 6°, the grid cBTE-v2, which is regarded as the reference grid, yields a grid converged solution since the differences in lift and drag to the finer grid are negligible. The coefficients of oBTE differ by 1.30 lift counts and 10.90 drag counts to the reference grid.

The o-grid with the refined wake reduces the differences to 0.60 lift counts and 2.80 drag counts. This is an improvement of cd by almost 75%. Analyses showed that refining the wake region a fourth or a fifth time does not yield any appreciable improvements. This reveals that the errors in the flow solution due to a o-topology cannot be attributed to a poor wake discretisation alone. In fact, the coarse discret­isation of sharp corners with o-grids constitutes a further source of error. Analysing the flow features very close to the trailing edge in Figure 24(a) and 24(b) edge re­veals, that the way the o-grid discretises the trailing edge is not sufficient to capture the sharp corner. This leads to very different flow features at the trailing edge. Figure 24(c) shows that the o-grid with refined wake and the additional corner refinement can capture the sharp corner much better, thus leading to less differences in the predicted flow features. As a result, the o-grid with the additionally refined upper corner has a difference of only 0.30 lift counts and 1.40 drag counts (cf. polar curve in Figure 23). To sum it up, by well-directed local refinement the error in c could be reduced from 1.30 to 0.3 lift counts whereas cd could be reduced from 10.90 drag counts to 1.40 drag counts. This is achived by increasing the number of grid points at about only 19%. In contrast, not even a unified grid refinement by doub­ling the number of grid points in both coordinate directions, which results in a large increase of the total number of grid points by 345.0%, does give a comparable improvement.

Local Refinement of Hexahedra to Improve the Wake Discretisation

3.2.1 Key Features of the Local Hexahedra Refinement Method

To locally refine a hexahedral layer, hanging nodes and faces have to be introduced into the grid. This means that the grid conformity has to be given up. If a solver does not handle hanging entities, the grid has to be made conform by decomposing the hanging relations. This is achieved by decomposing hexahedra facing a hanging entity into prisms or into pyramids and tetrahedra. For the TAU-Solver this task is done by the tool make_conform.

As a result, parent hexahedra have to be decomposed into child hexahedra in order to achieve a local refinement. A parent hexahedron can be decomposed in either two, four or eight child hexahedra. For a TAU-grid this means that the child hexahedra are introduced into the grid and the parents are deleted. Thereby, the hanging relations are introduced.

Due to limitations of make_conform a parent is allowed to faec on up to a maximum of four child hexahedra. Furthermore, the implementation of this TAU – tool is limited to 3D grids.

As a result of this, the following procedure was established for the present local hexahedra refinement tool, called hexfine. Hexahedra destined for refinement by user-input are marked. The child hexahedra of all marked hexahedra are generated. These child hexahedra are constituted by the corner points as well as the face and edge midpoints of the parents. To maintain the smoothness of the grid, the curvatures of the initial grid have to be reconstructed. For this purpose, the face, edge and volume midpoints are interpolated via a bicubic or a tricubic spline. The newly generated children are added to the coordinates and point lists of the grid. The par­ents are removed. So far the procedure yields a grid with hanging entities which is not TAU-conform. In case of 3D grids, no further steps are necessary and the

Fig. 20 Schematic illustration of the process to decomposing hanging nodes and faces
grid can be stored. Applying make_conform on the stored grid will give a TAU- conform grid.

In case of 2d grids, the hanging relations have to be decomposed by hexfine itself. This is done by decomposing hexahedra facing hanging entities into a prism and two hexahedra (cf. Figure 20). This type of decomposition yields a TAU-conform grid. Running make_conform is therefore not necessary for 2D grids.

Application and Results

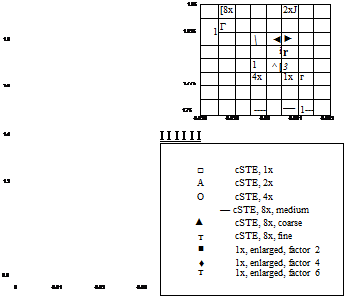
To improve the grid 1x the grid enlargement tool was applied to a portion of the structured layer surrounding the airfoil and the wake. The initial grid was enlarged by the factors two, four and six in each case yielding three additional grids. The resulting grid for an enlargement factor of six is shown in Figure 18(a) and compared to the initial grid in Figure 18(b). Flow solutions were obtained on these grids. The results are shown in the polar curves plot in Figure 19. The polar curve shows that an enlargement by factor two affects the prediction of lift coefficients by about 85% by reducing the difference to the reference grid 8x from 4.0 lift counts to 0.60 lift counts. The drag coefficient is affected by a change of about 44% by reducing the difference to 8x from 9.20 drag counts to 5.10 drag counts.

Further enlarging the structured layer by factor four and more reverses the im – provment as revealed by the polar curve plot. This has to be attributed to the fact that a stronger enlargement reduces the effective resolution in the structured layer,

Application and Results

(a) Grid derived from the initial grid after an enlargement by a factor of six


Application and Results

(b) Initial grid 1x

Fig. 18 Initial grid 1x compared to the grid with enlarged structured layer by a factor of six


2


Application and Results

c


Application and Results

since the enlargment does not introduce additional points but redistributes present points over a wider area.

Grid Improvement Strategies and Techniques

1.3 Enlargement of the Hexahedra Layer via Grid Manipulation

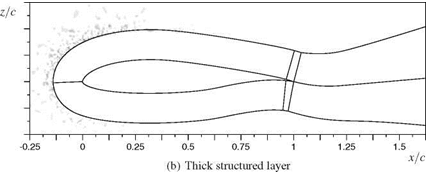
The task of the first grid manipulation tool is to enlarge the structured layer in or­der to move the hybrid border out of flow regions with gradients. This is achieved by moving the grid points that are located along the hybrid border. These points are moved along wall normal lines of the structured layer. These lines have to be extrapolated into the unstructured grid region in a way that prevents twisting and overlapping of these lines. To assure this, a line extrapolation method similar to those in structured grid generators is used.

Grid Improvement Strategies and Techniques Grid Improvement Strategies and Techniques

(c) Lower trailing edge corner of HK-EV (d) Lower trailing edge corner of HK-Fein

(f) Grid topology at the lower trailing edge corner of HK-Fein

In the following the proceedings of the tool are described in more detail. After loading the grid the tool determines the surface triangles and quadrilaterals as well as the grid points that shape the hybrid border. Thus a new surface geometry con­stituted by the surface triangles and quadrilaterals is obtained. Based on this surface a grid of user-defined thickness is generated via wall-normal extrusion. This extru­sion is performed according to the methods described in [11] and [12]. To ensure a consistent extrusion of the wall lines, the marching vectors of the extrusion are

Grid Improvement Strategies and Techniques

z/c

Grid Improvement Strategies and Techniques

1 і 1 і 1 і 1 і 1 і 1 і 1 і 1 і 1 і 1 і 1 і 1 і 1 і 1 г -0.25 0 0.25 0.5 0.75 1 1.25 1.5

smoothed [13] in a way that ensures that the visibility cone condition [12] is not violated.

The newly generated points form a new surface geometry on which the extrusion process is repeated. These steps are repeated until a certain number of extrusion lay­ers have been obtained. The resulting grid points are used to define the extrapolated wall lines. Along these wall lines, the new coordinates of the corresponding grid points which shape the hybrid border are moved. To avoid a steep transition from the undeformed to the deformed region, neighbouring points up to a certain degree are included in the movement. This transition is based upon a hyperbolic tangent. After the coordinates of each affected hybrid border grid point have been determ­ined, the points lying below are redistributed. Thereby, discontinuities in the grid point distribution along wall lines are prevented. This redistribution is performed via an area hyperbolic sinus function according to [14]. The coordinates of the affected grid points are stored in a binary file. The manipulation of the grid is performed by a modified version of the DLR-TAU-Code’s deformation tool [15] which uses this binary file.
Grid Improvement Strategies and Techniques

Grid Improvement Strategies and Techniques

Fig. 15 Illustration of the surface mesh as well as the box for selecting the deformation region


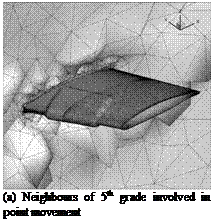
To demonstrate the method, the 3D-grid of the DLR-F6-wingtip with 1.2 million grid points, in Figure 15, is used. Grid lines on the geometry surface are shown by fading out portions of the volume grid. Furthermore, the box which marks the region to be deformed is plotted. This box is defined by the four coordinates P1 (x, y, z) to P4 (x, y, z). Multiple overlapping boxes can be defined.

Подпись: (a) Neighbours of 5th grade involved in point movement Подпись: (b) Neighbours of 15th grade involved in point movement

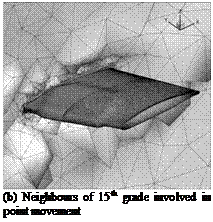
The result of the deformation is illustrated in Figure 16(a) by showing the prism and hexahedral layers. The enlarging effect can clearly be seen. In this case, neigh – bourings points of fifth grade have been involved to the deformation. This yields a steep and unsmooth transition from the undeformed to the deformed grid region. To get a smoother transition the whole manipulation process was rerun with neigh-

Grid Improvement Strategies and Techniques

(a) Slice through hexahedral layer

Fig. 17 Slice plane through the deformed grid


Grid Improvement Strategies and Techniques

(b) Slice through prismatic layer


bours of 15th being involved. As shown in Figure 16(b), this yields a much smoother transition.

For better illustration, the prismatic and hexahedral layers are shown at two slice planes through the volume grid in Figures 17(a) and 17(b). These Figures show that the transition from the undeformed region to the deformed region is smooth.

In summary, the tool is capable of enlarging the structured layer of a hybrid grid by moving grid points. The degree of enlargment is closely related to the quality of the surface elements forming the hybrid border. If a badly shaped surface element is present at the hybrid border i. e. an element with very high skewness, the ability of the tool to enlarge the structured layer at that location may be limited. However in regions with good element quality, very large deformations are possible.

Application of the Error Indicator

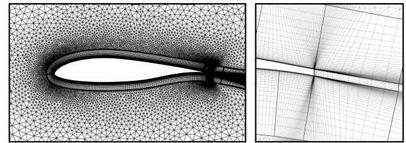
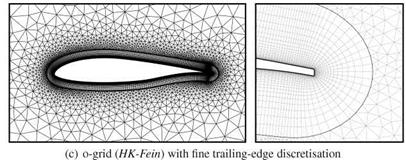
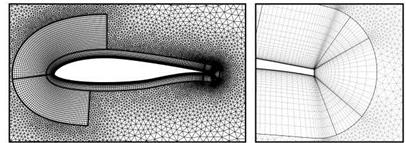
The verification of the error indicator was conducted on six grids. The first four of them are grids of the NLF(0)416 airfoil with a blunt trailing edge. The grid cBTE in Figure 10(a) is the reference grid which is of c-type. The grid HK-Grob in Fig­ure 10(b) is an o-grid with a coarse trailing-edge discretization. The grid HK-Fein shown in Figure 10(c) has a finer trailing-edge discretization. This was achieved by increasing the number of grid points along the trailing edge. The grid HK-EV in Figure 10(d) is a further improved version of the previous grid. The number of grid points on the trailing edge was further increased and the sharp trailing edge corners were rounded by the placement of radii. In addition, the structured layer around the first third of the airfoil was enlarged. The last two grids have sharp trailing edges and are of c-type. These are the grids 1x and 8x.

Application of the Error Indicator

(a) c-grid (cBTE)

Application of the Error Indicator

(b) o-grid (HK-Grob) with coarse trailing-edge discretisation

Application of the Error Indicator

Application of the Error Indicator

(d) o-grid (HK-EV) with rounded trailing-edge corners

Fig. 10 Grids for the error indicator tests

Application of the Error Indicator

Fig. 11 Flow condition at the vicinity of the trailing edge at two different levels of grid resolution

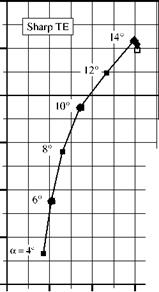
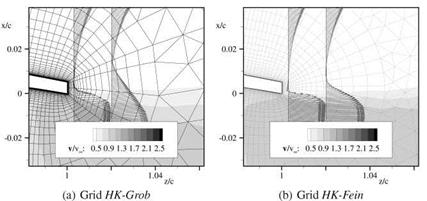
On these six grids, the solution was gained for Re = 4 • 106, Ma = 0.1 for a = 4° to 14°. For turbulence modelling the SST-model was used. For the grid HK-Grob the flow features at the trailing edge are of primary interest. Therefore the features of the flow field at a = 14° are shown in Figure 11(a). At this angle of attack a trailing edge separation is present. Velocity profiles downstream of the trailing edge are shown along two stations with x = const. Due to the o-type grid the resolution in the wake rapidly coarsens which explains why the velocity gradients vanish correspondingly. At a = 14°, HK-Grob deviates by 4.50 lift counts and 12.0 drag counts from the lift and drag coefficients obtained on cBTE.
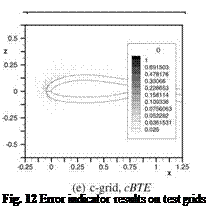
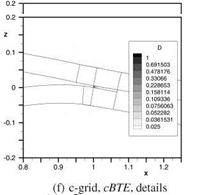
In case of HK-Fein, shown in Figure 11(b), the resolution at the trailing edge is finer which leads to a better resolution of the velocity profiles downstream. To test the applicability of the error indicator on poorly resolved trailing edges, it was ap­plied to HK-Grob and HK-Fein. The error indicator outputs are compared in Figures 12(a) to 12(d).

Areas that have a small contribution to the discretization error are of light colour whereas areas that have a high contribution are dark coloured. Compared to HK – Grob the grid cBTE has low error values across the whole wake region. The grid HK-Grob is showing a higher level of indicated error along the wake flow field, where the error magnitude increases close to the trailing edge. Due to the free shear layers high gradients at the vicinity of the trailing edge are present. These gradients are poorly resolved by the present coarse grid. Especially at the sharp trailing-edge corners the flow physics yield very high gradients which lead to high values of added artificial dissipation and thus to a high indicated discretization error. As one can see in Figure 12(c) and 12(d) a slight refinement of the wake region by increasing the number of grid points along the trailing edge leads to a significant decrease of the indicated discretization error. However, regions with high error values still persist especially at the lower sharp corner of the trailing edge. At this corner the slow trailing edge flow joins the much faster flow of the lower surface. As a consequence,

Application of the Error Indicator Application of the Error Indicator

high gradients occur which explain the high indicated error values. Furthermore, the plots reveal that on both HK-Grob and HK-Fein errors in the unstructured parts of the wake flow and near the leading edge are indicated. This is also attributed to the fact, that the unstructured grid can not sufficiently resolve flow gradients.

A close view of the grid at the trailing edge reveals that the corner cells are highly skewed. This skewness is a trade-off to the sharp trailing edge corners. In

order to improve the mesh around the corners, the grid HK-EV in Figure 10(d) was generated.

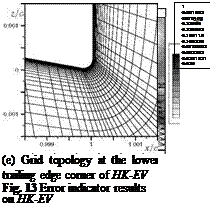
In Figure 13(a) the output of the error indicator is shown for this improved grid. Figure 13(b) gives a more detailed depiction of the trailing edge region. Compar­ing the results for HK-EV and HK-Grob reveals that a significant reduction of the indicated error could is achieved by this grid generation techniques. This is pointed out by the output of the error indicator at the corners in Figure 13(c) and 13(d). In particular the error contribution of the grid at the first third of the airfoil was reduced by enlarging the hexahedral part of the grid as well as through the improve­ments made near the trailing edge.

Optimizing the trailing edge discretization yields an improvement of 3.0 lift counts and 9.0 drag counts, thus reducing deviations in q and cd to 1.50 lift counts and 3.0 drag counts, respectively (deviations from HK-Fein to cBTE). Enlarging the structured layer at the first third of the airfoil yields a further reduction of 2.0 drag counts.

In Figure 14(a) and 14(b) the results of the error indicator on the grids 1x and 8x with sharp trailing edge are shown. Like in the previous cases, regions of increased indicated error are highlighted at the grid region covering the first third of the airfoil. However, the high indicated errors down – and upstream of the trailing edge are of particular interest for this case. These errors are mainly caused by the gradients of the boundary layer and the free shear layer, respectively. Compared to the reference grid 8x the grid 1x with the thin structured layer has an error of 4.0 lift counts and

8.0 drag counts.

The near-wall velocity profiles as well as the wake velocity profiles are depicted at seven stations along x. At the left-most station @ the boundary layer is still within the structured grid part. At the following slices (© to (A) the boundary layer is growing into the unstructured grid part, so the indicated error is growing as well. The indicated error value has a high magnitude at regions with high gradients (A to (A). In the wake the error values are fading out since the gradients disappear (cf. (A and AG). On the grid 8x in Figure 14(b), no errors can be observed.

. Methods for the Detection of Improperly Discretised Grid Regions

1.2 Error Indicator Based on the Artificial Dissipation of Central Convection Schemes

The concept of artificial dissipation was originally developed for Euler solvers used to compute inviscid flows. Since inviscid flows have no natural damping mechan­ism, dispersive error terms can cause oscillations in the solution. To damp those os­cillations and reduce the dispersive error an artificial dissipation is introduced. The first artificial dissipation model that incorporates a linear combination of second and fourth order difference dissipation terms was introduced in [9].

For viscous flows, the Navier-Stokes equations provide physical terms that con­tain natural dissipation effects. However, those dissipative terms are only significant in the viscous shear layer. They are insignificant in flow regions that show character­istics of inviscid flows. Thus, in practice, artificial dissipation terms still have to be introduced for Navier-Stokes computations in order to stabilize the flow in regions with inviscid behaviour.

The artificial dissipation is added to the internal fluxes across the cell faces by modifying the governing equations. Considering the flux QF’ across a finite volume face F be

1

Qf’C = 2 [Fr(t) +F/(0], (1)

the artificial dissipation is introduced by adding the term -^aD to the RHS of equation (1) which yields

1 I

QF/ = ^Wr(i)+F,(i)}–aD.

For Navier-Stokes solutions on highly stretched structured meshes, different scal­ings of the artificial dissipation term both in streamwise and normal direction within the region of viscous flow are needed. For unstructurd meshes, directional scaling is difficult to achieve since no mesh coordinate line exists. In order to obtain an ad­equate scaling of the dissipation for highly stretched portions of the grid, the strategy described in [10] is followed. The scaling factor a is given as

c 4Фрфг, j a = XF—— ,

Фг, ї + Фе, j

with

XCF = vF ■ F| + af ■ F

being the maximum eigenvalue of the flux jacobian for the face F. The terms

Фгу = л/грі and <PFj =

Подпись: rF,i Подпись: 1 -max 2 . Methods for the Detection of Improperly Discretised Grid Regions

are necessary to avoid excessive local numerical dissipation in cases of meshes with high-aspect-ratio cells. The term

relates the size of XF across the Face F to the total eigenvalue XC integrated over the entire control volume surrounding P where

Подпись: n

XC = X v ■ F + aF ■ F|,

k=2

and n is the number of surrounding faces. The corresponding terms Xc and rF, j can be defined analogously.

The artificial dissipative flux across the dual face F corresponding to the edge connecting Pi and Pj is given by

Di, j = eF(2) (Wi – Wj) – eF(4) (V2Wi – V2Wj), (2)

where W is the vector containing the conservative variables p, pv and pE. The amount of artificial dissipation added to the scheme is controlled by the coefficients

eF(2) = k(2) max(Vi, Vj) ■ Sc2 and

ekF(4) = k(2) max(0, k(4) – ej(2)) ■ Sc4,

where

I (Pj – Pi)

= j^N( 0________

I {Pj+Pi)

j£N({)

represents a shock switch, where sc2 and sc4 contain some anisotropy corrections and N(i) is the set of neighbours of i. The factors sc2 and sc4 are introduced in order to avoid a dependency of the dissipation on the number of neighbours. The constants ki1’1 and kare generally user defined parameters in the range of -j < № < ^ and p < k< p. Since the amount of added dissipation is scaled with a ~ Xf where for |F| ^ 0, Xp goes to zero, grid converged solution are independent of the dissipation.

In principle this added dissipation has no physical means and thus can be re­garded as an unphysical term that introduces an error to the solution. For this reason, the approach presented here regards the added artificial dissipation of central schemes as a measure for the discretization error. Out of the dissipative fluxes added to the scheme, the contribution dpE to the energy equation is used as a measure for the discretization error. This contribution has been chosen due to the fact that all key flow variables are represented by the energy equation. The amount of added specific artificial dissipation per cell volume that is being calculated during the evaluation of fluxes is stored and given out as a separate variable of the flow field solution and thus can be evaluated during the post processing. The amount of added artificial dissipation scales with the element face size and it is sensitive to the skewness and the gradients of the adjacent flow field. It is noted here that a skewed cell has high added artificial dissipation as this is based on the cell volume.

This error indication method does not give an absolute value for the discretisation error since the exact solution of the flow problem is unknown. In fact its intention is to guide the grid developer in deciding where to further improve the grid.

Effects of the Hybrid Border on the Flow Solution

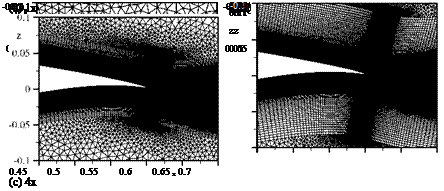
Hybrid grids are widely used in many scientific and industrial applications. Com­monly, these grids have very thin structured layers. But the effects of the size of the structured layer on the flow solution and especially on the aerodynamic coefficients are not well known. Thus, an analysis was conducted for the NLF(0)416 airfoil with sharp trailing edge and c-type mesh. Four grid variants were generated by vary­ing the thickness of the structured layer where the reference thickness was derived from the flat plate boundary layer at Re = 4 • 106, Ma = 0.1. The structured layers were sized with one, two, four and eight times the size of the reference thickness. These four grids, named 1x, 2x, 4x and 8x, are shown in Figure 6. To perform a grid

Effects of the Hybrid Border on the Flow Solution

0.45 0.5 0.55 0.6 0.65 x 0.7 0.45 0.5 0.55 0.6 0.65 x 0

Fig. 6 Variation of the structured layer dimension for the NLF(0)416 airfoil with sharp trail­ing edge, c-type grid. The dimension is given in multiple of the corresponding flat plate boundary layer thickness.

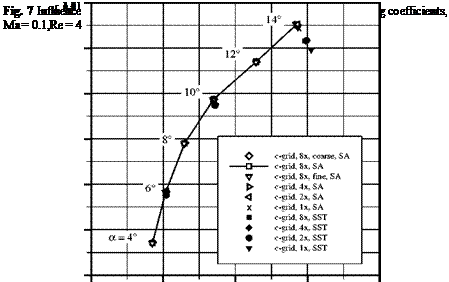
convergence study, two additional grids were generated by unified coarsening and refinement of the grid 8x. Solutions were obtained for a = 4° to 14° in steps of two degrees using the Spalart-Almaras turbulence model. In addition, solutions were obtained at a = 6°, 10° und 14° using the SST-Model [8]. The results are shown in Figure 7.

The polar curve shows that 8x yields a sufficiently grid converged solution across the whole range of a. The differences to the next finer grid "8x, fine" are negligible. The coarse grid "8x, coarse" gives slightly different results at a = 14°. The polar curves computed with the SA-turbulence-model show that the effect of the struc­tured layer thickness on the lift coefficient is small for attached flow (a = 4° to 12°). The difference in the lift coefficient varies from 1.50 to 3.70 lift counts, while it is increasing with the angle of attack. For a > 12°, trailing edge separation oc­curs, so at a = 14° the differences in the lift coefficients are not negligible anymore. As it will be shown later, this is attributed to the poor resolution of the trailing-edge separation. The differences in the drag coefficients are primarily caused by different

Effects of the Hybrid Border on the Flow Solution

0.04

levels of resolution of the region surrounding the stagnation point and the suction peak. The thicker the structured layer is, the better it can resolve the flow gradi­ents in that area. The same conclusions are true for the results obtained with the SST-model. For attached flow, differences ranging from 1.50 to 2.60 drag counts are observed. Though, with flow separation at the trailing edge, the SST-model shows a higher sensitivity to the thickness of the structured layer. Here, cl differs by 3.0 lift counts, whereas cd differs by 8.20 drag counts. For both turbulence models, the flow solution is moderately affected by the thickness of the structured layer for attached flow. In case of separated flow, a significant influence on both cl and cd is observed. These differences can be mainly ascribed to two effects.

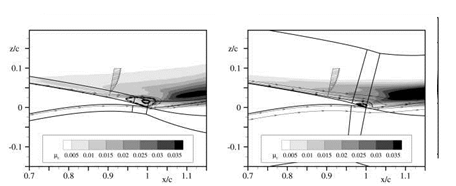
The first effect is the influence of the structured layer thickness on the size and shape of the trailing edge separation. Figures 8(a)-8(b) show the flow field solution at the vicinity of the trailing-edge gained with the SA-model. In Figures 8(c)-8(d) the flow field solution obtained with the SST-model are depicted. The eddy viscos­ity fat is shown via a contour plot. In addition, a velocity profile in the separation region is shown. On the grid 1x large parts of the boundary layer as well as parts of the free shear layer reach into the unstructured part of the grid. On 8x those parts are completely captured by the structure part. A comparison of the plots reveal that the production of fat is related to the thickness of the structured layer. Thus, the thickness of the structured layer has an influence on the size of the trailing edge separation. Regarding the case with the SST-model, the influence of the structured

Подпись: |6

Effects of the Hybrid Border on the Flow Solution

Re = 4-10′

layer thickness on дt is even greater and thus the size of the trailing edge separa­tion is bigger. To further analyse this, the velocity profiles and the rotation rot (v) at two slices x/c = 0.3 and x/c = 0.9 normal to the airfoil contour are plotted in Figure 9. At x/c = 0.3 the boundary layer is completely within the structured layer, on both grids. Velocities and gradients are continuous and show little difference. At x/c = 0.9, the structured part of grid 1x does not cover the boundary layer, the flow separation and the free shear layer completely. Here, the velocity profile has a discontinuity at the hybrid border whereas the velocity gradient shows a kink at z/c & 0.016. Taking into account that the turbulence equations are solved using the velocity gradients, the influence of the hybrid border becomes obvious.

The second effect is the difference in cd caused by the erroneous prediction of the trailing edge separation as well as the poor resolution of the flow gradients at the vicinity of the suction peak.

Uncertainties Induced by the Grid Topology

The intention of this study was to analyse the influence of the grid topology on the flow solution. For this purpose a set of four grids was generated. Both trailing- edge variants were discretized in c – and o-shape as shown in Figure 3. Numerical simulations were conducted at Re = 4 • 106, Ma = 0.1. The angle of attack was varied from a = 4° to 14° in steps of two degrees. As closure conditions for the RANS-equations the turbulence model according to Spalart-Almaras has been used. For the c-type grids a grid convergence study was conducted. For this purpose two additional grids were generated by unified coarsening and refinement of the initial grid. The polar curve in Figure 4 shows the result of this study. It compares the corresponding solutions on the c – and o-grids. The polar curves reveal that the grid topology has a significant influence on the aerodynamic coefficients. The variation of the grid topology for the blunt trailing edge yields a variation of about 4.0 to

7.0 drag counts. For the airfoil with the sharp trailing edge the differences vary from 2.50 to 5.50 drag counts. In addition, the differences in cl and cd decrease with growing angle of attack for the blunt trailing-edge case. For the airfoil with the sharp trailing-edge no such behaviour is visible.

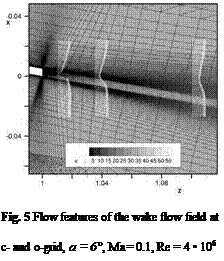
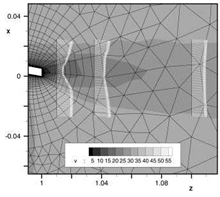
Analysing the flow solution around the trailing edge is advisable to understand this behaviour. For this purpose Figure 5 shows a detailed plot of the flow solu­tion around the trailing edge at a = 6°. Solutions obtained on c- and o – grids are compared. In addition, the wake velocity profile downstream of the trailing edge is shown at three slices. As one can see, there are significant differences between the two solutions. Unlike the o-grid, the c-grid can capture the wake velocity pro­file and the flow field gradients very well and can preserve them far downstream. The o-grid shows a strong dissipation of the flow features. This can be attributed to the coarse wake discretization on this o-grid. The same statements are valid on c – and o-grids with sharp trailing edges. The variation of topologies mainly shows an

Uncertainties Induced by the Grid Topology

effect on cd. The effect on c is negligible for attached flows and for flows with small trailing-edge separations.

These results show that meshing trailing edges in o-type topology can be prob­lematic. In general, o-type grids lead to a quick coarsening of the grid downstream of the trailing edge. Especially on airfoils with sharp trailing edges, this coarsen­ing effect is very strong. To reduce this coarsening for o-grids with blunt trailing edges, the number of grid points at the trailing edge has to be increased, whereas for sharp airfoils more grid points have to be shifted towards the trailing edge. However, compared to a c-grid this still does not yield a satisfying solution, since a reasonable resolution of the flow field downstream the trailing edge cannot be achieved even after excessively increasing the number of grid points. The finding, that changing the grid topology has a bigger impact on the flow solution than a change in the trailing-edge geometry is an important conclusion of this analysis.

Uncertainties Induced by the Grid Topology Uncertainties Induced by the Grid Topology

Fig. 4 Influence of different grid topologies and grid resolutions on c and q of the NLF(0)416 airfoil with different trailing edge geometries at Ma = 0.1, Re = 4 • 106

(a) c-grid, blunt trailing edge (b) o-grid, blunt trailing edge

Uncertainties Induced by Variation of the Trailing-Edge Geometry

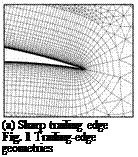
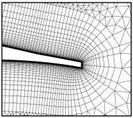
In addition to the original NLF(0)416 trailing-edge geometry, an airfoil with a blunt trailing edge was used. Following Somers [5], the blunt trailing edge was obtained by attaching a wedge on the last five percent of the airfoil. With this wedge the trail­ing edge gets a bluntness of 0.5% of chord length. As a further variant a NLF(0)416 airfoil with a rounded trailing edge was used. This airfoil was derived from the air­foil with the blunt trailing edge by replacing the corners with radii. The airfoils with sharp as well as blunt trailing edges were discretized using both c – and o-type topo­logy. The airfoil with round trailing-edge geometry was only meshed with an o-type grid since no reasonable c-type discretization was possible. In addition, the grid c – grid, 4x was derived from the initial c-grid by doubling the number of grid points in both coordinate directions. Figure 1 depicts the grid topologies for the respect­ive trailing edge variants. The numerical results obtained on these three grids are shown in Figure 2. Note that the experimental results on the blunt trailing edge are not depicted in this figure, since the experiments show no influence of the trailing edge geometry in this particular case. The blunt trailing edge leads to a higher drag coefficient in general. Due to the modification of the geometry one gets a difference of 2.0 drag counts in cd. In the experiments the initial airfoil has a trailing-edge sep­aration. Because of this a flow pattern similar to the flow around the blunt trailing edge appears. But in case of the numerical results only attached flow is present for a = 4° to 12°.

Подпись: (a) Sharp trailing edge Fig. 1 Trailing-edge geometries
Uncertainties Induced by Variation of the Trailing-Edge Geometry Uncertainties Induced by Variation of the Trailing-Edge Geometry

Furthermore, one can observe that the blunt trailing edge yields lower lift coeffi­cients across the whole a-range. This can be attributed to the decambering effect of the wedge attached on the airfoil.

(b) Blunt trailing edge (c) Rounded trailing edge

Uncertainties Induced by Variation of the Trailing-Edge Geometry

Fig. 2 Polar curves for different trailing edge geometries

Numerical Method

The 2D airfoil simulations are performed with the Navier-Stokes solver DLR-TAU [2, 3] using hybrid grids. This flow solver is a finite-volume solver for the Reynolds – averaged Navier-Stokes equations on hybrid grids. The convective fluxes can be dis­cretized either with upwind or central schemes, the latter being used in conjunction with scalar artificial dissipation for the present simulations. Time discretization is done implicitly using a backward Euler scheme [4] in connection with a LU-SGS linear solver.

1.1 Analysis in 2D

For the analysis of low speed cases, the airfoil NLF(0)416 by Somers [5] was chosen. This airfoil is a natural laminar flow airfoil with a very thin trailing edge. A wide base of experimental data at different flow conditions is available. These range from Re = 2 • 106, 4 • 106 and 6 • 106 for Ma = 0.1 as well as Ma = 0.2, 0.3 und 0.4 for Re = 6 • 106. This airfoil was chosen because in addition to the original airfoil with the very thin trailing edge, a version with a blunt trailing edge was also measured experimentally. The bluntness was generated by attaching a wedge on the original airfoil. Thus, numerical simulations with different trailing-edge geometries can be validated using the experimental values.

The subsequent flow solutions were obtained for Re = 4 • 106 at Ma = 0.1, using the Spalart-Almaras turbulence model [6]. The transition was fixed according to the locations given in [5]. All versions of the airfoil were discretized using 210 grid points on the upper surface and 150 grid points on the lower surface. Besides changing the topology of the grid at the wake, the number of grid points along the trailing edges was also varied. Parts of this study have been published in [7].