Interpolation Parameters of the MLS Method
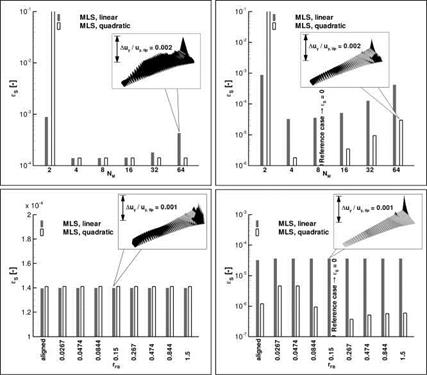
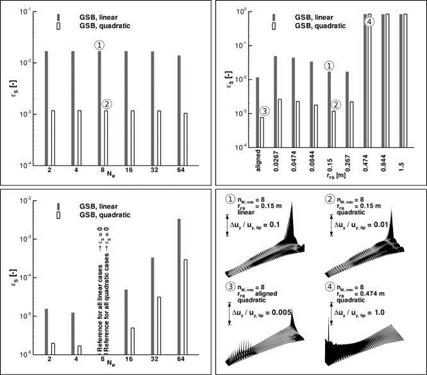
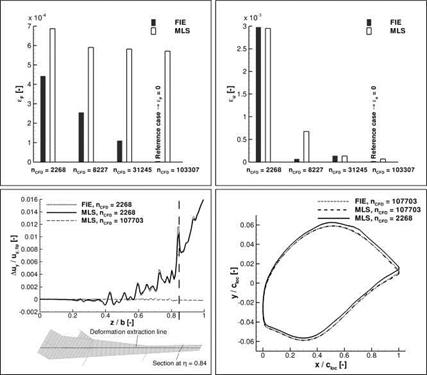
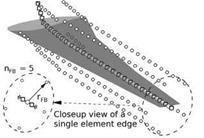
The parameter variations presented for the GSB method were repeated with the MLS method. In the top left image of Fig. 13 the RMS deviations are shown in dependence of the number of support midpoints NM. As before the reference deformed wetted surface is provided by the FIE method with default parameter settings. In the MLS method, during selection of support points an edge midpoint is always considered jointly with its surrounding additional support points. Hence the total number of support points of a given surface point is always a fixed multiple of the supporting edge midpoints Ng = (nFB + 1) x NM, at least outside of intersection regions. For two edge midpoints the MLS projection with quadratic interpolation functions fails; the resulting deformed wetted surface is completely distorted. Even with the numerically more robust formulation (15) the MLS method requires a minimum number of support points which should be at least twice the number of monomials Q. With four or more supporting edge midpoints the MLS method results in only small deviations relative to the FIE method. Neither with linear nor with quadratic interpolation functions does the deviation exceed 10~4. In the inset of the top left diagram, a typical distribution of the normalised deflection differences АиУ/иУгtip| is given. These are present all over the wing. The finite support radius of the MLS method slightly smears the deformation during projection as compared to the FIE method’s. This represents a systematic discrepancy largely independent of the choice of MLS parameters. There are minor differences between the resulting wetted surface, though, as can be seen from the top right diagram. Here, the deformed wetted surface obtained with MLS for NM = 8and rFB = 0.15 m is the reference. The different approximation orders of the interpolation functions are weakly reflected in the RMS values, as is the number of support points.
In the bottom images of Fig. 13 the influence of the radii of the additional support points is examined. The bottom left diagram underscores the systematic discrepancy between FIE and MLS which goes completely unaffected by the choice of rFB. Again the smeared projection of deformations with MLS is apparent in the inset. The largest deviations occur in the region of the beam kink, where the shape of the surface deformed with FIE also depends on the choice of projection parameters (see cases 0 to ® in Fig. 11). In the bottom right diagram of Fig. 13, the deformed wetted surface obtained with MLS and NM = 8 and rFB = 0.15 mis again the reference. For all contemplated parameter settings the deviations are very small. The systematic discrepancy between the results for linear and quadratic interpolation functions is due to the single peak at the leading edge wing root visible in the
|
Fig. 13 RMS deviations of the wetted surface deflections of the MLS method. top left: Variation of the minimum number of supporting edge midpoints between NM = 2 and NM = 64 with rFB = 0.15 m. The deflected surface obtained with FIE and default parameter settings is the reference for the deviations. top right: Variation of the minimum number of supporting edge midpoints between NM = 2 and NM = 64. The deflected surface obtained with MLS and NM = 8 and rFB = 0.15 m is the reference for the deviations. bottom left: Variation of the radius of the additional support points between rFB = 0.0267 m and rFB = 1.5 m with NM = 8. The deflected surface obtained with FIE and default parameter settings is the reference for the deviations. bottom right: Variation of the radius of the additional support points between rFB = 0.0267 m and rFB = 1.5 m with NM = 8. The deflected surface obtained with MLS and NM = 8 and rFB = 0.15 m is the reference for the deviations. |
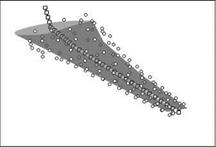
inset of the bottom right image. This peak can be traced to the lack of additional support points in its vicinity, as can be identified in Fig. 5.


