Category Noise Sources in Turbulent Shear Flows

Derivation of the structural response

In general, the transverse vibration of a flexible thin shell structure is governed by three inhomogeneous equations of motion, which can be written in the following form (Soedel 1993; Markus 1998):

L1(u, v,w, xs, t) – ms d2u(xs, t)/dt2 = – fz (xs, t)

L2(u, v, w, xs, t) – ms d 2v(xs, t)/5t2 =-fg (xs, t) (23a-c)

L3(u, v, w, xs, t) – ms d2 w(xs, t)/5t2 =-fr (xs, t) .

Here Lt(u, v, w, xs, t) are differential operators for the theory used to describe the equations of motion of the shell structure. Also u, v, w and fz, fe, fr are the displacements and forces per unit surface along the three axis used to describe the geometry of the shell (in this section, the notation for cylindrical coordinates is used). Finally ms is the mass per unit surface of the shell structure and the vector xs defines a generic point on the shell structure. Normally, for thin shell structures, the response is derived from the so-called classical theory of thin shells established by Love. This theory assumes the shell is thin compared to the radii of curvature and the deflections are reasonably small. Also it neglects the effects produced by shear deflections and rotary inertia. After Love’s work, several refinement theories have been proposed for specific classes of shells, which are discussed in specialised texts such as, for example, those in references
(Graff 1975; Cremer et al. 1988; Leissa 1993; Soedel 1993; Markus 1998; Reddy 2006). Assuming time-harmonic motion, Eqs. (23a-c) become

L1(u, v, w, xs,®) + ®2msu(xs,®) = – fz(xs,®)

L2(u, v, w, xs,®) + ®2msv(xs,®) = – fe(xs,®) (24a-c)

L3(u, v, w, xs,®) + a1 msw(xs, m) = – fr (xs,®) ,

where, in this case, u, v,w and fz, fg, fr are the frequency dependent complex

amplitudes of the co-respective time-domain functions assuming the time – harmonic dependence is expressed in the complex exponential form exp( jat). Also in this case, for brevity, the frequency dependence of the complex amplitudes will not be displayed in the remaining part of the formulation. In general, for curved shell structures, the three equations of motion are coupled (Soedel 1993; Markus 1998).

The solution of Eqs. (24a-c) can be expressed with the following set of three series expansions in the m = 1, 2, … structural natural modes of the shell, (Morse and Ingard 1968):

u(xs) = Z^,rn (xs)bz, m

v(xs) = Z^,m (xs)bVm (25a-c)

m=1

w(xs) = Z^,m (xs)br, m ■ m=1

Here Ф^Фе^Фг,*, and bzm, bSm, brm are the components of the m-th natural mode

and the co-respective complex modal responses along the axis used to describe the geometry of the shell (the combination of the three functions ^zm,^,m,^.m

constitute a natural mode).

Considering the model problem studied in this chapter, the free vibration of in vacuo cylindrical structures is characterised by three families of natural modes: the axial modes that are dominated by longitudinal vibrations, the torsional modes that are controlled by circumferential vibrations and the flexural modes that are governed by radial vibrations (Junger and Feit 1986). Thus for each mode number there are three natural frequencies relative to the axial, circumferential and radial natural modes. Usually the lowest one corresponds to the predominantly radial (i. e. flexural) natural mode (Markus 1998). Moreover, for circular cylinders, these mode shapes show a periodicity in circumferential direction. Thus, in order to represent a generic vibration field, two mode components oriented orthogonally in circumferential direction must be used in

Eqs. (25a-c). Normally a symmetric cosine and an anti-symmetric sine function are employed. A comprehensive account on the derivation of natural frequencies and natural modes of thin cylinders can be found in (Junger and Feit 1986; Soedel 1993; Markus 1998). For the specific structural-acoustic problem considered in this section, the coupling of the interior/exterior sound and TBL pressure fields with the structure occurs predominantly via radial, i. e. flexural, response of the structure. Thus, the formulation for the structural vibration can be simplified by neglecting the axial and torsional natural modes and using simplified expressions for the flexural natural frequencies as described by (Junger and Feit 1986; Soedel 1993). For instance, for the simply supported circular cylindrical shell model problem of Figure 1, the derivation of the response in radial direction can be expressed with the following series expansion (Soedel 1993):

Подпись: (26)w(xs) = ZCrn Os)b“

where, for each mode index m, the summation is carried out considering symmetric (a = s) and antisymmetric (a = a) radial mode shapes. Also the natural frequencies and co-respective symmetric and anti-symmetric radial mode shapes are given by (Soedel 1993):

Подпись:Подпись: Cm (X ) = sin(ffL) sin(m2^>(27)

(28a, b)

where ps, Es, vs are respectively the mass density, Young’s modulus of elasticity and Poisson ratio of the material and R, L, h are respectively the radius, length and thickness of the cylinder. These equations are given in cylindrical coordinates z,0,r so that m1 = 1, 2, 3, … and m2 = 0, 1, 2, … are the

modal indices in axial and circumferential directions for the m-th structural natural mode. The first term under the square root of Eq. (27) is controlled by the membrane stiffness of the cylinder and tends to reduce to zero for increasing circumferential mode orders m,. Alternatively, the second term under the square

root of Eq. (27) is controlled by the bending stiffness of the cylinder and becomes progressively important for increasing circumferential mode orders m2.

The unknown complex modal amplitudes brs, m and bra, m can be derived by substituting Eq. (26) into Eq. (24c). The resulting equation is then multiplied by

a m – th mode and integrated over the surface of the cylinder so that, using the orthormality property of the natural modes and assuming the natural modes are mass normalised, the following set of uncoupled ordinary equations is obtained:

M(<m -®2 K“m = f“m m = 1, 2 -, ® « = S a, (29)

where M is the mass of the shell. Thus for each mode order m, two equations are defined with respect to the symmetric and anti-symmetric complex modal amplitudes bsrm and barm. Also, f “m is the m-th modal excitation term for either

the symmetric or anti-symmetric mode shape, which, for the specific case of radial excitation only, is given by (Soedel 1993):

f :m Cm(Ofr(K)dSb. (30)

Derivation of the structural response Подпись: (31)

Thus, according to Eqs. (26) and (29), the velocity response in radial direction of the cylinder can be expressed with the following modal summation

In general, analytical expressions for the natural frequencies and natural modes can be derived only for regular shapes such as, for example, circular cylinder closed shells or flat and curved shells panels. When the problem at hand involves complex wall structures, the Finite Element Method (FEM) numerical technique is normally employed (Fahy and Gardonio 2007).

Derivation of the structural response Подпись: (32)

The energy dissipation in the structure is normally modelled with a hysteretic damping model (Cremer et al. 1988), which, leads to a complex stiffness in modal coordinates so that the Eq. (31) becomes

where r/ is the loss factor. The interaction between a structure and the surrounding fluid also produce energy dissipation. For slender structures this effect is normally modelled in terms of viscous damping without carrying out a coupled structural-acoustic analysis. In particular, the so called Rayleigh damping model is used, so that the damping can be modelled in terms of viscous damping coefficients in modal coordinates. Alternatively, for structures with extended surfaces such as the cylinder problem considered in this section, the true dissipation effects are modelled with a coupled structural-acoustic analysis, which is presented in the forthcoming section.

Green function for the interior sound field

In general, the Green function for enclosed sound fields can be expressed with a series expansion in terms of n = 1, 2, … acoustic natural modes of the cavity y/n(xc) and complex modal amplitudes an (x’) due to a point monopole source of unit amplitude (Morse and Ingard 1968; Pierce 1989; Nelson and Elliott 1992; Koopmann 1997), that is:

Gc (xc |x C ) = !>n (x c ) an (xC )

n=1

Here the vectors xc and x’c identify the positions of the sound pressure and point monopole source in the enclosure. The natural modes are chosen to form a complete set of functions so that any pressure field in the cavity can be derived from their linear combination. As seen for the exterior sound field, in order to avoid the two steps numerical solution of the boundary integral Eq. (5), the series expansion for the Green function in Eq. (14) is chosen to satisfy Neumann’s boundary condition such that – nGc (xc | xJ )| = 0 over the boundary surface of

П lxc=xs

the enclosure (Morse and Ingard 1968; Pierce 1989; Nelson and Elliott 1992; Koopmann 1997). From the physical point of view, this condition corresponds to rigidly walled boundary conditions. Thus the natural mode shapes used in Eq. (14) are chosen assuming the cavity is rigidly walled. The complex modal amplitudes an are derived by substituting Eq. (14) into Eq. (3), which is then

multiplied by the n – th mode and integrated over the volume of the cylindrical cavity. As a result, considering the orthonormality property of the natural modes, the following set of uncoupled ordinary equations in the unknown modal amplitudes an (x’c) are derived

V(®a2,„ -®2К = Chn П = 1 2 •••, ® ■ (15)

These equations are derived assuming the natural modes of the cavity yn (x c) are normalised in such a way as _[,^„2(xc) = V, where V is the volume of the cavity. Also <яал is the n-th natural frequency for the rigidly walled cavity and qn are

the modal excitation terms, which, using the “sifting” property of the three­dimensional Dirac delta function, are derived as follows

qn =v¥n(xcЖ^-xC)dv = ¥n(xC) . (16)

Green function for the interior sound field Подпись: (17)

Thus, the Neumann Green function for the interior sound field is given by:

The sound absorption effects produced by internal fittings in transportation vehicles (floor, seats, wall finishing/trim layers, etc.) generate a damping action, which, for light damping, is normally taken into account in terms of modal damping so that Eq. (17) becomes (Morse and Ingard 1968; Nelson and Elliott 1992):

Green function for the interior sound field

(18)

Подпись: Gc (xc К )Подпись:Green function for the interior sound fieldwhere ^a, n is the acoustic modal damping. The details for the derivation of this

expression can be found in Morse and Ingard (1968) and Nelson and Elliott (1992). In conclusion, assuming there are no interior acoustic sources Q (x c) and

assuming the Neumann Green function (18) is employed, also for the interior sound field the boundary integral equation (5) reduces to:

c (x c ) p(x c) = jPa>Sb(G c(x c 1 xs) vn(xs) dSb, (19)

where vn (xs) is the sound particle velocity in direction normal to the boundary surface.

When the enclosing wall has regular geometry it is possible to derive the natural frequencies ma, n and natural modes y/n (xc) in terms of simple analytic

Подпись: a,n Подпись: c Подпись: L Green function for the interior sound field Подпись: (20)

expressions. For instance, for the cylindrical enclosure shown in Figure 1, the natural frequencies and natural modes, assuming rigid wall boundary conditions, are given by (Blevins 2001):

and

¥Sn (2Ж Г) = cos(i¥L)cos(n2^)Jn2 (Лп2Л R)

Подпись:¥a„ (z,^, r) = cosinr )sinMK2 (^n2.n3 :r)

These equations are given in cylindrical coordinates z, 9 , r so that щ – 0, 1, 2,… n2 = 0, 1, 2, _ n3 = 0, 1, 2, … are the modal indices in axial, circumferential and radial directions for the n-th acoustic natural frequency and mode. Also, Jni (•••)

is the first kind Bessel function of order n2 and the term ЛП1^І is derived from the equation J’n1(K1,n3) = 0 . Finally R and L are the radius and the length of the

cylindrical cavity respectively. Since the mode shapes show a periodicity in circumferential direction, in order to represent a generic sound pressure distribution, two mode components oriented orthogonally in circumferential direction must be employed in Eqs. (17) and (18). For instance, in this formulation the symmetric cosine and anti-symmetric sine functions given in

Green function for the interior sound field Подпись: (22)

Eqs. (21a, b) are used, which are denoted by the superscripts 5 and a respectively. Thus, to take into account the contributions of both symmetric and anti­symmetric mode shapes, the Green function of Eq. (18) must be modified as follows:

where for each mode index n, the summation is carried out considering symmetric (a = s) and antisymmetric (a = a) mode shapes. In this case, since the natural modes given by Eqs. (21a) and (21b) are not volume-normalised, the denominator includes the term V = VSnlJl1-l(^n1,ni), where £щ = 12 when n1 = 0 and є =14 when n1 > 0 . As discussed for the exterior sound problem, for

cavities with complex geometries, either FEM or BEM numerical methods can be used to formulate an eigenvalue-eigenvector problem from which the approximate natural frequencies and natural modes are derived (Wu 2000; Fahy and Gardonio 2007).

Green function for the exterior sound field

As shown in Figure 1, a particular boundary surface is chosen for the exterior sound field, which is composed by the external surface Sb of the flexible wall and by the surface S„ of an imaginary sphere centred in the radiating object and with radius that tends to infinity. In this way the Sommerfeld radiation condition at infinity (Sommerfeld 1949) can be assumed, which imposes that only waves travelling outwards from a source are allowed and that the pressure tends to zero at infinite distance from the source. Assuming the system of reference is located

Подпись: lim x |Xe * Green function for the exterior sound field Подпись: 0 Подпись: (7)

at the centre of the radiating object, this physical condition can be expressed mathematically with the following equation:

Подпись: g(XeX'e ) Подпись: g-M Xe ~x’e HXe - X'e Подпись: (8)

where the vector xe identifies a point in the exterior sound field. In this case, it can be shown that the surface integral over S in Eq. (5) goes to zero. Also, for free-field sound radiation, the Green function takes the simple form

Подпись: c(Xe )P(Xe ) Green function for the exterior sound field Подпись: (9)

which is known as the free space Green function (Morse and Ingard 1968; Nelson and Elliott 1992). For the specific problem considered in this chapter where there is no external acoustic source distribution, i. e. Q(Xe), and the velocity distribution normal to the boundary surface is prescribed as compatible with the transverse vibration velocity of the flexible wall, the direct boundary integral equation derived above can be re-formulated as follows

Подпись: c(xe )p(xe) Green function for the exterior sound field Подпись: (10)

where the vector Xs identifies a point on the surface of the enclosure wall and dg(Xe | xs)/dn and dp(Xe)/dn are the directional derivatives[26] of g(Xe | xs) and p(Xe) along the normal n to the boundary surface Sb (Junger and Feit 1986). Equation (9) gives the sound pressure radiated by a vibrating body, provided the sound pressure in Sb and its derivative along the normal to the surface Sb are known. According to the fluid momentum equation, the sound pressure derivative dp(xs )/dn and the sound particle velocity vn (xs) along the normal to the boundary surface are related by the momentum equation cp(xs)/dn + japvn(xs) = 0 (Morse and Ingard 1968; Pierce 1989; Fahy and Gardonio 2007). Thus Eq. (9) can be rewritten in the following form

which, in literature, is known as the Helmholtz integral equation (Junger and Feit 1986; Wu 2000). Since the sound particle velocity vn (xs) is compatible with the transverse velocity of the structure w(xs), the sound pressure over the boundary surface p(xs) can be readily derived by coupling the structural wave equation with the Helmholtz integral Eq. (10) calculated in xe = xs assuming c(xs) = -1/2 and setting2 vn (xs)= —w(xs). The radiated sound field can then be derived yet again from the Helmholtz integral equation setting c(xe) = -1. Nevertheless, for

the noise problem considered in this section, this first step is sufficient to provide the external sound pressure fluid loading effect on the flexible wall. A phenomenological analysis of Eq. (10) indicates that the sound pressure p(x’s) at a given point x’s of the boundary surface of a flexible body is given by the surface integral of the superposition of the sound pressure generated by the vibration of the body, via the term ja>pg(x’s | xs) w(xs), and the sound pressure

generated by the scattering effect of the body, via the term Sg(x*’’) p(xs).

In general, for arbitrary geometries of the flexible body, the surface pressure distribution necessary to solve the Helmholtz integral equation must be derived by solving Eq. (10) numerically (Wu 2000). Analytical approximate solutions can be derived in the short – and long-wavelength limits (Junger and Feit 1986; Koopmann 1997). For instance, analytical solutions can be derived either for very small sound radiating objects compared to the acoustic wavelength or when the acoustic wavelength is smaller than both the radius of curvature of the sound radiating object and the portions of the sound radiating object that vibrate in phase. Also, analytical exact solution can be derived for specific geometries of the sound radiating object so that a special class of acoustic Green functions,

Ge (xe | xs), can be defined. These functions satisfy the Neumann boundary condition on the surface of the sound radiating object, i. e. jfGe (xe | xs )| = 0

n lxe=xs

(Junger and Feit 1986; Koopmann 1997). As a result, only the velocity normal to the boundary surface is required to derive Eq. (10). According to the nomenclature in (Kellogg 1953), these functions are referred to as the Green functions of the second kind. Alternatively other authors identify them as Neumann functions (Garabedian 1964). The – jf Ge (xe | xs )| = 0 condition can

n lxe=Xs

be straightforwardly imposed when the shape of the radiating body is such that it

2 Note that, as shown in shown in Figure 1b, the standard notation used for the Helmholtz integral equation is used where the vector n points away from the acoustic domain, thus vn (x s) = – w (x s) .

can be defined in terms of a single coordinate with reference to systems of orthogonal coordinates in which the acoustic wave equation is separable (e. g. rectangular, cylindrical and spherical coordinates) (Junger and Feit 1986). In this case the second kind Green function can be formulated analytically and the simplified form of the Helmholtz integral equation

c(x e ) p(x e ) = jWPsbGe (x e Iх – )vn (x – )dSb (11)

can be used to derive the radiated sound field directly from the boundary particle velocity vn (xs), that is the transverse velocity of the structure ii(xJ). From a physical point of view, in contrast to the free space Green function, this function includes the scattering effect that would have the wall if assumed to be rigid (Junger and Feit 1986; Koopmann 1997).

It is interesting to note that in the special case where the flexible body is an infinitely extended flat plate, the scattering of sound is such that the first term equals the second term in Eq. (10). Thus, using the expression for the free space Green function given in Eq. (8) and recalling that vn (x,) = – it (x,), the radiated

Подпись: p(xe ) Green function for the exterior sound field Подпись: (12)

sound pressure can be readily derived with the following integral

This integral expression in known as the Rayleigh integral for the radiated sound pressure by an infinitely extended flat surface with transverse velocity it (x,) (Fahy and Gardonio 2007). Thus the free space Green function can be considered as a second kind Green function for the sound radiation problem of an infinitely extended flat surface.

Since this section is focused on the coupled structural-acoustic response of a cylindrical enclosure, the second kind Green function for the baffled cylinder vibrating surface shown in Figure 1 is briefly recalled. In the literature this Green function is derived by applying space-Fourier transforms to the homogeneous counterpart of Eq. (3) formulated in cylindrical coordinates z, в, r (Morse and Ingard 1968; Junger and Feit 1986). More specifically, since the cylindrical geometry imposes a periodicity along the circumferential direction, a Fourier series is applied along the circumferential direction, such that

p(z,0, r) = ^pm2(z, r)eimi23, and a space-Fourier transform3 is applied along the

m2=—<&

3 Space-Fourier transforms are normally referred to as wavenumber transforms (Junger and Feit 1986; Fahy Gardonio 2007).

axial direction, which is given by pm2 (kz, r) =J pm2 (z, r)eJtzZdz, where the acoustic wave number is expressed as k2 = k2 + k2 and m2 = 0, 1, 2, … is the index for the Fourier series expansion in circumferential direction. In this way, the homogeneous counterpart of the partial differential Eq. (3) is transformed into a series expansion of Bessel’s differential equations in the unknown pm2 (kz, r)

functions. This series expansion is satisfied when each Bessel’s differential equation is set to zero. The solution of this set of equations can be found analytically in terms of Hankel functions. This formulation leads to a series expression whose terms are function of the axial wavenumber. Thus to obtain the Green function in the spatial coordinates, an inverse space-Fourier transform is implemented with reference to the axial wavenumber, which leads to the following expression (Morse and Ingard 1968; Stephanishen 1981; Lesueur 1988; Millard 1997)

Green function for the exterior sound field

G e (x e Iх, )


(13)


Green function for the exterior sound field

where the position vectors x e and x s are defined in cylindrical coordinates z, в, r, and m2 = 0, 1, 2, … Here R is the radius of the cylinder, H^(…) is the first kind Hankel function of order m and smi=0 = 1, smi >0 = 2 is the Neumann factor.

A comprehensive introduction to the wave number transform approach for the solution of wave equations can be found in the monographs by (Morse and Ingard 1968; Junger and Feit 1986; Millard 1997). Since the Green function in Eq. (13) satisfies Neumann’s boundary condition such that -^Ge(xe | xJ)| = 0 ,

П Ixe=xs

the integral expression in Eq. (10) reduces to Eq. (11). From the physical point of view this result follows from the fact that the Green function of Eq. (13) already includes the scattering effects that are produced by the cylinder.

Direct boundary integral equation for exterior and interior sound fields

Подпись: V2 p(x, t) Подпись: 1 d2 p(x, t) C2 st2 Подпись: V-f (x, t)-рШ! St Подпись: (1)

Assuming the system is linear, the exterior and interior sound fields of the model problem shown in Figure 1 can be expressed as the superposition of the boundary sound fields generated by the scattering/reflection and radiation effects of the flexible wall and the direct sound fields generated by acoustic sources located respectively outside and inside the cavity. Both terms can be derived starting from the following inhomogeneous acoustic wave equation (Dowling and Ffowcs Williams 1983)

that takes into account the effects produced by acoustic monopole and dipole sources. In fact, the excitation terms pdq(x, t)/dt and V – f(x, t) represent a kinematic (volumetric) monopole source and a kinetic (force) dipole source respectively. More precisely q(x, t ) is the rate of volume flow per unit volume produced by the monopole source and f(x, t) is a vector with the fluctuating forces produced by the dipole source. In this equation c0 is the speed of sound, p is the mass density of the fluid and the vector x identifies the position in the
exterior or interior fluid domains. Also V2p(x, t) is the Laplacian of p(x, t) and V ■ f (x, t) is the divergence of f(x, t). Assuming time-harmonic dependence, the wave equation can be rewritten in the following form (Morse and Ingard 1968; Nelson and Elliott 1992)

V2p(x, m)+k2p(x, m)=-Q(x, m) , (2)

where k – a/c0 is the acoustic wavenumber and the volumetric monopole and force dipole sources are merged in the term Q(x, m) = jprnq(x,®)-V-f(x,«). Also p(x,«), Q(x,«), q(x,«), V – f(x,®) are the frequency dependent complex amplitudes of the co-respective time-domain functions assuming the time – harmonic dependence is given in the exponential form exp( jat), where со is the circular frequency. The remaining part of this formulation will be expressed in the frequency domain and, for brevity, the frequency dependence of the complex amplitudes will not be displayed. The solution of Eq. (2) is derived in terms of acoustic Green functions G(x | x’, ®), which are chosen according to the problem under study and satisfy the following inhomogeneous differential equation (Morse and Ingard 1968; Nelson and Elliott 1992)

V2G(x | x’)+k2G(x| x’)=-£(x-x’) , (3)

where s(x – x’) is the three-dimensional Dirac delta function, which defines a point monopole source in x’ (Nelson and Elliott 1992). Thus, the Green function describes the spatial dependence of the complex pressure field at x produced by a harmonic point monopole source at x. Eq. (2) is then solved by multiplying it by G(x | x’) and subtracting to the resulting equation Eq. (3) multiplied by p(x) . The resulting equation is then integrated in the acoustic volume V, which yields

p(x’) = JVG(x | x’)V2p(x) – p(x)V2G(x | x’)]dV +jvQ(x)G(x | x’)dV. (4)

The Green’s theorem given in the form ^ (jV2g – ) dV = £ (jVg – gVf )• n dS

and the reciprocity property G(x | x’) = G(x’ | x) are then used to transform the first volume integral into an integral over the boundary surface S of the acoustic volume V. As a result, the following “direct boundary integral equation” is derived

c(x,) p(x’) = £ (G(x’| x)Vp(x) •n – p(x)VG(x’| x) • n)dS+JVG(x’| x)Q(x)dV, (5)

where

0 Подпись: -1 -1/2 Подпись: (6)

Подпись: x in V x' in S
Подпись: c(x') = <

x’ outside V

and n is a unit vector with direction orthogonal to the boundary surface S (note that, as shown in Figure 1, n has opposite directions for the exterior and interior domains).

In order to solve Eq. (5) it is necessary to define the pressure and pressure gradient on the boundary surface, i. e. for xeS. For a well-posed boundary – value problem, only one of the two sets of boundary conditions can be defined a priori. However, also the other set can be derived from the direct boundary integral equation by co-locating the point x’ on the boundary surface itself. Thus the derivation of the scattered/reflected or radiated sound fields by a flexible object or an enclosure is carried out in two steps based on the same integral equation. Although at first sight this may appear as a mere repetition of the same integration, the implementation of the first step is not trivial since the surface integral becomes singular when the point x’ is co-located on the boundary surface. Nevertheless this singularity is weak, and the surface integral converges in the regular sense (Wu 2000). There is also a second difficulty to be considered, that is, for exterior problems, the surface integral in Eq. (5) may not have a unique solution at certain characteristic frequencies. The reader is referred to specialised monographs that show how this problem is normally overcome with the so called CHIEF method (Wu 2000).

Besides the boundary conditions, a suitable Green function g(x’ | x) must be defined to implement the direct boundary integral Eq. (5). In principle there is a vast selection of functions that can be used to solve a given problem, since the only requirement is that they satisfy both Eq. (3) and the principle of reciprocity (Nelson and Elliott 1992). Nevertheless exterior and interior sound fields are normally handled with two specific types of functions that are described below.

Flexural Response and Interior Sound Radiation of a Closed Shell Excited by a TBL Pressure Field

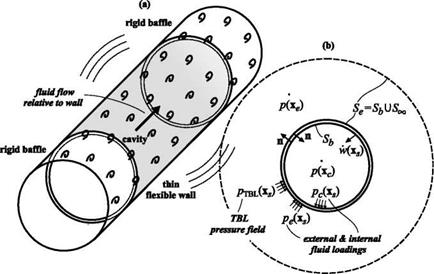
This section introduces a general formulation for the interior noise in a cavity bounded by a flexible wall, which is excited by the space and time stochastic pressure field exerted by a “Turbulent Boundary Layer” (TBL) relative fluid flow (for brevity, the fact that the fluid flow is relative to the wall structure will not be specified in the remaining part of this chapter). A coupled structural- acoustic formulation is presented considering a cylindrical cavity of finite length bounded by a thin flexible wall, which is assumed to be simply-supported at the two ends. As illustrated in Figure 1, the cylindrical flexible wall is connected to rigid extensions acting as baffles and is immerged in an unbounded fluid. The fluid is convected in axial direction and produces a fully developed TBL over the wall. Although this model problem can be used to study a limited number of practical systems, it provides general indications of the principal mechanisms characterising the TBL excitation, response and radiation phenomena of the complex enclosures that are encountered in surface and air passenger transportation vehicles (Mixson and Wilby 1995; Thompson and Dixon 2004).

Flexural Response and Interior Sound Radiation of a Closed Shell Excited by a TBL Pressure Field

Figure 1. (a) Cylindrical wall with rigid extensions immerged in a convected fluid that has developed a turbulent boundary layer in axial direction. (b) Notation for the exterior and interior fluid domains.

Flexural Response and Interior Sound Radiation of a Closed Shell Excited by a TBL Pressure Field

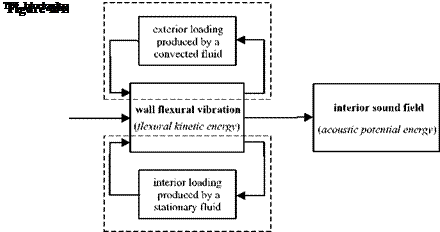
As schematically depicted in Figure 2, the interior sound radiation is produced by the flexural vibration of the enclosing wall, which depends on the resulting pressure fields acting on the inner and outer faces of the wall. The pressure field on the inner face is due to the interior sound field, which, in turn, depends on the flexural vibration of the enclosing wall itself. Normally, at low audio frequencies, the interior sound is characterised by standing wave fields due to the low order acoustic natural modes of the enclosure. Alternatively, at higher frequencies the interior sound field becomes increasingly diffuse since, at each frequency, the acoustic response of the enclosure results from the overlap of multiple acoustic modes whose number grows with the cube of frequency (Morse and Ingard 1968; Pierce 1989; Nelson and Elliott 1992; Fahy and Gardonio 2007). Usually the transition from standing wave to diffuse sound field is specified in terms of the “modal overlap” factor, which depends on the “modal density” and damping properties of the cavity (Cremer et al. 1988). At low frequencies where the acoustic response of the enclosure and the vibration response of the shell structure are characterised by distinct resonant modes, the interior fluid loading effect is normally formulated in terms of modal coupling

factors (Dowell and Voss 1962; Pretlove 1966; Fahy 1969; Guy and Bhattacharya 1973). Alternatively, at higher frequencies such that the acoustic and structural responses are controlled by the overalp of multiple modes, the fluid loading is modelled in average terms through coupling factors for “statistical energy analysis” models (Lyon and DeJong 1995; Craik 1996; Keane and Price 1997; Langley and Fahy 2004; Fahy and Gardonio 2007). In general, the interior of surface and air transportation vehicles is filled with air, i. e. a lightweight compressible fluid. As further detailed in Section 1.5, in this case the interior fluid loading primarily produces a damping action.

The pressure field on the outer face of the wall structure is characterised by two contributions: first, the pressure field produced by the TBL fluid flow over the flexible wall and second the acoustic pressure field due to the exterior sound radiation produced by the vibration of the flexible wall itself. As discussed in Chaper 6 of this book, the TBL fluid flow produces a stochastic pressure field over the external surface of the wall, which, in general, is also influenced by the flexural vibration of the wall (Graham 1997; Maury et al. 2002a). However, in this chapter, the so called “blocked pressure” field is considered, which corresponds to the pressure developed beneath a boundary layer on a hard wall. In this case the pressure generated by the TBL fluid flow is not affected by the flexural vibration of the wall and it is twice the pressure that a nominally identical turbulent fluid flow would generate in absence of the wall. This assumption is valid when the TBL is fully developed and the acoustic near field particle velocities produced by flexural vibration of the wall are small in comparison with the turbulence particle velocities (Graham 1997; Maury et al. 2002a). This type of approximation has been found valid in a wide range of cases as detailed in the following references, for example (Davies 1971; Efimtsov and Shubin 1977; Efimtsov 1986; Bano et al. 1992). A fully coupled model would require a rather complex formulation, using the Lighthill stress tensor to describe the boundary layer sources (Dowling and Ffowcs Williams 1983). The outward sound radiation due to the wall flexural vibration also produces a pressure field over the surface of the shell structure. In general, the exterior of surface and air transportation vehicles is characterised by air (i. e. lightweight compressible fluid), which, as will be shown in Section 1.5, for low flow speeds, tends to produce a damping fluid loading effect arising from the sound radiation into a fully or partially unbounded field (Junger and Feit 1986; Fahy and Gardonio 2007). However, the cruise speed of aircraft for passenger transportation approaches rather high values, around 0.8 Mach. In this case the flexible skin structure efficiently couples with the fluid dynamic response and gives rise to the so called “aeroelastic coupling” (Dowell 1975; Abrahams 1983; Lyle and Dowell 1994; Atalla and Nicolas 1995; Clark and Frampton 1997; Frampton and Clark 1997; Frampton 2005; Xin and Lu 2010). Clark and Frampton (Clark and

Frampton 1997; Frampton and Clark 1997; Frampton 2005) have shown that, for high flow speeds around 0.8 Mach, the convected fluid produces damping and increasingly higher mass impedance effects on the structure that tend to reduce the amplitude and to move to lower frequencies the resonance peaks that characterise the low-frequency spectrum of the flexural response of the enclosing wall structure. The aeroelastic response of shell structures is a rather complex non-linear phenomenon that involves strong coupling effects between low order flexural modes of the wall panels via the dynamics of the mean flow. Eventually, for very large flow velocities that exceed the speed of sound, this coupling effect may lead to limit cycle modal vibrations and thus to flutter instability conditions (Dowell 1975). Of course, flutter is of no concern for the skin panels of modern aircraft. Nevertheless, for high flow speeds approaching 0.8 Mach, the dynamic coupling between the panels and the fluid has a relevant effect on the response of the shell structure and interior sound radiation. The scope of this chapter is to introduce the principal characteristics of interior sound radiation produced by TBL disturbances. Thus, although the model problem considered in this section also refers to fast moving air transportation vehicles, to keep the analysis simple, the proposed formulation does not take into account aeroelastic coupling. However it considers the fluid loading effect arising from sound radiation into a stationary fluid, which can be assumed valid for flow velocities below 0.8 Mach. This formulation provides a good basis for the understanding of the physical mechanisms characterising the coupling of structural modes via the exterior fluid loading. In general, a high velocity mean flow tends to emphasise these coupling effects so that, even with lightweight compressible fluids, strong couplings between low order modes of the wall structure may emerge (Clark and Frampton 1997; Frampton and Clark 1997; Frampton 2005). In summary the model presented in this chapter considers the flexural response and interior sound radiation of a closed shell structure, which is excited by the blocked pressure field exerted by a TBL fluid flow and is influenced by the acoustic loading effects exerted by the interior and exterior fluids.

Much of the analytical work on the structural-acoustic response to TBL fluid flow excitation is organised around two types of models: the first is based on space-frequency domain formulations (Dyer 1959; Mead and Richards 1968; Crocker 1969; Davies 1971; Robert 1984; Blake 1986; Masson 1991; Bano et al. 1992; Filippi and Mazzoni 1994; Thomas and Nelson 1995; Durant et al. 2000), while the second is based on wavenumber-frequency domain formulations (Aupperle and Lambert 1973; Blake 1986; Hwang and Maidanik 1990; Strawderman 1990; Graham 1996; Borisyuk and Grinchenko 1997; Graham 1997; Han et al. 1999; Maury et al. 2002a). The first modelling approach uses the space-frequency spectra of the pressure fields exerted by the internal and external fluids and by the TBL fluid flow, which, as discussed in Chapter 6, was introduced by Corcos (Corcos 1963a; Corcos 1963b; Corcos 1967). The second is instead based on the wavenumber-frequency spectra of the pressure fields exerted by the internal and external fluids and by the TBL fluid flow. As discussed in Chapter 6, over the past three decades a selection of analytical or quasi-analytical models have been proposed in the attempt of describing the spectrum of TBL pressure fields both at convective and sub-convective wavenumbers (Chase 1980; Efimtsov 1982; Ffowcs Williams 1982; Chase 1987; Smol’yakov and Tkachenko 1991; Bull 1995; Graham 1997). Maury et al. (2002a) have analysed the principal characteristics of the space-frequency and wavenumber-frequency formulations in a consistent framework and have highlighted how the two formulations are related by spatial Fourier transforms.

As seen for the interior sound field, in general, at low audio frequencies the response of the wall structure is also characterised by a low modal overlap. Thus the expression of the flexural vibration field can be expanded into a series of modal terms with reference to the in vacuo natural modes of the structure. In this case both formulations in the space and wavenumber domains lead to double series modal expressions for the structural response and sound radiation, which include the self and mutual admittance functions for the modal excitation exerted by the TBL pressure field, the self and mutual fluid loading impedance functions and the self and mutual sound radiation efficiencies (Davies 1971; Blake 1986). With the space-frequency domain formulation, the modal excitation, fluid loading and sound radiation effects are derived from integral expressions in a bounded space domain. Alternatively, for the wavenumber-frequency domain formulation, these terms are derived from integral expressions in the unbounded wavenumber domain. Although the two approaches provide equivalent results, the formulation in the space-frequency domain is more intuitive to derive since it refers to spatial coordinates (Blake 1986; Thomas and Nelson 1995; Maury et al. 2002a). Nevertheless, with the wavenumber-frequency domain formulation, the expressions for the modal excitation, fluid loading and sound radiation effects are transformed into wavenumber spectra. Thus the response of the structure can be viewed as the result of filtering phenomena between the wavenumber spectra of the modal excitation, the interior and exterior modal fluid loading and the interior modal sound radiation (Blake 1986; Hwang and Maidanik 1990; Graham 1997). This provides direct insight on the physics of the excitation, fluid loading and interior sound radiation phenomena under study, although working in the wavenumbers domain requires some practice. Both types of approaches are based on double integrations, which, in general, cannot be solved analytically and thus involve numerical derivation using, for example, the Gaussian quadrature. The wavenumber approach offers some advantages when the geometry of the structure can be defined in terms of a single coordinate with reference to systems of orthogonal coordinates in which the structural vibration field, the interior sound pressure field and the exterior sound and TBL pressure fields are separable. In this case, the wavenumber integral expressions can be derived analytically in closed form (Junger and Feit 1986; Fahy and Gardonio 2007). On the other hand the spatial approach can be easily implemented when the vibration response of complex structures and the interior and exterior sound fields are derived with approximated methods such as the structural and acoustic “Finite Element Method” (FEM) and the acoustic “Boundary Element Method” (BEM) (Filippi and Mazzoni 1994). At high audio frequencies the structural response and the interior sound field increasingly become complex, since multiple resonant modes contribute to both the vibration and sound fields at each frequency. Thus alternative formulations based on energy functions are employed such as the “Statistical Energy Analysis” (SEA) method. This chapter considers only the modal formulation, which for simple model problems, such as the cylindrical enclosure considered in this section or the baffled panel considered in the following sections, provides realistic results also at high audio frequencies.

In summary this section introduces the space-frequency domain formulation for the structural-acoustic response to TBL fluid flow excitations. Also, it briefly discusses the derivation of the modal excitation functions in the wavenumber- frequency domain. The reader interested to know more about “full” wavenumber-frequency domain formulations is referred to the review papers by (Graham 1997; Maury et al. 2002a) and to the monograph chapters written by (Blake 1986). The space-frequency domain formulation presented here is built around the description of the interior and exterior sound fields and the modal representation of the distributed flexural vibration of thin shells. In general, the interior and exterior sound fields can be derived with the so called “direct boundary integral formulation”, which uses acoustic Green functions (Morse and Ingard 1968; Blake 1986; Junger and Feit 1986; Pierce 1989; Nelson and Elliott 1992; Fahy and Gardonio 2007). For the exterior fluid domain, this equation provides the resultant sound field produced by a distribution of acoustic sources and by the radiation and scattering effects of a flexible body (or multiple bodies) of arbitrary shape. Alternatively, for the interior fluid domain, it provides the resultant sound field produced inside the enclosure by a distribution of interior acoustic sources and by the radiation and reflection effects of the enclosure flexible walls. The effects produced by the surface of the body or enclosure are normally classified in terms of three different boundary conditions that prescribe a) the velocity distribution normal to the boundary surface (Neumann or natural boundary condition), b) the sound pressure acting on the boundary surface (Dirichlet or essential boundary condition) and c) the specific acoustic impedance normal to the boundary surface (mixed boundary condition) (Ciskowski and Brebbia 1991; Desmet 1998; Wu 2000; Gaul et al. 2003). In general, when the boundary surface is defined by a flexible structure, the boundary conditions for both the exterior and interior noise problems are expressed in terms of the acoustic particle velocity distributions normal to the boundary surface, which are considered compatible with the transverse vibration velocity of the flexible wall. Thus they are treated as Neumann boundary conditions. The boundary integral formulation involves a surface integration that can be solved in closed form only for few regular shapes (e. g. cylinders and spheres). For more realistic irregular boundary surfaces, approximated numerical methods are employed such as the acoustic “Boundary Element Method” (BEM) or the acoustic “Finite Element Method” (FEM) (Wu 2000; Fahy and Gardonio 2007). Although the two methods can be used for both interior and exterior sound problems, normally the BEM method is used for the exterior sound radiation/scattering problem, while the FEM method is employed for the interior sound radiation/reflection problem.

For simple wall structures either formed by a single span shell or an assembly of plate and shell panels, the flexural response can be derived analytically from the inhomogeneous equations of motion for closed shells or flat and curved panels. The flexural response is derived in terms of structural Green functions, which, are usually expressed as admittance or mobility functions (Gardonio and Brennan 2002; Gardonio and Brennan 2004). Also in this case, for distributed pressure field excitations, the expression for the response assumes an integral form over the surface of the structure. In general, only for very few simple structures, such as for example cylinders or flat and curved rectangular panels, the flexural response can be derived analytically. In practice, the body of surface and air vehicles are rather complex structures. Thus, as for the acoustic problem, approximated numerical methods are normally employed such as the structural FEM (Fahy and Gardonio 2007). When the analysis is limited to low audio frequencies, the problem is often simplified by considering a simple closed wall structure (e. g. a cylinder or a folded box) where the stiffening and mass effects of the reinforcing ribs are smeared over the surface of the structure. Alternatively, at mid and high audio frequencies, the response of different sections of the enclosure wall can be considered weakly coupled to each other and thus the problem can be split into the analysis of the structural-acoustic response of single span flat panels and curved shells.

As schematically shown in Figure 2, the coupled structural-acoustic analysis presented in this section is derived by combining the acoustic responses of the interior and exterior sound fields and the structural response of the flexible wall. The flexural response of the wall produced by the TBL pressure field and by the feedback effects exerted by sound pressure fields over the internal and external surfaces of the wall is derived from the structural equation of motion. The sound
pressure over the internal and external surfaces are derived from the direct boundary integral equations for the interior and exterior sound fields calculated on the boundary surface. The structural equation of motion and the direct boundary integral equations are then combined into a system of equations in the unknown sound pressure and particle velocity fields over the boundary surface. The resulting sound pressure and particle velocity fields are then used again in the direct boundary integral equation for the interior sound field to derive the noise radiation inside the enclosure.

To effectively establish the interior sound radiation and global flexural response of a cavity bounded by flexible walls, it is convenient to express the two phenomena in terms of energy functions, which embrace in a single term the spatially distributed nature of the sound and flexural vibration fields in the cavity and enclosing wall respectively (Nelson and Elliott 1992; Gardonio 2012). Moreover, the stochastic nature of the disturbance pressure field exerted by the TBL fluid flow on the external side of the flexible wall, makes indispensable to express these energy functions in terms of concepts and formulations for random processes. Thus, a particular formulation is introduced in Section 1.6, which is inspired to a similar study proposed by (Gardonio et al. 2012) and refers to the formulations for stationary stochastic processes given in (Crandall and Mark 1963; Newland 1975; Bendat and Piersol 2000).

Boundary Layer Noise – Part 2: Interior Noise Radiation and Control

Paolo Gardonio

Dipartimento di Ingegneria Elettrica Gestionale e Meccanica
Universita degli Studi di Udine, Via delle Scienze 208, Udine, Italy

Abstract This chapter is focused on the interior noise caused by a Turbulent Boundary Layer (TBL) relative fluid flow over the flexible thin walls of an enclosure. This is a typical interior noise problem encountered in surface and air passenger transportation vehicles. When such vehicles travel at high speed, the airflow around the skin develops into a TBL. This phenomenon produces large pressure fluctuations that effectively excite the skin panels of the vehicle, which, in turn, radiate noise into the interior.

The formulation for the coupled structural-acoustic response to a TBL pressure field is first introduced for a general model problem given by a cylindrical cavity bounded by a thin flexible wall, which is immerged in a convected fluid that has developed a TBL. Structural vibration and sound radiation effects are expressed in terms of the Power Spectral Densities (PSD) of the wall flexural kinetic energy and cavity acoustic potential energy.

A reduced model problem is then analysed in detail by examining a small section of the enclosure flexible wall and assuming a heavily damped interior. In this case a simplified model is used, which considers a rigidly baffled flat panel with unbounded fluid domains on the two sides. The panel is excited on the exterior side by the pressure field generated by a TBL fluid flow and radiates sound on the interior side. To facilitate the analysis, the PSDs of the panel flexural kinetic energy and interior sound power radiation produced by the TBL pressure field are contrasted with those produced by harmonic acoustic plane waves, by a stochastic acoustic diffuse field and by the so called “rain on the roof" stochastic excitation.

The chapter is then completed with two sections illustrating the principal effects produced by mass, stiffness and damping passive treatments and structural-acoustic active systems on the panel. The first active system consists of an array of decentralised feedback loops with point sensor and actuator transducers while the second active system is composed by a single channel feedback loop with distributed sensor and actuator transducers.

R. Camussi (Ed.), Noise Sources in Turbulent Shear Flows: Fundamentals and Applications, CISM International Centre for Mechanical Sciences, DOI 10.1007/978-3-7091-1458-2_7,

© CISM, Udine 2013

Concluding remarks

A brief overview of the studies made in the field of boundary layer noise in the last 60 years, has been reported, with particular emphasis on the interior noise problem and the mechanisms underlying the generation of the wall pressure fluctuations responsible for the panel vibrations and the transmission of noise.

The problem of the acoustic radiation due to the interaction of a turbu­lent boundary layer with a solid surface, has been treated only qualitatively. The prediction of the far field noise can be achieved by integral formulations and the main feature outlined in the present notes consisted in an order of magnitude estimation of the terms representing the far field pressure solu­tion. The practical consequences of those results have been discussed in the framework of the airframe noise problem.

More emphasis has been given on the description of the wall pressure statistics mainly in terms of their spectral content estimated in the Fourier domain. The scaling parameters of the frequency spectra have been dis­cussed in connection with the properties of the near wall and the outer – layer regions of the turbulent boundary layer. The main properties of the wavenumber-frequency spectra have been also reviewed and discussed along with the main statistical models proposed in literature to predict the auto – and cross-spectra behaviors.

More practical aspects have been treated by considering the case of sep­arated flows and the complex behavior arising by the interaction of the boundary layer with shockwaves.

Effect of adverse pressure gradient and separation

An overall effect of adverse pressure gradients onto the wall pressure field statistics is an increase of the wall pressure fluctuations and a reduction of the convection velocity. This behavior was first observed by Schloemer (1967) through an experimental study devoted to the investigation of the influence of a mild adverse pressure gradient on wall pressure fluctuations. Owing to changes in the streamwise turbulent intensity, Schloemer also noticed an increase in the wall pressure spectral densities at low-frequencies (in outer scaling), whereas little effect was observed in the high-frequency range. This result has been later confirmed [see e. g. Lim (1971)] and seems to suggest that the pressure gradient influences the outer layer region which, as described above, is directly correlated to the mid and low frequency range of the wall pressure frequency spectra.

Na & Moin (1998) performed a Direct Numerical Simulation (DNS) of a turbulent boundary layer developing over a flat plate, under both mild and strong imposed adverse pressure gradient. In the latter case (involving extensive separation) the frequency spectra in the separation bubble were found to exhibit a ш-4 decay, whereas a u-2 behavior at high frequencies was observed for the spectra downstream of the reattachment position. The analysis of two-point correlations of wall pressure fluctuations also revealed strong coherence in the spanwise direction, that was attributed to the oc­currence of large two-dimensional roller-type vortical structures. These au­thors also showed that the presence of flow separations, re-circulations and re-attachments lead to the generation of wall pressure fluctuations whose overall level might be significantly larger (up to 30dB) than that observed in equilibrium turbulent boundary layer with no separations.

Measurements of surface pressure fluctuations for a separated turbulent boundary layer under adverse pressure gradient were reported by Simpson, Ghodbane & McGrath (1987). Those authors found that pressure fluctua­tions increase monotonically through the adverse pressure gradient region, and showed that the maximum turbulent shear stress in the wall-normal direction can be used as a scaling variable since it yields good collapse of the normalized spectra at various streamwise stations.

Several studies have been conducted to characterize the fluid dynamic structure of flows whose separation is induced by a surface discontinuity. Detailed results have been obtained for several geometries, including back­ward facing steps [see Simpson (1989), and the literature cited therein for a comprehensive review in the field], sharp edges [as in Kiya, Sasaki & Arie (1982), Kiya & Sasaki (1985), and Hudy, Naguib & Humphreys (2003)], inclined surfaces [e. g. Song, DeGraaff & Eaton (2000)] and surface bumps [e. g. Kim & Sung (2006)]. Most of these studies have shown that the wall pressure fluctuations are driven by a low frequency excitation linked to the expansion and contraction of the separation bubble, a phenomenon usually designated as flapping motion. Besides, the vortical structures within the shear layer have been identified as the source of higher frequency peaks normally observed close to the reattachment position.

Stiier, Gyr & Kinzelbach (1999) analyzed the separation bubble up­stream of a Forward Facing Step (FFS) in laminar flow conditions through flow visualizations and particle tracking velocimetry measurements. They demonstrated that the laminar re-circulating region upstream of the step is an open separation bubble characterized by spanwise quasi-periodic un­steadiness. The flow topology and the pressure field upstream and down­stream of an FFS at much higher Reynolds numbers have been recently stud­ied by Largeau & Moriniere (2007). The effect of the relevant length-scales has been underlined in this work and the influence of the flapping motion upon the pressure field at the reattachment point has been demonstrated by means of pressure-velocity cross-correlations obtained from simultaneous wall microphones and hot wire anemometry measurements. Fourier pres­sure spectra upstream and downstream of a FFS have been presented also by Efimtzov et al. (1999) who showed that the region downstream of the step is the most significant in terms of pressure level. On the other hand, Leclercq et al. (2001) considered the acoustic field induced by a forward – backward step sequence and suggested that the most effective region in terms of noise emission is located just upstream of the FFS. The exper­imental results reported in Leclercq et al. (2001) have been successfully reproduced in a large eddy simulation performed by the same group, Addad et al. (2003). It was confirmed that the largest acoustic source is located in the separated region upstream of the wall discontinuity. Camussi, Guj & Ragni (2006) and Camussi et al. (2006) measured the pressure fluctua­tions at the wall of a shallow cavity representing a backward-forward step sequence. The authors again showed that the region close to the FFS is the most effective in terms of wall pressure fluctuations level even though the origin of the observed acoustic field was not clarified. In a recent study of the incompressible flow past a forward-facing step, Camussi et al. (2008) also observed the increase of energy at low-frequencies and a decrease at higher ones.

A flow separation can be induced also by the effect of a shockwave inter­acting with the boundary layer, a situation that can typically be encountered in transonic flow conditions. The prediction of pressure fluctuations in the transonic regime is particularly important in the vibro-acoustic design of aerospace launch vehicles. As a matter of fact, vibrations induced in the interior of the vehicle can exceed design specifications, and cause payload damage, as well as structural damage due to fatigue problems.

The presence of a shockwave and the consequent separation, causes an adverse pressure gradient that modifies significantly the boundary layer dy­namics and causes substantial modification of the wall pressure signature. The Mach number effect in attached boundary layers has been taken into account in a few literature models [see e. g. the one proposed by Efimtsov (1982) and cited above]. On the other hand, the effect of the shockwave induced separation on the wavenumber-frequency spectrum is the subject of quite a few literature papers. We remind the numerical studies con­ducted by Pirozzoli and co-workers [Pirozzoli, Bernardini & Grasso (2010) and Bernardini, Pirozzoli & Grasso (2011)] based on a DNS approach used to simulate the shockwave induced separation on a flat plate at a transonic Mach number (M = 1.3). They show that the shape of the frequency wall pressure spectra is qualitatively modified by the interaction with the shock wave. In the region with zero pressure gradient, the shape of the spectra is similar to that observed in low-speed boundary layers. When the pres­sure gradient is relevant, the low-frequency components of the spectrum are enhanced while the higher ones are attenuated. This observation is in agreement with results obtained in low-speed boundary layers in adverse pressure gradient and it is the signature of the greater importance of large – scale, low-frequency dynamics past the interacting shock, with respect to the fine scale effects. According to observations in low speed flows upstream an FFS by Camussi et al. (2008), in the separated region downstream of the shock, a self-similar structure of the pressure spectra is observed ex­hibiting the -7/3 inertial scaling at intermediate frequencies and a -5 decay law at high frequencies.

Similar scalings were observed in transonic and supersonic flow condi­tions by Camussi et al. (2007). They analyzed the statistics of the wall pressure fluctuations on a scaled model of an aerospace launcher that has been investigated in transonic and supersonic wind tunnels. Even though qualitatively, the -1 and -7/3 scalings were documented at several stations along the surface of the model.

The determination of a general predictive model for the wavenumber – frequency spectrum in the presence of shockwaves is however still far and, to the authors’ opinion, this topic merits to be the task for future extensive research.

Coherent structures and wall pressure fluctuations

As pointed out above, it is possible to establish a connection between the wall pressure wavenumber spectra and physical quantities describing the turbulent boundary layer. In particular, the high wavenumber components should be attributed to fluid dynamic structures in the near wall region while the low wavenumber domain is influenced by the large scale struc­tures in the outer layer. However, the detailed features of organized events that occur in the boundary layer are lost by the unconditional averaging techniques used in obtaining spectral estimates of the pressure field. This is an important issue from the practical viewpoint since a deeper knowledge of the fluid dynamic structures underlying the observed pressure properties may be helpful to address suitable control strategies aimed at manipulating the flow structures and modifying the wall pressure behavior.

Numerical simulations of simplified configurations attempted to clarify the connection between wall pressure fields and near wall vortical structures whose topology was selected a-priori according to classical conceptual mod­els of the turbulent boundary layer. For example, Dhanak & Dowling (1995) and Dhanak, Dowling & Si (1997), following the conceptual model of the boundary layer proposed by Orlandi & Jimenez (1994), were able to clarify the effect of near wall quasi-streamwise structures upon the wall pressure field. More recently, Ahn, Graham & Rizzi (2004) and Ahn, Graham & Rizzi (2010) reproduced correlations and spectra at the wall. In order to estimate the wall pressure distribution, they reproduced hairpin vortex dy­namics on the basis of the so called attached eddy model proposed by Perry & Chong (1982).

Only a few experiments have been focused on these aspects, since the correlation between wall pressure and coherent structures is rather difficult to interpret due to the chaotic nature of the pressure field. Among the existing studies, the work by Johansson, Her & Haritonidis (1987) can be mentioned: they carried out simultaneous pressure-velocity measurements and suggested physical mechanisms for the underlying generation of positive or negative pressure peaks at the wall. However, they did not clarify the connection between the educed structures and the wall pressure spectral quantities.

In a recent paper, Camussi, Robert & Jacob (2008) applied non conven­tional time-frequency post-processing tools to analyze wall pressure experi­mental data. The application of multi-variate wavelet transform permitted them to establish a connection between sweep/ejections events and large pressure coherence. More specifically, using a conditional sampling tech­nique, they observed that averaged pressure signatures due to hydrodynamic effects were composed of a large negative pressure drop coupled to a weaker positive bump. This behavior was ascribed to accelerated-decelerated mo­tions within the turbulent boundary layer.

The presence of a positive pressure bump coupled with a stronger neg­ative pressure drop was also observed by Dhanak & Dowling (1995) who simulated numerically the pressure field induced at the wall by streamwise vortices. Similarly, in an experiment performed by Johansson, Her & Hari – tonidis (1987) negative-positive pressure jumps were also observed and were identified as burst — sweep events. The conditional results of Johansson, Her & Haritonidis (1987) were obtained by correlating pressure negative peaks with velocity events found in the buffer region of the boundary layer through the so-called VITA technique [see e. g. Blackwelder & Kaplan (1976)].

Analogous conclusions were driven by Jayasundera, Casarella & Russell (1996) through the investigation of experimental wall pressure and inflow velocity data and the application of coherent structures identification tech­niques. They showed that the organized structures present within the tur­bulent boundary layer contain both ejection and sweep motions inducing positive and negative pressure events respectively.

More recently, Kim, Choi & Sung (2002) attempted to correlate the wall pressure fluctuations with the streamwise vortices of a numerically simulated turbulent boundary layer. They suggest that the high negative wall pressure fluctuations are due to outward motion in the vicinity of the wall correlated to the presence of streamwise vortices.

The wave-number frequency spectrum

In this section the main characteristics of the wall pressure spectrum are briefly reviewed. First, the scaling properties of the frequency spectra are discussed taking into account the most relevant experimental investigations conducted in the last 50 years. Then, illustrative examples of statistical models of the wavenumber-frequency spectrum are revised starting from the early Corcos’ idea up to the most recent developments.

Scaling of the frequency spectra Due to the complex structure of the turbulent boundary layer, it is not possible to obtain a single scaling that leads to a satisfactory collapse of experimental or numerical frequency spec­tra Фр(w). As will be clarified below, it is possible to normalize the spectra using inner or outer variables, and a universal collapse can be obtained in various regions of the pressure spectra separately [see, among many, the early work by Willmarth (1975) and the papers by Keith, Hurdis & Abra­ham (1992), Farabee & Caserella (1991) and Goody et al. (1998)]. This is due to the fact that the wall pressure is influenced by velocity fluctuations from all parts of the boundary layer and because the convection velocity depends strongly upon the distance from the wall, as a result of the non­uniform mean velocity distribution.

For an incompressible flow, the wall pressure can be written in the form of a Poisson’s equation,

V2 p(x, t) = q(x, t) (42)

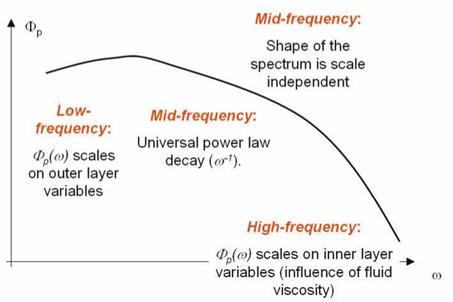
where q(x, t) represents the source terms. As suggested by Farabee & Caserella (1991), the analysis of the solution of the above equation in the Fourier domain, shows that the contributions to the high-frequency portion of the spectrum has mainly to be attributed to turbulence activity located in the near wall region while contributions to the lower-frequency portion can originate from activities throughout the boundary layer. Following this physical picture, and the conjectures suggested by Bradshaw (1967) and Bull (1979), it is possible to divide Фр(ш) into three main regions, depend­ing on the frequency magnitude. At low frequencies, Фр(ш) scales on outer layer variables; at high frequencies, Фр(ш) is influenced by the fluid viscosity and thus it scales on inner variables; at intermediate frequencies, the shape of the spectrum is scale independent and an universal power law decay of the type ш-1 is expected.

Measurements of the cross-spectral densities [e. g. Bull (1967) and Farabee & Caserella (1991)] confirm that the pressure field can be divided into two distinct families, one associated with the motion in the outer layer and the other with motion in the inner layer. This separation occurs at the frequency where the auto-spectrum exhibit its maximum value. This frequency sepa­rates the non-universal from the universal scaling regimes of the frequency spectrum.

More precisely, in the low frequency region, different outer scalings have been identified. Keith, Hurdis & Abraham (1992) suggests to scale the fre­quency using U (the free stream velocity) and S*, whereas the amplitude of the pressure spectrum can be scaled through the free stream based dynamic pressure q. Other authors [including Farabee & Caserella (1991)] recom­mend a more effective scaling using tW instead of q. They suggest to scale the frequency upon U/S and the dimensionless spectrum to be of the form фР (^)u/tW s.

In the high frequency region, there is a more general consensus on the most effective scaling that is achieved through the variables UT, v and tW. This implies that the dimensionless frequency is uv/UT and the dimension­less spectrum should be ФР(u)U2/tW.

The universal region can be interpreted as an overlap of the two regions described above. In this part of the spectrum it is assumed шФР(u)U/tW = constant, thus leading to the ш-1 scaling. A precise definition of the ampli­tude of the frequencies bounding the universal region can be found in Bull (1979) and Farabee & Caserella (1991).

An additional range at very low frequencies has been also identified by some authors. Farabee & Caserella (1991) determine this region at uS*/U < 0.03 and they collapsed the spectrum using the normalization ФР(u)U/q2S*. In the very low frequency region they observed the spectrum to scale as ш2. This form of scaling is in agreement with the prediction given by the Kraichnan-Phillips theorem [Kraichnan (1956) and Phillips (1956)] which suggests that the wavenumber spectrum should scale like k2 as k ^ 0. According to the theoretical developments of e. g. Lilley & Hodgson (1960), this conclusion can be extended to the frequency spectrum under the hy­pothesis of low Mach number flow conditions.

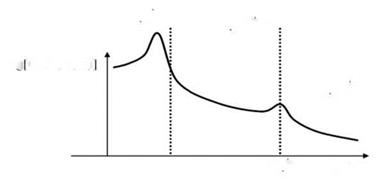
In Figure 5 a scheme summarizing the expected scalings is reported.

The wave-number frequency spectrum

Figure 5. Sketch clarifying the expected scaling regions of a typical wall pressure auto-spectrum.

We refer to the literature [in particular Farabee & Caserella (1991) and Bull (1996)] for further discussions on the above topics and considerations about the scaling of the pressure variance.

Modeling the wavenumber-frequency spectrum According to the above discussion, several models have been proposed in the literature to reproduce the shape of the frequency auto-spectrum using suitable fits of experimental data. Here we only cite some of them as illustrative examples of common approaches. We refer to the literature for comprehensive reviews.

An early and widely used model was proposed by Corcos (1964). He gives the following representation of the frequency auto-spectrum:

C for ш < jjf

фрН = (43)

C for ш > j

The quantity C is a dimensionless constant and U is the external velocity. Note that for ш > Ц – the model correctly predicts the power law decay of the spectrum of the form ш-1.

An example, among many, explaining the way the Corcos’ early model has been successively modified, is given by Cousin (1999). This more general approach leads to the following expression:

( 2.14 x 10⁻⁵B for ш5*/ие < 0.25

Фр(ш) = і 7.56 x 10⁻⁶B (w5*/U)-0’75 for 0.25 < w5*/Ue < 3.5 (44)

[ 1.27 x 10⁻⁴B (ш5*/и)-3 for u5*/Ue > 3.5

where B = q2S*/U.

Other formulations worth mentioning are those by Efimtsov (1986) and Chase (1987, 1991). We refer to the literature for the details.

As pointed out above, the knowledge of the frequency spectrum is not sufficient to determine the modal excitation term of a plate subject to the turbulence induced pressure filed. This quantity is directly related to the shape of the complete wavenumber-frequency spectrum of the wall pressure field. The knowledge of Фр(к1,к2,ш) is therefore fundamental to compute the response of a surface panel subject to the action of the random pressure load.

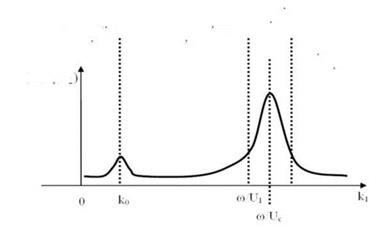
As pointed out by Bull (1996), the highest spectral levels of the pres­sure fluctuations are associated to the mean flow convection and, in the wavenumber spectrum, are centered on a wavenumber к1 = u/Uc, к1 along the free stream velocity. This part of the spectrum is often referred to as the convective ridge. For к1 ^ ш/Uc the spectrum is expected to be independent of the wavenumber. Another important aspect is related to the so-called sonic wavenumber к0 = ш/c. According to Blake (1986), for к = к0 an apparent singularity is present in the spectrum. However, in real flows, the wavenumber-frequency spectrum is expected to have a local finite peak in the vicinity of к0. These are among the main features that an analytical model attempting to predict the Фр(к1,к2,ш) shape, have to reproduce correctly.

One of the most reliable model developed in literature is again the early approach proposed by Corcos (1964) and based on the Fourier transform of a curve fit of measured narrow band pressure correlations. According to extensive experimental measurements [namely Willmarth (1975) and Bull (1967)], the cross-spectral density Гр(^1 ,&,ш) can be represented as:

Гр(£і,6,ш) = Фр(ш) A^i/Uc) B(ub/Uc) /Uc (45)

where

A(w£i/Uc) = е-аіІША/и and B(u&/Uc) = e-a2^l/U

The wave-number frequency spectrumThe wave-number frequency spectrumФр( (o. ki. k-*

Подпись: region

The wave-number frequency spectrum
Подпись: viscous

Figure 6. A scheme representing the wavenumber-frequency spectrum as a function of wavenumber, at constant frequency (scheme adapted from Blake (1986)).

Іоц Фр(со. к|.к:)

supersonic

The wave-number frequency spectrum Подпись: logical

region

Figure 7. A scheme representing the wavenumber-frequency spectrum as a function of frequency, at constant wavenumber (scheme adapted from Blake (1986)).

whereas Uc is the convection velocity and a1 and a2 are parameters chosen to yield the best agreement with experiments. Various values are given in the literature. The typical range of the values is a1 = 0.11 + 0.12 and a2 =0.7 + 1.2 for smooth rigid walls.

Unfortunately, only few experimental or numerical data concerning di­rect measurements of the wavenumber-frequency spectrum are available in the literature [Abraham (1998), Choi & Moin (1990), Panton & Robert (1994), Farabee & Geib (1991), Hwang & Maidanik (1990), Manoha (1996)]. However, it appears evident that a big spread is present in the low wavenum­ber range and that the Corcos model overpredicts levels at wavenumbers below the convective peak. This point is crucial for many applications, in particular in the case of underwater and surface marine vehicles and for aeronautical structures above the aerodynamic coincidence frequency [see also Ciappi et al. (2009)]. Later workers used analytical or quasi analyti­cal approaches, or revised versions of the Corcos approach, in attempts to describe this region more accurately [see e. g. Graham (1997) for details].

Подпись: _Лі_ A(W,£I) = e Li(“) and B(w,&) Подпись: _ Л2І_ Є L2(W) Подпись: (46)

Most of the models proposed continued to follow the philosophy of the Corcos approach that can be generalized as follows. A first common feature of those empirical models is the separation of variables approach to repre­sent the correlation function dependence on the streamwise separation £i and the crossflow separation £2. This is known as the ‘multiplication hy­pothesis’ in which the coherence of the cross-spectral density for an arbitrary separation direction is formed by the product of the cross-spectral densities for streamwise and spanwise separations, respectively. The axisymmetry of the geometry and of the flow is usually not explicit in those formulations but it is accounted for through the adjustable coefficients. According to the Corcos idea given in Eq. 45, most of the models suggest to take exponential decaying form of the functions A and B,

where L1 and L2 are the so-called coherence lengths in the streamwise and spanwise direction respectively.

The main advantage of adopting the expression given in Eqs. 45 and 46 is that the auto-spectrum part is decoupled from the cross-spectrum part. That implies that any choice for modeling the function Фр(ш), as those described above, can be addressed independently of any choice for representing the functions Li and L2.

As for auto-spectra, Cousin modified the Corcos model yielding the fol-

Подпись: Li L2 The wave-number frequency spectrum The wave-number frequency spectrum Подпись: -1/2 1/2 Подпись: (47)

lowing expressions of the coherence lengths:

where Uc = 0.75U, bM = 0.756, bT = 0.378. a1 = 0.115 for smooth walls and 0.32 for rough walls, whereas a2 = 0.32 in all cases.

A similar model, not reported here for brevity, has been proposed by Cockburn & Robertson (1974). Wu & Maestrello (1995) proposed a model where the flow is assumed semi-frozen and decaying in space and time at a constant velocity Uc. After performing a comprehensive set of experimental results of wind tunnel testing, they defined an ensemble average of the cross correlation for the pressure fluctuation due to the turbulent boundary layer in which the effects of the Reynolds number and the boundary layer thickness were included.

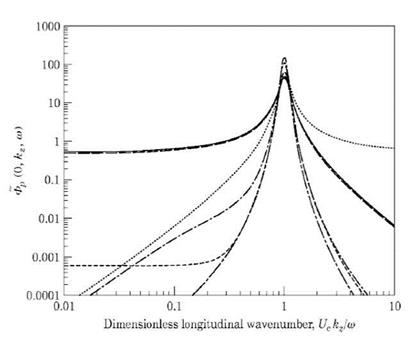
Other models proposed by Chase (1980), Efimtsov (1982), Ffowcs Williams (1982), Chase (1987) and Smol’yakov & Tkachenko (1991) are compared in Graham (1997) and a plot reporting the spectra predicted by different models is given in Figure 8. It is shown that even at the convective peak, a relevant scattering among the model predictions is evident. Even larger scattering is observed in the estimation of the radiated sound as reported in the same paper.

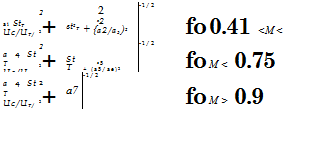
The best model for high speed aircraft is, according to Graham, the one which provides an accurate description of the convective peak. Efimtsov’s model, an extension of Corcos model, is cited as a suitable candidate. For the sake of completeness, we report in the following the Efimtsov idea:

Подпись: ai StT Uc/UT/ 2 2 -1/2 2+ st2T a2 + {a2/a3)2 for 0.41 <M < 2.1 2 -1/2 a 4 St T Uc/UT/ 2+ StT a5 + (a5/ae)2 for M < 0.75 a 4 St T Uc/UT/ 2 -1/2 2+ a7 for M > 0.9 Подпись: (48)Подпись:L1

L2

L2

In this model Uc = 0.75Ue and StT = w6/UT is a Strouhal number defined on the friction velocity. Averaged values of the empirical constants are ai = 0.1, a2 = 72.8, a2 = 1.54, 0,4 = 0.77, 0,5 = 548, a6 = 13.5, a =

5.66. It can be shown that at high frequencies, these expressions correspond to a Corcos model with a1 =0.1 and a2 = 0.7. Even though the number of

empirical constants is relevant, the model is extensively used thanks to the introduction of the Mach number as a relevant parameter.

The wave-number frequency spectrum

Figure 8. Wavenumber frequency spectra computed at a fixed frequency as reported in Graham (1997). The spectra are computed as functions of the longitudinal wavenumber non-dimensionalized on the convective wavenum­ber ш/Uc (courtesy of JSV).

More recently, Singer (1996a) and Singer (1996b) performed a Large – Eddy Simulation (LES) of a turbulent boundary layer at relatively high Reynolds number and proposed a model that overcomes the ‘multiplication hypothesis’ that is the basis of all the models based on the Corcos’ phi­losophy. His approach is based on an accurate fit of the two-dimensional coherence and therefore is particularly efficient for the determination of the off-axis coherences.

To the best of our knowledge, the most recent model proposed in liter­ature is the one presented by Finneveden et al. (2005). They suggested a modified version of the Corcos and of the Chase model, thus going back to the ‘multiplication hypothesis’. They demonstrated that it is possible to find for both models a complete set of free parameters that provide a fair agreement with experimental data. The key point was to modify the Corcos model by introducing a frequency and flow speed dependence in the parameters and to introduce two new parameters in the Chase model to better fit the spanwise coherence to measurements.