Category Principles of Helicopter Aerodynamics Second Edition

Rotor Power Requirements in Forward Flight

The rotor power in forward flight is given by the equation

P = r(VooSina + Vi) = TVoosina + Tu, (2.139)

assuming no viscous losses at this stage. The first term on the right-hand side of the above equation is the power required to propel the rotor forward and also to climb. The second

term is the induced power. As for the axial flight case, we may reference the rotor power in forward flight to the hover result and so

Подпись:P P TfVoo sin a + VooSina + u,- X Ph T vh T vh vh Xh

Rotor Power Requirements in Forward Flight Подпись: (2.141)

Therefore, the form of the power curve simply mimics the inflow curves shown previously in Fig. 2.26. Notice that the power requirements decrease significantly to a minimum value and then increase again. This is a fundamental characteristic of a helicopter and the behavior[12] is examined in much further detail in Chapter 5. The behavior was first noticed in early experiments by Maxim (1897), Riabouchinsky (1906), and Beliner (1908) (see page 16). The results also depend on the disk angle of attack, which must always be tilted forward slightly for propulsion (see Fig. 2.23). Recall that

Подпись: X Xh Подпись: P yh Rotor Power Requirements in Forward Flight Подпись: (2.142)

Therefore,

Rotor Power Requirements in Forward Flight Подпись: D T Подпись: D T' Подпись: (2.143)

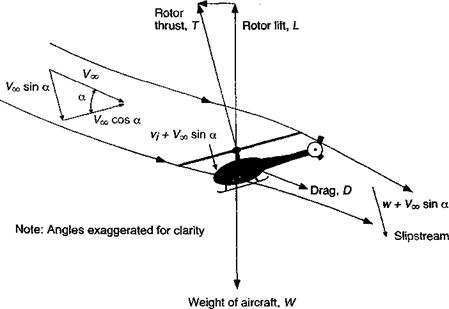
The first term on the right-hand side of the above equation is the extra power to meet propulsion and climb requirements, whereas the second term is the induced power. As mentioned previously, the evaluation of the propulsive power requires a knowledge of the rotor disk angle of attack, which in turn requires a knowledge of the helicopter’s drag, D. Assuming straight-and-level flight, the disk angle of attack, a, can be calculated from a simple force equilibrium (see Fig. 2.23). For vertical equilibrium T cos a — W and for horizontal equilibrium T sin a = Dcosa « D. Therefore,

which is expressed in terms of the helicopter’s overall lift-to-drag ratio. Therefore, the power equation in straight-and-level flight can be written as

Подпись: (2.144)P_ – !L (—) + kh

Ръ xhTj Уд2 + x2

The determination of D, however, requires a knowledge of both the drag on the rotor and the drag on the airframe, the latter of which is called parasitic drag. The rotor drag must be estimated using blade element theory. The AoA of the disk relative to the oncoming flow will change in a climb or descent, thereby altering the power required. In this case, the power ratio can be written as

— = Ac cos a + — tana H—— (2.145)

Ph ^h yjpf + X2

where Xc is climb velocity ratio. In each case, the disk AoA can be solved for on the basis of a free-flight force equilibrium (even if this is only approximate).

Validity of the Inflow Equation

The inflow equation as given by Eq. 2.126 or Eq. 2.137 is widely employed for practical calculations involving rotors in climbing and descending flight in both axial and forward flight. However, a nonphysical solution will always be obtained if there is a descent (upward) component of velocity normal to the rotor disk that is between 0 and 2t>, (i. e., if —2Vi < Voo since < 0 in level flight). Under these conditions there can always be two possible directions for the flow and there can be no well-defined slipstream boundary as was assumed in the physical model. Therefore, the momentum theory cannot be applied under these conditions. For example, this can occur when the rotor disk is at steep angles of attack.

With the numerical solution several things may occur if these restrictions are ignored. First, the simple fixed-point iteration method may not converge. This will always be the case for axial flight (/z. = 0) when —2 < Vc/vi < 0. Second, the fixed-point iteration method may converge, but to a nonphysical solution. In such cases caution should be exercised and the results should probably not be used unless validated by other means. The Newton – Raphson method will generally converge under all conditions, but again the solutions will be nonphysical in the range —2ty < Voo sin a < 0. The Newton-Raphson method is also sensitive to the initial conditions and may converge to different nonphysical solutions if inappropriate initial conditions are used. Generally it is assumed that ко = – JCt /2 and this will be satisfactory when the rotor is in the normal working state. However, this initial condition will cause the method to fail for descents (i. e., Vc < 0). Here, convergence of the Newton-Raphson method to the proper physical result can generally be ensured if ко = —kc. Overall, results from the numerical solution to the inflow equation should be used with sensible cross checks to the analytic results wherever possible.

Numerical Solution to Inflow Equation

Because a can never be zero in any practical case, Eq. 2.126 is usually solved numerically. While analytic solutions of the inflow equation for а ф 0 are possible, proper selection of the correct root from a set of multiple complex roots make the approach aca­demic and of little practical engineering use. There are two common numerical approaches:

1. A simple fixed-point iteration or 2. A Newton-Raphson iteration. The algorithm for the fixed-point iteration is extremely simple. It consists of a loop to iteratively compute new estimates of к until a termination criterion has been met. Equation 2.126 can be written as the iteration equation

Ct

kn+i = tit ana-1—— . ——– (2.132)

2УД+ЇЇ

Подпись: e = Подпись: '•n+l Подпись: (2.133)

where n is the iteration number. The starting value for Ao is usually the hover value (i. e., k0 = kh = у/Ст/2 )• The error estimator is

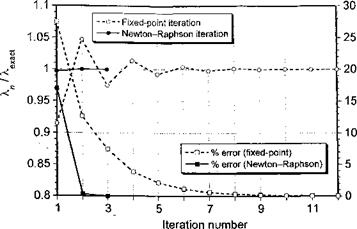
Normally, convergence is said to occur if є < 0.0005 or 0.05%. One normally finds that between 10 and 15 iterations are required with the fixed-point iteration approach (Fig. 2.25). However, under some conditions, especially at lower advance ratios, a larger number of iterations may be necessary.

One can also use a Newton-Raphson procedure to solve for k. The advantage here is that for the price of computing a simple first derivative the convergence is much more rapid. In this case, the iteration scheme is

Подпись:‘ m’

-/w I’

Numerical Solution to Inflow Equation Подпись: (2.135)

where n is the iteration number. Equation 2.126 may be rearranged in the form f{k) = 0 giving

Differentiating this expression to find /'(A) gives

/'(X) = l + ^(^ + A.2)"3/2X. (2.136)

Although the Newton-Raphson method can be sensitive to the starting value (initial conditions), in most cases the hover value Ao = A* works well, with only 3-4 iterations

Numerical Solution to Inflow Equation

Figure 2.25 The solution of the inflow equation is obtained iteratively, with rapid convergence.

being required to reach the tolerance compared to up to 10 or more iterations using fixed – point iteration, as shown in Fig. 2.25. However, the computing costs with either method are essentially trivial on a computer. See also Questions 2.17 and 2.18.

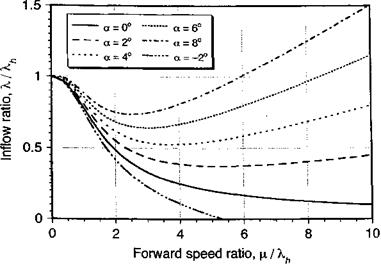
Results for the inflow ratio A,/kh as computed using the iterative scheme are plotted in Fig. 2.26 for several different values of a (both positive and negative) and over a range of values of fx/Xh typical of a helicopter. Notice that the induced part of the total inflow de­creases with increasing advance ratio and the total inflow becomes dominated by the jx tan a term at higher advance ratios. Notice also that negative disk angles ultimately produce a negative inflow (upflow) through the disk, which means that the rotor is approaching a zero power required state or the autorotational condition (see Section 2.14.6).

Numerical Solution to Inflow Equation

Figure 2.26 Inflow ratio X/Xh as a function of forward speed ratio /хДА for several rotor disk angles of attack.

2.14.2 General Form of the Inflow Equation

The inflow equation given by Eq. 2.126 needs to be written in a more general form for climbing or descending flight. In this case the inflow ratio can be rewritten as

Cj

к = xx tan a H——- ————- + jxy. (2.137)

2 у l^x T

where = VooCosa/SIR and ц, у = Vasina/SIR can be recognized as the advance ratios defined parallel and perpendicular to the rotor disk, respectively. It will be apparent that this latter equation can be written simply as

Cf

k = x tanaH—– -===== T kc cos oc. (2.138)

2v^+l2

Special Case, a = 0

Special Case, a = 0 Special Case, a = 0 Подпись: (2.127)

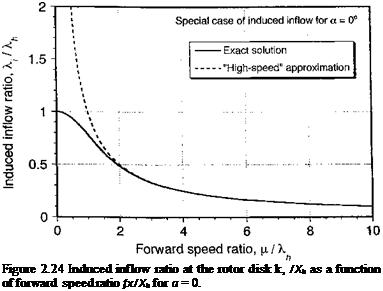
If the disk AoA is zero (a = 0), an exact analytical solution for X can be determined. This is a physically unrealistic situation because the rotor must always be tilted slightly forward to produce a propulsive force. However, this special solution serves to illustrate the basic form of the induced part of the inflow through the rotor disk in forward flight and also provides a check case for the numerical solution (considered next). With a — 0, the induced velocity ratio in forward flight is

Squaring both sides of the above equation and rearranging gives

Подпись: (2.128)xf + ^x2-x4h = 0.

Dividing by XAh gives

Special Case, a = 0(2.129)

which is a quadratic in (Xi/Xh)2. This quadratic has the solution

Special Case, a = 0(2.130)

Подпись: Figure 2.24 Induced inflow ratio at the rotor disk k, /Xh as a function of forward speed ratio fx/Xh for a = 0.

This result is shown in nondimensional form in Fig. 2.24. Notice that the induced ve­locity decreases quite quickly with increasing forward flight velocity. The asymptotic

approximation is obtained by letting д A, so that in high-speed forward flight Eq. 2.127 gives

ki kfo Cj

– —– > — or that = — (Glauert’s high-speed approximation), (2.131)

A/j Д 2д

which is denoted by the broken line in Fig. 2.24. For most purposes, this approximation is satisfactory for д/А/, > 2, which in practice is the case for д > 0.1.

Momentum Analysis in Forward Flight

Under forward flight conditions the rotor moves through the air with an edgewise component of velocity that is parallel to the plane of the rotor disk. Because helicopter rotors are required to produce both a lifting-force (to overcome the weight of the helicopter) and a propulsive force (to propel the helicopter forward), the rotor disk must be tilted forward at an AoA relative to the oncoming flow. Under these conditions the axisymmetry of the flow through the rotor is lost. Despite the inherently more complicated nature of the rotor flow in forward flight, the simple momentum theory can be extended to encompass these conditions on the basis of certain assumptions.

The following treatment of rotor performance in forward flight was first derived by Glauert (1928, 1935). An adaptation of Glauert’s flow model is shown in Fig. 2.23, where the analysis is performed with respect to an axis aligned with the rotor disk. The mass flow rate, m, through the actuator disk is now

/’■ч 1

*Z. l VI)

Propulsive force

Momentum Analysis in Forward Flight

Figure 2.23 Glauert’s flow model for the momentum analysis of a rotor in forward flight.

where U is the resultant velocity at the disk and is given by

U = yj(Voo cos a)2 + (Voo sin a + u, )2 = д/v^ + IVooVi sin a + vf. (2.108)

Glauert makes note that there is no rigor in this assumption for the resultant velocity other than it allows the forward flight theory to reduce to the correct limits in hovering and forward flight – a point also noted by Squire (1948). The application of the conservation of momentum in a direction normal to the disk gives

T = m(w + Vqo sin a) — m V^ sin a = mw (2.109)

and by the application of conservation of energy, we obtain

P = T(t’i + Vqo sin a) = – jrii{Voo sin a + w)2 — sin2 a

Подпись: (2.110)Подпись:= – m (IVqqW sin a + w2).

Using Eqs. 2.109 and 2.110 we get

2wvi + 2Vqo w sin a = 2VoqW sin a + w2

or simply w = 2Vi, which is the same result shown previously for the axial flight cases. Therefore,

T = 2mvi = 2pAUvi — 2pAviyjV^0 + 2VooVi sina + vf. (2.112)

Notice that for hovering flight, Voo = 0, so that Eq. 2.112 reduces to

T = 2 pAvf = 2 pAv2, (2.113)

which confirms that the forward flight result above reduces to the hover result (Eq. 2.14), as required. As forward flight speed increases such that Voo u;, then Eq. 2.112 reduces to

Подпись: (2.114)T = 2 pAviV0

which is called Glauert’s “high-speed” approximation. This latter result is exactly the lift on an elliptically loaded fixed-wing with a circular planform of radius R, and it should be expected that the results of the momentum theory analysis of the rotor in high-speed forward flight (excluding stall and reverse flow) should agree with fixed-wing theories (see Question 2.16). This is because the rotational speed of the rotor becomes a relatively smaller part of the forward flight velocity and the rotor must act more and more like a regular wing. This can be shown starting from the elliptical form of the spanwise circulation, Г, on the wing, that is,

гО) = Го^І – (|)2, (2.115)

where Го is the circulation at mid-span (y — 0). By using the transformation у = —R cos в this result can be written simply as

Подпись: (2.116)Г($) = Го sin 0.

The total lift on the wing can be obtained by integration using

T = L=pVxj r(y)dy = pVccR J rmsmede = pVOQr0R(~y

(2.117)

For an elliptically loaded wing of eliptical planform then the induced downwash u(- is constant across the span and is related to Го by

Подпись: (2.118)Го

Подпись: V,- =4 R

Rearranging and substituting in Eq. 2.117 gives the lift as

L = T = pVooR (|) (4Rvd = IpV^ViinR1) = 2pAv, Vx, (2.119)

which is exactly the result in Eq. 2.114. See also Ormiston (2004) for a more detailed discussion of such equivalent wing concepts and their limitations.

2.14.1 Induced Velocity in Forward Flight

In forward flight, it has been shown in Eq. 2.112 that the rotor thrust is given by T = 2m Vi = 2(pAU)Vi (2.120)

or

Подпись: (2.121)T = 2pAviy/(VOQ cos a)2 + (V^ sin a + v,-)2.

Recall from Eq. 2.113 that for hovering flight v = T/2pA, then the induced velocity in forward flight can be written as

Vh

«I = – г……………. , * (2.122)

v (Voo cos a)2 + (Voo sin a + Vi)2

The idea of a tip speed ratio or advance ratio, pt, is now used. By using the velocity parallel to the plane of the rotor, then we define gt = cos a/£2R. The inflow ratio is

A = (Vqo sin a + v^/ QR. This leads to the expression

Подпись: (2.123)Voo sin OC Vi

A =—————- 1—— = її tan a + A,-

Momentum Analysis in Forward Flight Подпись: (2.124)

QRQR

But, it is also known from the hover case that А/, = л/Ст/2, therefore,

Подпись: (2.125)Cj

A; = —L… . .

2y/ pi2 + A2

Finally, the solution for the inflow ratio, A, is

A = /rtanaH——– — ——- . (2.126)

27^ + 12

While analytic solutions to this equation can be found, in practice a simple numerical procedure is usually used to solve for A.

Autorotation

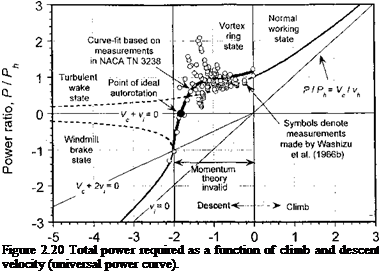
Notice that from the universal power curve in Fig. 2.20 there is actually a value of Vc/vh for which zero net power is required for the rotor [i. e., P — T(VC + Vi) = 0 or P/Ph = 0]. This condition is called ideal autorotation for vertical flight. For a given thrust it is a self-sustained operating state where the energy to drive the rotor comes from potential energy converted to kinetic energy from the relative descent velocity (which is upward relative to the rotor). The principle of autorotation can be seen in nature in the flight of sycamore or maple seeds, which spin rapidly as they slowly descend and are often carried on the wind for a considerable distance. In practice an autorotation is a maneuver that can be used to recover the helicopter to the ground in the event of an engine failure, transmission problems, or loss of the tail rotor. It requires that the pilot let the helicopter descend at a sufficiently high but controlled rate, where the energy to drive the rotor can be obtained by giving up potential energy (altitude) for energy taken from the relative upward flow through the rotor, thereby averting a ballistic fall.

On the basis of assuming the validity of Eq. 2.94, it will be apparent that the power curve crosses the ideal autorotation line Vc + и,- = 0 at

Autorotation(2.100)

which gives Vc/Vh = — 1.75 for an ideal rotor (к = 1). In practice, areal (actual) autorotation in axial flight occurs at a slightly higher rate than this, because in addition to induced losses at the rotor, there are also a proportion of profile losses to overcome. In a real autorotation we can write

Подпись: (2.101)

Autorotation

P=fcT(Vc + Vi)+P0=0.

Therefore, in a stable autorotation an energy balance must exist where the decrease in potential energy of the rotor TVC just balances the sum of the induced {kTvO and profile

:W3/2

Autorotation

which depends primarily on the disk loading. Also, using the definition of figure of merit (and assuming the induced and profile losses do not vary substantially from the hover values), then Johnson (1980) shows that

Подпись: Vc_ Autorotation Autorotation Подпись: (2.104)

Using Eq. 2.94 for the induced velocity with Eq. 2.103 gives the real autorotation condition:

The first term on the right-hand side of Eq. 2.104 will vary in magnitude from —0.04 to —0.09, depending on the rotor efficiency. Compared to the second term, the extra rate of descent required to overcome profile losses is relatively small. Therefore, on the basis of the foregoing, it is apparent that a real vertical autorotation will occur for values of Vc/vh between —1.85 and —1.9, that is, according to Fig. 2.20, with the rotor operating in the turbulent wake state. Under these autorotative conditions, the flow above the rotor is known from experimental tests to be relatively turbulent and to resemble that from behind a bluff body (see Question 2.15).

t+ ^ 4-^ г* _ ________ я,™,

it io iiu^i^auug tu тій uic ciictuvc uiag vucjlik;jlciu, £)eff, aciuig un me iuiaji 111 11110 nuw

state. We can equate the rotor thrust to its effective drag force using

Подпись: (2.105)T = w = pV^acDm.

Подпись: CDe{( Подпись: 4 (Vc/Vh)2 Подпись: 4 (-1.9)2 Подпись: 1.11. Подпись: (2.106)

Now in hover we know that T = 2pAv, so solving for Cotff for the autorotational condition Vc/vh ^ —1.9 gives

This is close to the drag coefficient of bluff bodies [see Hoemer (1965), where Co = 1.11 for a disk, Со = 1.2 for a closed hemisphere and Cd = 1-33 for an open hemisphere], which means that aerodynamically the rotor produces a resultant force equivalent to a parachute when in the autorotative state.

T 41 1 О •Р/Чіт/4 fll n 4- IT 74 4-1» rt 1-* ліїл nnfП1ТІГЧ*</4п^І /ЧМ П «VMl’nf Л M л *-l nf «</ч1 A – w Irtl T 7 Іч 4 ҐГІЧ

ii id luuiiu uiai wiui a ii^utupiu, auiuiuiauuiid uiudi иъ jj^iiuini^u ai i^iauv^ mgii

rates of descent. Using the result that Vh ^ 14.49^/TjA, where T/А is in lb/ft2, gives Vc & — 26.81 y/TjA ft s-1 for autorotation at sea level conditions, which for a representative disk loading of 10 lb ft-2 leads to a vertical rate of descent of about 5,000 ft min"1! However,, it is shown in later in Section 5.6 that with some additional forward speed, the power required at the rotor is considerably lower than in the hover case. Because autorotations involve an energy balance, the autorotative rate of descent can be reduced by about half with some forward airspeed, although in practice this is still a relatively high rate. Consequently, in an autorotation the proper recovery of the helicopter requires a high level of skill from the pilot. As the helicopter approaches the ground, the rotational kinetic energy
stored in the rotor can be used to arrest the rate of descent. To do this, the pilot will flare the helicopter using cyclic pitch (which helps to increase rotor rpm and stored rotational kinetic energy in the rotor) and then progressively increase the collective pitch so that the helicopter will settle onto the ground with minimum vertical and forward velocity. At this point, the rotational kinetic energy stored in the rotor will have been nearly exhausted and the rpm will have decayed to a low value. Clearly, the autorotative characteristics of the helicopter affect safety of flight and so autorotational capability becomes an important design issue. Autorotational flight performance is addressed further in Chapters 3, 5, and 6.

Vortex Ring State

The vortex ring state (VRS) is worthy of some special further discussion. This is because in the VRS the rotor can experience highly unsteady flow with regions of concurrent upward and downward velocities, and the flow can periodically break away from the rotor disk. This flow state appears to have been first recognized by de Bothezat (1919) and such flows have been visualized and measured in helicopter rotor experiments by Lock et al. (1926), Castles & Gray (1951), Drees & Hendal (1951), Washizu et al. (1966a, b), Azuma & Obata (1968), Moedersheim et al. (1994), and others. An example is shown in Fig. 2.22. Yaggy & Mort (1963) show that the unsteady airloads produced in VRS depend on rotor disk loading and blade twist, confirming the nonlinearity of the VRS problem. Betzina (2001) has conducted experiments in descending flight conditions with a relatively highly loaded rotor, representative of that used on a tilt-rotor. Some dramatic in-flight flow visualization on a helicopter rotor during vertical descent were performed by Brotherhood (1949). Glauert (1926a, b) and Nikolsky & Seckel (1949a, b) were some of the first to conduct a mathematical analysis of the problem. From a piloting perspective, entry into autorotative flight may require transition through the VRS, especially during flight at low airspeeds (see Section 5.7). Because of the flow unsteadiness at the rotor in VRS, it can lead

to significant blade flapping and a loss of rotor control. If the VRS occurs on the tail rotor, such as during sideways flight or hovering in a crosswind, then directional (yaw) control may be seriously impaired. This is a safety of flight issue – see Section 6.9.

Four Working States of the Rotor in Axial Flight

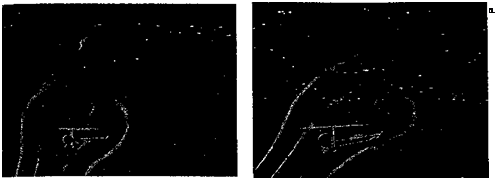
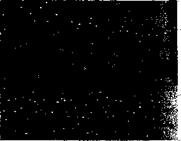
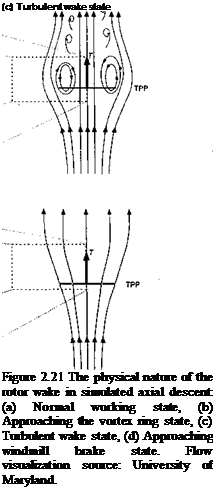
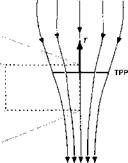
A description of the four working states of the rotor were first put forward by Lock and his colleagues (1926,1928) and are summarized by Glauert (1935) and Hafner (1946). Figures 2.18 and 2.20 show the lines representing Vc + u* = 0 and Vc + 2i>; = 0. Johnson (1980) shows that these lines are best used to help demarcate four axial operating states of the rotor. For points above the line Vc + vL = 0, the rotor is absorbing power supplied from the rotor shaft. Below this line, the rotor is extracting power from the relative airstream, which does work on the rotor shaft. To help understand the complicated physical nature of the rotor wake under these conditions, Fig. 2.21 shows flow visualization images of

Four Working States of the Rotor in Axial Flight

(a) Normal working state

Four Working States of the Rotor in Axial Flight


(b) Vortex ring state

Four Working States of the Rotor in Axial Flight


Four Working States of the Rotor in Axial Flight

Four Working States of the Rotor in Axial FlightFour Working States of the Rotor in Axial Flight

the wake at various descent velocities. Unlike some of the earlier work by Lock (1928) where smoke was used to visualize the gross flow structure, the individual blade tip vortices were rendered visible here by means of shadowgraphy, which is a density-gradient method (see Section 10.2.3). Because the flow is nominally axisymmetric, only one side of the rotor is shown for clarity.

1. Normal Working State: Figure 2.21(a) shows an image of the flow in the normal working state. Here, the tip vortices follow smooth helicoidal-like trajectories. The flow is highly periodic with a smooth slipstream boundary free of any significant disturbances. A schematic of the mean flow is also shown. The normal working state encompasses climb, with the limit being the hover condition.

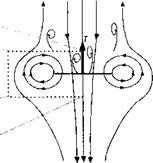
2. Vortex Ring State: For low rates of descent, the tip vortex filaments are convected closer to the plane of the rotor than for the hover case, but they also move radially outward away from the rotor. At higher descent rates, the tip vortices come very close to the rotor plane and considerable unsteadiness (aperiodicity) becomes apparent. This can be seen in Fig. 2.21(b) by the contortions in the tip vortex trajectories and the lack of any distinct slipstream boundary. This is close to the flow condition known as the vortex ring state, where the accumulation of tip vortices in the rotor plane begins to resemble a concentric set of vortex rings.

3. Turbulent Wake State: As the descent velocity increases further, the wake above the rotor becomes more turbulent and aperiodic and is representative of the flow conditions known as the turbulent wake state. This state is shown by Fig. 2.21(c) and represents the initial return to a smooth flow with a well-defined slipstream boundary. The flow is similar to that associated with a bluff body.

4. Windmill brake State: At even higher descent velocities, the wake is again observed to develop a more definite slipstream boundary that expands downstream (above) of the rotor. When in this state, the vortical wake structure is found to return to a more regular helical structure, as shown by Fig. 2.21(d). As previously described, this flow condition is known as the windmill brake state because the rotor extracts energy from the flow and brakes the flow velocity like a windmill.

Power Required in Axial Climbing and Descending Flight

Notice that because the climb and descent velocity changes the induced velocity at the rotor, the induced power will also be affected. In a climb or descent the power ratio is

Подпись: (2.97)P_ _ Vc + Vi _ Vc Vi_

Ph Vh Vh Vh’

The two terms on the right-hand side of the above equation are the work done to change the potential energy of the rotor (helicopter) and the work done on the air by the rotor, respectively. The latter induced loss appears as an increase in dynamic pressure and gain in kinetic energy of the rotor slipstream. Using Eq. 2.81 and substituting and rearranging gives

Climb velocity ratio, V / v

Подпись: Figure 2.20 Total power required as a function of climb and descent velocity (universal power curve).

c h

the power ratio for a climb as

P V / V 2 V

— = —2- + J ( —— } +1, which is vaiid for — > 0. (2.98)

Ph 2l)/j у 2vh) t>h

Подпись: Ph 2 Vh Подпись: — 1, which is valid for — < —2. Vh Подпись: (2.99)
Power Required in Axial Climbing and Descending Flight

In a descent, Eq. 2.91 is applicable, and substituting this into Eq. 2.97 and rearranging gives the power ratio as

Both results are shown in Fig. 2.20, which is usually called the universal power curve – a form first suggested by Lock (1947). This graph shows the total rotor power ratio, P/Ph, plotted versus the climb ratio, Vc/t^. The nonphysical solutions are also shown for reference. Notice that the power required to climb is always greater than the power required to hover. However, as the climb velocity increases the induced power becomes a progressively smaller percentage of the total power required to climb. It is also significant to note that in a descent, at least above a certain rate, the rotor extracts power from the air and uses less power than required to hover (i. e., the rotor now operates like a windmill – see Chapter 13 for more details of this operational state).

Region between Hover and Windmill State

In the region —2<Vc/vh<0 momentum theory is, strictly speaking, invalid because the flow can take on tw’o possible directions and a well-defined slipstream ceases to exist; this means that a control volume cannot be defined that encompasses only the physical limits of the rotor disk. However, the velocity curve can still be defined empirically, albeit only approximately, on the basis of flight tests or other experiments with rotors. Unfortunately descending flight accentuates interactions of the tip vortices with other blades and so the flow becomes rather unsteady and turbulent, and experimental measurements of rotor thrust and power are difficult to make. Also, the average induced velocity cannot be measured directly. Instead, it is obtained indirectly from the measured rotor power and thrust – see Gessow (1948, 1954), Brotherhood (1949), and Washizu et al. (1966b).

The measured rotor power can be written in the assumed form as

Pmeas = T(VC + V{) + P0, (2.92)

where P0 is the profile power and where Df is recognized as only an averaged value of the induced velocity through the disk. Using the result that Ph = Tvh we get

Ve T" Vi ______ Pjneas Po _________ ^meas Pq ___________ (^meas Po)+J2pA /n

vh ~ ~Ph ” T*fT/2pA ~ ‘ KL’yS)

Therefore, in addition to the measured rotor power Pmeas, to obtain an estimate for the averaged induced velocity ratio it is necessary to know the rotor profile power. As shown previously by means of Eq. 2.42, one simple estimate for the profile power coefficient of a rotor with rectangular blades is CPq = crC^/8, where is the mean (average) drag coefficient of the airfoil sections comprising the rotor and a is the rotor solidity.

Because of the high levels of turbulence near the rotor in this operating state, the derived measurements of the average induced velocity contain a relatively large amount of scatter. The smooth curve fit shown in Fig. 2.18 is taken from Gessow (1954) and is a composite
of flight tests and wind tunnel measurements made by Lock et al. (1926), Brotherhood (1949), and Drees & Hendal (1951). Note, however, that the curve follows the nonphysical branch of the induced velocity curve derived on the basis of momentum theory up to about Vcfvh ~ —1.5, after which it drops off precipitously and joins the branch of the curve defined on the basis of the momentum theory result in a descent. The higher values of measured power in hover and at low rates of descent are a result of higher induced power losses, which, as explained previously, are not predicted directly by the simple momentum theory.

Подпись: Vi_ Vh Region between Hover and Windmill State Подпись: (2.94)

Because the nature of the induced velocity curve is not analytically predictable in the range —2 < Vc/vh < 0, the experimental estimates can be used to find a “best-fit” approx­imation for vt at any rate of descent. Various authors, including Young (1978) and Johnson (1980), suggest a linear approximation to the measured curve. Following Young (1978), one approximation is

Подпись: Vi Vh Region between Hover and Windmill State Подпись: (2.95)

where к is the measured induced power factor in hover. A better approximation to the measured curve is

Region between Hover and Windmill State Подпись: (2.96)
Region between Hover and Windmill State

A continuous approximation to the measured induced velocity curve is the quartic

with k = —1.125, &2 = —1.372, k3 = —1.718, and = —0.655, which is valid for the full range —2 < Vc/vh < 0.