Category Principles of Helicopter Aerodynamics Second Edition

BEMT in Climbing Flight

Подпись: X(r, Xc) Подпись: crCia _ ЛЛ2 Q-Q _ (aCl« 16F 2 ) + 8F 16F Подпись: (3.131)
BEMT in Climbing Flight

The BEMT may be used to estimate the blade airloads during vertically climbing flight. This problem is of some interest because of the changes in the spanwise distribution in lift and so forth that take place. In climbing flight the BEMT requires the use of the Eq. 3.61, that is,

which in this case has been modified with the use of the Prandtl tip-loss factor. The numerical solution proceeds as before for the hovering rotor. However, notice that a solution for the blade pitch must also be obtained for each climb rate because thrust also equals weight in the climb (but neglecting airframe download and vertical-drag effects).

BEMT in Climbing Flight

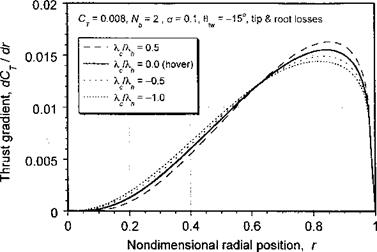
Figure 3.21 BEMT predictions of spanwise thrust for a two-bladed rotor with linear blade twist in vertically climbing and descending flight.

Representative results are shown in Fig. 3.21 for both climbing and descending conditions at the same Ct compared to the hover result. The results show how the spanwise distribution of thrust becomes more heavily biased outboard in climbing flight, with the opposite effect in descending flight. This also changes the distributions of lift coefficient, torque, and so on. While the validity of the BEMT does not strictly extend to descending flight when moving from hover, for the same reasons that the simple momentum theory does not apply here, the solution has credibility as long as the descent velocities are small.

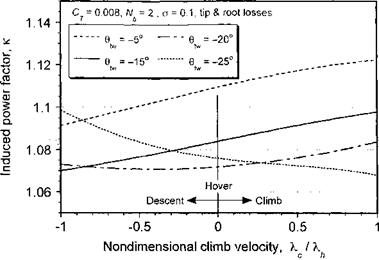
Because the climb (or descent) affects the spanwise distribution of airloads it is of interest to examine the changes in the induced power factor that take place. Normally it is acceptable to assume that к does not change with flight condition, but much has to do with the actual rotor design. Representative results are shown in Fig. 3.22 for the same rotor in climbing and descending flight but with different amounts of blade twist. The results are obtained by finding the induced power from the BEMT normalized by the induced power from the simple momentum theory. Clearly the value of к may increase or decrease with climb velocity, depending on the blade twist.

For a rotor that has close to ideal blade twist (which in this case is #tw ~ —20° at the defined operating condition of Cj — 0.008) either climbing or descending flight changes the spanwise distribution of airloads further from the ideal and the values of к increase. For a blade with less than near optimum twist, notice from the results in Fig. 3.22 how к actually decreases as the rotor descends compared to a rotor with large amounts of blade twist (such as a tilt-rotor). This has particularly important implications for the design of autogiro rotors (see Chapter 12); because the flow is upward through the rotor in autorotation little or no twist will give better efficiency (i. e., lower autorotative rate of descent, shallower aft disk tilt in level flight, and overall better lift-to-drag ratio for the rotor). For blades with large amounts of twist, it is apparent that к improves somewhat in a climb but increases more quickly in a descent. Overall, however, the results show that the variations of к with climb or descent velocity are fairly modest and for many forms of performance analyses it will be acceptable to assume that к =? constant.

BEMT in Climbing Flight

Figure 3.22 BEMT predictions of induced power factor in vertically climbing and de­scending flight.

Blade Design and Figure of Merit

On the basis of the predictions of profile power from the blade element analysis, the figure of merit can be written as

FM — ■ Cpid-eal , (3.129)

C pt + CPo

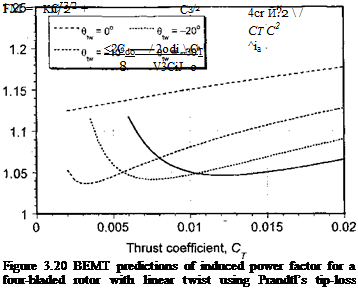
where Cpidcal = С]!21fl and Cp can be written in terms of the induced power factor, к as Cp = агС^2/л/2. From the numerical approach to the BEMT theory, and incorporating Prandtl’s tip-loss function, we can readily obtain the results for Cp, Cp0, к, and FM as a function of collective pitch or Cp, and the results can then be compared for different blade twist rates and/or planforms. It has been shown previously that blade twist primarily affects the induced power. Results showing the effects of blade twist on the induced power factor, к versus rotor thrust coefficient are given in Fig. 3.20. The values of к have been computed for a four-bladed rotor. Notice that there are significant reductions in induced power (and gains in FM) to be made by the addition of nose-down blade twist. Up to —20° of blade twist is considered optimal, with further increases in nose-down twist rate giving only minor returns within the operational values of Cj for a helicopter. The use of high blade twist rates is nonoptimal for forward flight because such blades tend to generate lower lift on the advancing blade compared to a design with less twist – see discussion in Section 6.4.5.

Blade Design and Figure of Merit Подпись: (3.130)

The profile power also affects the FM. Using the higher-order drag variation, we have for the rotor with ideally twisted blades that

Notice that the profile power contribution to the FM is affected by the rotor solidity, cr. Therefore, it is apparent that to maximize the figure of merit the profile part of the power must be kept as low as possible, which suggests a low value of solidity. The increasing drag of the blades at higher values of Ct means the onset of stall must be delayed to high angles of attack, which means maintaining the blade loading coefficient CT/o to lower values. This requires the use of sufficient rotor solidity to maintain sectional C/’s below stall also with sufficient margins in overall Cj /or for normal flight maneuvers without rotor stall.

Prandtl’s Tip-Loss Function

The idea of a tip-loss factor, В, has already been introduced. Instead of assuming a value for В it is possible to compute tip-loss effects on the basis of a method devised by Prandtl – see Betz (1919). Prandtl provided a solution to the problem of the loss of lift near the tips resulting from the induced effects associated with a finite number of blades. This theory contains all the elements of a model that was developed later by Goldstein (1929) and Lock (1930) but has several simplifications that make it attractive for helicopter rotor analysis. Prandtl replaced the curved helical vortex sheets of the rotor wake by a series of 2-D vortex sheets, the assumption here being that the radius of curvature at the blade tips is large. This is a satisfactory assumption for helicopter rotors but is less so for propellers.

Prandtl’s final result can be expressed in terms of a correction factor, F, where

(3.120)

where / is given in terms of the number of blades and the radial position of the blade element, r, by

Подпись: / =Prandtl’s Tip-Loss Function(3.121)

and ф is the induced inflow angle (= X(r)/r).

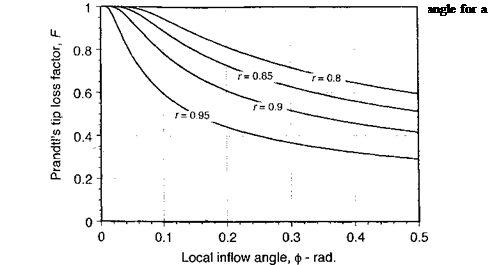
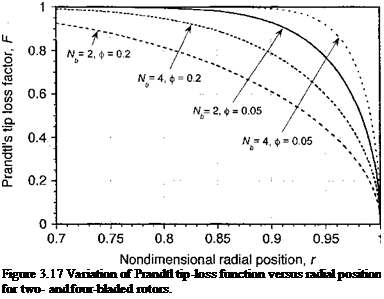
Prandtl’s F function is plotted in Fig. 3.16 versus the local inflow angle, <p, for a two – bladed rotor. The basic effect of the F function is to increase the induced velocity over the tip region and reduce the lift generated there. The Prandtl function is, therefore, sometimes referred to as a “circulation loss” function. Prandtl’s F function is plotted versus the radial position of the blade element in Fig. 3.17 for two – and four-bladed rotors, and for different values of the inflow angle, ф. The gradual reduction in the function as the tip is approached represents the basic induced effects of the vortex wake. Notice that F is a function of the number of blades and always has lower values for rotors with fewer blades. This is because the total bound circulation is distributed over fewer blades and the induced effects in the rotor wake are higher. For the limiting case where Nb —> oo, which approximates an actuator disk, the circulation is distributed uniformly over the disk and F —> 1.

In the application of the Prandtl tip-loss method, the function F can also be interpreted as a reduction factor applied to the change in fluid velocity as it passes through the control volume. The tip-loss effect can be incorporated into the BEMT as follows. For hovering flight Eq. 3.44 is now modified by the use of the Prandtl factor, F, to give

Подпись: (3.122)

Prandtl’s Tip-Loss Function

dCr = 4FX2r dr.

Подпись: Figure 3.17 Variation of Prandtl tip-loss function versus radial position for two- and four-bladed rotors.

Also, from the BET it has been shown previously that

dCT = {Or2 – kr) dr. (3.123)

Equating the incremental thrust coefficients from the momentum and blade element theories gives

(Qr2 – kr) = AFk2r (3.124)

or

9 /oCi oCi

1 + (lF ) * “ 1Г*Г = °- <ЗЛ25)

Prandtl’s Tip-Loss Function Prandtl’s Tip-Loss Function Подпись: (3.126)

This quadratic has the solution

Because F is a function of k, this equation cannot be solved immediately because к is initially unknown. Therefore, it is solved iteratively by first calculating к using F = 1 (corresponding to an infinite number of blades) and then finding F from Eq. 3.120 and recalculating к from the numerical solution to Eq. 3.126. Convergence is rapid and is obtained in three or four iterations.

The resulting effect of the application of PrandtTs F function on the blade-thrust distri­bution is shown in Fig. 3.18 for an untwisted blade. These comparisons have been performed at the same value of thrust obtained without using the tip-loss effect. Notice that the pri­mary effect of the tip loss is to reduce the thrust production over the immediate tip region. This loss of thrust has to be compensated by a slightly greater blade pitch, which increases the angles of attack further inboard to produce the same total rotor thrust. Generally it is found that the use of a larger, number of blades tends to improve the efficiency of the

rotor (increases the figure of merit) for a given solidity and disk loading because the in­duced tip-loss effects tend to decrease with increasing number of blades (see Questions 3.2 and 3.3).

The ideas of tip loss can also be extended to model the loss of lift at the root of the blade. In this case the value of / in Eq. 3.120 becomes

Prandtl’s Tip-Loss Function(3.127)

The tip and root losses can be combined into a single function using

Подпись:/ = /root /tip,

where /root is given by Eq. 3.127 and /tip by Eq. 3.121. Generally the effects of including root loss effects are small on the calculation of total rotor thrust and power because the inboard parts of the blade operate at relatively low dynamic pressures. However, the effects are usually more apparent when examining the spanwise distribution of airloads in coefficient form.

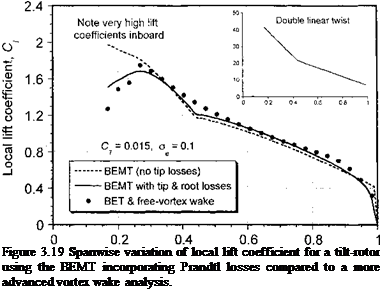
An example using the BEMT with both tip and root losses is shown in Fig. 3.19 for the case of a tilt-rotor operating in the hover mode. Tilt-rotor blades have large amounts of twist, which are more optimal for forward flight performance in propeller mode compared to helicopter mode. The results in this case show how the inboard sections of this rotor operate at relatively high lift coefficients compared to a typical helicopter (see the results in Fig. 3.8) and so more accurate nonlinear aerodynamic modeling here is important in this case, despite the lower dynamic pressures. The BEMT results are compared in Fig. 3.19 with the results of a more advanced blade element theory (BET) combined with a free-vortex model of the rotor wake (see Section 10.7.6). Clearly the use of the BEMT by itself gives reasonable agreement with the BET results, but the introduction of the Prandtl tip – and root-loss effects into the BEMT clearly gives much better results. (The results are all compared at the same total Cj ) Remember that the purpose of the Prandtl tip-loss function is to approximately model the high induced losses produced by the trailing vorticity generated from the tip and

Nondimensional radial position, r

Подпись: Figure 3.19 Spanwise variation of local lift coefficient for a tilt-rotor using the BEMT incorporating Prandtl losses compared to a more advanced vortex wake analysis.

root side edges of the blade, flow physics that are included in the more advanced vortex wake model. Overall the results in Fig. 3.19 show that the BEMT is an effective tool for at least the preliminary analysis of the spanwise distribution of airloads, especially bearing in mind the negligible computational cost of this type of method.

Power Estimates for the Rotor

For a real rotor, the nonuniformity of A over the disk means that the induced power must be calculated by numerically integrating the equation

pr= N

CPi= XdCT «УХдСгп (3.113)

Jr=0 n=l

using the actual induced velocity distribution computed using the BEMT. This equation also allows the calculation of the induced power factor, к, for different twist distributions, that is,

4/2/V2

-5 0 5 10

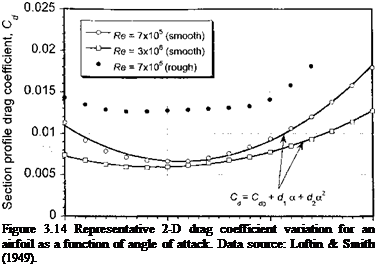
Подпись: Figure 3.14 Representative 2-D drag coefficient variation for an airfoil as a function of angle of attack. Data source: Loftin & Smith (1949).

Section angle of attack (AoA), a – deg.

For a more accurate calculation of the rotor profile power, we must consider the variation in sectional drag coefficient with blade section AoA – see Bailey & Gustafson (1944). For most airfoils the sectional drag coefficient below stall2 can be approximated by

Cd = Cdo + da + d2a2, (3.115)

as shown in Fig. 3.14. Clearly, the coefficients of this expression are also a function of airfoil section, Mach number, Reynolds number, and surface finish, and the behavior cannot easily be generalized. In practice, it is found sufficiently accurate to use 2-D airfoil measurements for the Reynolds and Mach numbers corresponding to those at 75% radius on the rotor. Yet, caution should be exercised when analyzing subscale rotors. If measurements for the airfoil in question are not available at low Reynolds number, then catalogs of airfoil data such as those compiled by Althaus (1972) and Miley (1982) are often useful in estimating the anticipated effects.

Cjr[15] dr.

Power Estimates for the Rotor
Подпись: (3.116)

The profile part of the rotor power is given by

Cp° = Ї L ^ + d'(e – ф) + Лг(в – ^[16]]r3 dr

r3 dr.

Подпись: 2/0
Подпись: Cdo + d ( 0 — —
Подпись: )+<fe(e-£)
Подпись: (3.117)

Proceeding on the basis that Eq. 3.115 is valid, then substituting gives

By including the higher-order approximation for the airfoil drag, improvements in rotor power prediction at higher values of Cj are usually obtained. Results from the experiments of Knight & Hefner (1937) are shown again in Fig. 3.15, but with the modified drag expression. Notice the better agreement than that shown previously in Fig. 3.3 when a constant drag coefficient was assumed, although power is perhaps now somewhat overpredicted for higher solidities and shows the limitations of this approximate approach.

The Optimum Hovering Rotor

Minimum induced power requires uniform inflow over the disk. The corresponding condition for minimum profile power requires that each blade station operate at the AoA

for maximum Ci/Cd (i. e., at a, = oq as shown in Fig. 3.9). For minimum induced power then 9 — 9щ/г, and if each element of the blade is to operate at aq then

The Optimum Hovering Rotor(3.94)

Also, it has been shown previously from the BEMT that for an annulus of the disk

Подпись:dCj — 4A.2r dr.

The Optimum Hovering Rotor Подпись: (3.96)
The Optimum Hovering Rotor

Equating Eqs. 3.94 and 3.95 and solving for A gives

which is constant over the disk, as required. If it is assumed that oq is the same for all the airfoils along the blade span and independent of Reynolds number and Mach number, then for uniform inflow the product or in Eq. 3.96 must be a constant, that is,

Подпись: constant,The Optimum Hovering Rotor(3.97)

Подпись: r r Подпись: (3.98) Подпись: c(r) = — and cr(r) = ——

which requires a local chord distribution over the blade to be given by

Therefore, for each section of the blade to operate at the optimum lift-to-drag ratio, the local blade solidity, o{r) or blade chord, c{r) must vary hyperbolically with span, as shown by Fig. 3.11. Clearly this distribution is physically unrealizable but can be adequately approximated by a linear taper over the outer part of the blade. Because of the hub and root cut-out, the chord variation as r —> 0 does not matter anyway. Furthermore, as seen from Fig. 3.9, operating the airfoils at angles of attack that are few degrees less or greater than «і does not result in a serious degradation of C//C^. Therefore, the use of some planform taper, while not exactly hyperbolic or applied over the whole blade, will generally always have a beneficial effect on hovering rotor performance.

Подпись: □
The Optimum Hovering Rotor

Optimum taper

Linear taper approximation
(same tip chord)

Figure 3.11 Radial distribution of blade chord for an optimum rotor and a linear approximation.

0. Подпись: 1The Optimum Hovering Rotor
2 0.4 0.6 0.8

Nondimensional radial position, г

Figure 3.12 Effect of blade taper on the lift coefficient distribution over a blade with constant twist.

The Optimum Hovering Rotor

The Optimum Hovering Rotor

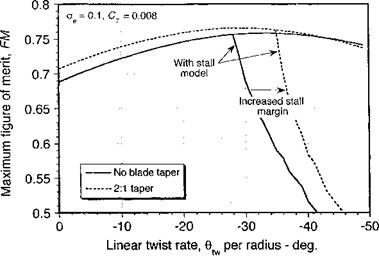
Figure 3.13 Effect of blade twist and taper on rotor figure of merit.


thrust-weighted solidity. For a linearly tapered blade, this means that the solidity at 75% blade radius is the same in all cases – see Section 3.4. Without taper the lift coefficients at the root of the blade are relatively high and cannot operate at the best Ci/Cd ratio for the airfoil section so Cp0 would be higher than otherwise possible. As СУ is increased, the rotor performance will be limited by the onset of stall at the blade root. From Fig. 3.12 we see that with the introduction of a moderate amount of taper the values of Ci become much more uniform, with the values of С/ being significantly reduced at the blade root along with a mild increase in Q at the tip. This reduces the profile power component, and so the rotor can be operated at the same thrust but with an improved figure of merit.

The Optimum Hovering Rotor

The point is expounded further by the results shown in Fig. 3.13, where the figure of merit is plotted versus the twist rate for a rotor with rectangular blades and one with linearly tapered blades. A mild amount of taper clearly gives a notable increase in FM. In either case, the rotor ultimately becomes limited by the onset of stall, but the use of blade taper clearly allows the rotor to operate with a higher stall margin. This also allows a higher possible collective pitch, a higher attainable rotor thrust, and better overall hovering efficiency.

so that

oCl. QnR1

Hip

2Nb

The Optimum Hovering Rotor

(3.106)


Г(г) =


confirming that ideal twist gives uniform inflow, a linear distribution of lift (thrust) and a constant “bound” circulation over the blade.

A link can also be made between the momentum theory of lift and the vortex theory (considered in Chapter 10). With a uniform circulation along the blade span, Helmholtz’s theorem requires a, single vortex of the same strength to trail from the blade tips. This vortex strength can be related to the blade loading as follows. The lift per unit span along the blade is

Подпись: (3.107) (3.108) (3.109) (3.110) (3.111) dL — /0(£1у)Г dy.

Because Г is constant, then the lift on one blade is

L = par f у dy — pQFRz/2.

Jo

The total rotor thrust is T = A^L, and in coefficient form we have С

T 2(ttR2)Q‘

Using the result for the solidity that a — Nbc/nR, we get CT _ Г о 2 QcR

Г = 2£2Rc 1 ^ ) ,

or nondimensionally that


Сг a


The Optimum Hovering Rotor

(3.112)


Remember that this result is for an “ideal” rotor operating in hover. However, the result provides a simple connection between the rotor operating state and the strength (circulation) of the tip vortex filaments that are trailed into the rotor wake – see Chapter 10.


The Optimum Hovering Rotor

Effects of Swirl Velocity

Before considering this optimum rotor, however, it is important to consider the significance of the wake swirl in determining the aerodynamic environment at the blade elements. For a helicopter the wake swirl is a function of rotor operating state (mainly thrust, as discussed on page 69), but swirl is generally small and practice has shown that for a helicopter the swirl can be ignored without any significant effects on predicted blade loads or rotor performance. The most complete and comprehensive exposition of the swirl effects on rotor performance is given by Glauert (1935), but Nikolsky (1951) also gives a good summary. In the generalized differential momentum theory, the thrust and torque on an annulus of the rotor in the hover state are, respectively,

dT=Anpvfydy and dQt — АжpviQ. a’yi dy, (3.87)

where a’ is known as the wake rotational interference factor. In terms of a’ the work done by the rotor over the annulus is

(l-a’)QdQi =vidT. (3.88)

In the case were the wake swirl is ignored (i. e., a’ = 0), then these results reduce to the two equations used previously, i. e.,

dT = 4лгpvfy dy and QdQi = dPt = 4npv? y dy.

In nondimensional form these are also the same as those used before, that is,

Effects of Swirl Velocity

Figure 3.10 Representative distribution of swirl in the wake of a hovering rotor. Data source: LDV measurements from the University of Maryland.


When the wake swirl is included, then the equations become

Подпись: (3.91)dCj — 4kfr dr

and

d. CPi = 4AfaV3 dr (3.92)

and with the additional equation

(1 – a’)a’r2 = к]. (3.93)

These are the equations of Glauert’s generalized differential momentum theory.

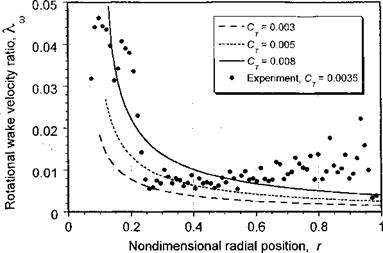
To illustrate the relative magnitude of the induced swirl for a helicopter, it is convenient to assume that A, is distributed uniformly as in the ideal case, in which case Eq. 3.93 can be solved for a’. Results are shown in Fig. 3.10 for several representative rotor-thrust coeffi­cients. The nondimensional swirl velocity Xw is simply a’r. Time-averaged measurements made in the wake of a two-bladed hovering rotor are also shown and, while there is signif­icant scatter because of the low velocities being measured, the magnitude and distribution are in general agreement with the theory. Notice that the swirl values are small over a large part of the blade (less than 2% of tip speed) but increase more rapidly toward the blade root. This region, however, is of little importance aerodynamically. There is some increase in swirl velocity near the blade tip, which is part of the signature of the tip vortex. Therefore, as a contributor to the resultant velocity and AoA at the blade element it is clear that the effects of the swirl in defining the aerodynamic environment for a helicopter rotor is small, but not completely negligible.

Distributions of Inflow and Airloads

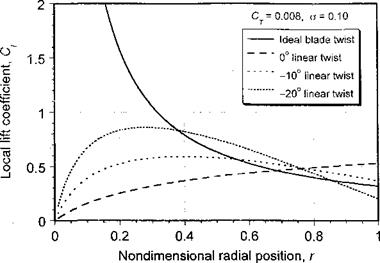
Using the numerical implementation of the BEMT, the distribution of inflow and lift on a blade with any distribution of twist (and planform) can be readily determined. Representative results for X and dCr /dr are shown in Figs. 3.7(a) and (b), respectively, for a rectangular blade with different linear twist rates and at a constant value of thrust. For reference purposes, the distribution corresponding to ideal twist is also shown, which gives a uniform inflow and a linear variation of lift from the root to the tip. Notice that the lift on the untwisted blade is parabolic. With moderate values of twist, the lift distribution becomes more linear, with an off-loading at the tip and a greater loading being produced inboard, and more closely resembles that obtained in the ideal blade twist case. For very high values of blade twist exceeding 20°, the tip is off-loaded to the point that the inflow becomes more nonuniform again and the rotor thereby becomes aerodynamically less efficient.

Подпись: Q(rn) = Cu Distributions of Inflow and Airloads Подпись: (3.79)

The corresponding local lift coefficient distribution over the blade is found using

with representative results being shown in Fig. 3.8 for different amounts of linear twist. For a rotor with constant blade chord and the ideal twist distribution 0 = 0tiP/r the local lift

Distributions of Inflow and Airloads

Figure 3.8 BEMT predictions of lift coefficient distribution on a rotor blade for different linear twist rates. Results are compared at a constant total rotor thrust.


As previously shown, besides uniform inflow, the ideal twist distribution also gives uni­form disk loading. For the ideal rotor (with constant chord, ideal twist, uniform inflow) integration along the blade leads to

о Сі, 4 a Ci

Ct = -^- (% ~ A.) = (3.83)

Distributions of Inflow and Airloads Distributions of Inflow and Airloads

Remember that simple momentum theory gives a value of X = «JCj/2 in hover. Therefore, the blade pitch angle is 6>tjp = oftiP + A so that

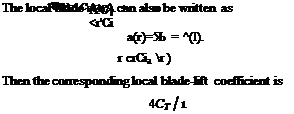
which is plotted in Fig. 3.8. This result shows that for a rectangular blade with ideal twist (minimum possible induced power), the lift coefficients become very large at the root end of the blade; thus drag coefficients will increase and rotor performance will ultimately be limited by the onset of stall. Besides the fact that Q (and Cd) increases rapidly when moving inboard from the tip, there can only be one blade station on the blade operating at its best lift-to-drag ratio. Therefore, anything less than the best С/ / Cd must always result in a higher profile power consumption from the rotor than would otherwise be possible.

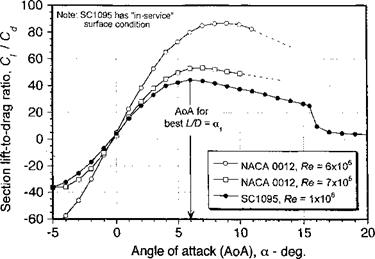
This effect can be seen more clearly if representative lift-to-drag ratios of 2-D airfoils are examined, as shown in Fig. 3.9. In this case, the best Q/Q of the airfoil sections occurs at an AoA between 5 and 10° (denoted as arj), and this operating condition should be the design goal at all blade stations to achieve minimum profile power. The AoA for the

Distributions of Inflow and Airloads

Figure 3.9 Representative lift-to-drag ratio of a 2-D airfoil at low angles of attack and low Mach numbers. Data source: Loftin & Smith (1949) and Leishman (1996).

best Сі/Cd is a function of Mach number as well as Reynolds number and surface finish (roughness) – see Chapter 7. A hovering rotor that is designed to minimize both the induced power and the profile power is called an optimum hovering rotor — see Section 3.3.7.

Ideal Twist

Gessow (1948) showed that if Or = constant = 0tiP there is a special solution to the inflow equation in Eq. 3.62 that gives uniform inflow, that is,

0(r) = (3.63)

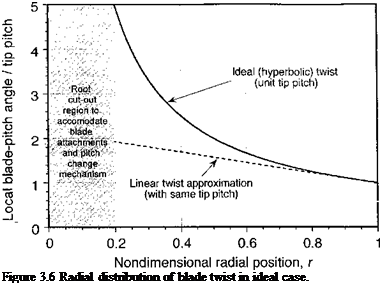
r

This twist distribution is called ideal twist and is shown in Fig. 3.6. This solution lays down the goal for a rotor blade design because the uniform inflow case must always correspond to the minimum induced power for the rotor when operating in hover or in axial climb. Unfortunately, the hyperbolic form of pitch angle or twist distribution given by Eq. 3.63 is physically unrealizable as r —0. However, because of the hub and root cutout, in a practical sense the blade pitch variation here does not matter anyway. Figure 3.6 shows that

Подпись: Figure 3.6 Radial distribution of blade twist in ideal case.

a linear twist distribution is reasonably close to the ideal case over the outer part of the blade.

A careful examination of airplane propellers will show that they are highly twisted and, in fact, closely conform to the ideal blade twist given by Eq. 3.63. For helicopter rotors, such high amounts of twist over the blade span is nonoptimum for the entire flight envelope. This is because the rotor must also operate in forward flight, and high values of blade twist can lead to less efficient lift and propulsion generation from the advancing side of the disk at high advance ratios. Nevertheless, because helicopters spend a substantial part of operating time in hover and low speed forward flight, there are considerable performance benefits to be realized by incorporating some blade twist.

Ideal Twist Подпись: (3.64)

With ideal twist the performance of the rotor can now be recalculated. If 0r = constant = #tjp, then

Using Eq. 3.13 gives X = гф = 0tip = constant, and so the preceding equation can also be written as

Подпись: (3.65)~ _ aC^ (a j __________ aCi„

Cj — д (ytip Фйр) — ^ ^tip-

Ideal Twist Ideal Twist

Using Eqs. 3.61 and 3.63 gives

The first term in either of the previous equations can be thought of as a mean blade pitch to produce thrust, and the second term is an additional blade-pitch angle that is required to compensate for the induced inflow produced by the generation of that thrust.

One can also prove that the ideal twist distribution gives a special result, namely a linear (triangular) lift distribution over the blade, which is consistent with uniform disk loading. Recall that the incremental thrust distribution is given by

Ideal Twist(3.68)

Because A is a constant, the thrust distribution on the blade varies in proportion to r (i. e., it is a linear distribution). Another way of writing the preceding equation is just

Подпись: о (3.69)

Ideal Twist Подпись: (3.70)

Therefore, the total thrust on the rotor with ideal blade twist is

3.3.4 BEMT: Numerical Solution

In most practical applications the equations of the BEMT are solved numerically. This allows the maximum flexibility to incorporate arbitrary radial variations in twist, planform, and so on. In the numerical approach, the blade must be discretized into a series of small elements of span A r. For hovering flight, the inflow is now obtained using the discretized equation

Ideal Twist(3.71)

where n — 1, A is the element location (station) and rn and в{гп) are the radius and pitch angle at the mid-span of each of the N stations, respectively.[13] For climbing flight then Eq. 3.61 must be solved. When the inflow is determined using Eq. 3.71, the incremental thrust at each segment can be found using

Подпись: (3.72)ACT„ = ^^(0(rn) r[14]n – A(r„) rn) Ar.

The total thrust on the rotor is then obtained by numerically integrating over the blade. The simplest approach is to use the rectangle rule, which is equivalent to considering the inflow and thrust to be constant over each segment. In this case

N

(3.73)

n=1

which will be adequate for most purposes unless only a few stations are used. The corre­sponding induced torque (or power) can be obtained using

Подпись: N (3.74)

It is normally desirable to compare results for different rotors at the same value of Ct – Therefore, for rotors with different twist or planforms, the blade (collective) pitch, 9q, required to obtain the required value of thrust coefficient, say Ct, must be obtained iteratively starting from an assumed value for во. For this, we can use as a basis the simple relationships found previously between the blade pitch and Cj. For example, for a blade with linear twist and

or rearranging and solving for во gives

6СГ З 3 CT aC, 40tw+2V 2

l(X

Ideal Twist Подпись: 6(Crreq-C^) 3V2 orq, 4 Подпись: (3.77)
Ideal Twist

Therefore, one simple iterative scheme based on a bisection method of correcting the col­lective pitch from iteration j to j + 1 is

Подпись: 0<O) ' и Подпись: 6 Ст 3 — 0tw crCia 4  Подпись: (3.78)

starting from the initial value

Using this approach, the collective pitch is found to converge rapidly to provide the required value of Ct for any arbitrary rotor geometry, typically within two to four iterations.

Radial Inflow Equation

Although it is clear from the foregoing that if the inflow can be determined, con­siderable information about the rotor performance can be obtained. The issue is now to devise an approach that can solve for the inflow directly, without making any assumptions as to its magnitude or form. One solution can be obtained using a hybrid blade element and momentum approach using the principles of the equivalence between the circulation theory of lift the momentum theory of lift. From the BET it has been shown in Eq. 3.15 that the incremental thrust produced on an annulus of the disk is

dCT = vQr2 dr = ^y^ {Or2 – kr) dr. (3.57)

Equating the incremental thrust coefficients from the momentum and blade element theories (using Eqs. 3.45 and 3.57) we find that

^y^ (6r2 – kr) =4k(k- kc) r, (3.58)

which gives

а С, о Cl о

—~^0r——— —k = k2- kck (3.59)

Radial Inflow Equation Подпись: (3.60)

or

This quadratic equation in k has the solution

Подпись: (3.61)

Radial Inflow Equation Подпись: (3.62)

A(r, kc) =

Radial Inflow Equation

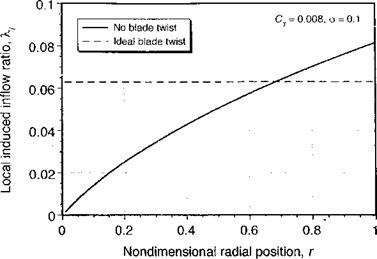
Figure 3.5 Distribution of inflow for an ideally twisted blade as predicted by the BEMT compared to an untwisted blade.

Equation 3.62 allows for a solution of the inflow as a function of radius for any given blade pitch, blade twist distribution, planform (chord distribution), and airfoil section (through the effect of lift-curve-slope Cia and zero-lift angle «о via в). When the inflow is obtained, the rotor thrust and induced power may then be found by integration across the rotor disk usinv Eos. 3.48 and 3.49.

—- G7 – A – – – – – — _ – – _ .

For an untwisted blade of constant chord and uniform airfoil section, the distribution of inflow as predicted by Eq. 3.62 is shown in Fig. 3.5, and is compared with the uniform inflow at the same thrust coefficient. For the untwisted blade the distribution of inflow is concentrated toward its tips (i. e., n — 1 in Eq. 3.50). Clearly, the combination of blade geometric parameters for the results shown in Fig. 3.5 is nonideal because as shown by Eq. 3.56 the induced power will be higher than the minimum possible with uniform inflow (n = 0). We must now proceed to examine how the blade geometric properties could be adjusted to give a more uniform inflow and, therefore, to minimize the induced power requirements for the rotor.

Assumed Radial Distributions of Inflow on the Blades

Assumed Radial Distributions of Inflow on the Blades Assumed Radial Distributions of Inflow on the Blades

The foregoing results are valid for any radial form of induced velocity distribution across the disk. Assume for illustrative purposes that the inflow can be prescribed and expressed in the simple form

and substituting the result from Eq. 3.52 gives

Подпись: (3.54)_ 2(n + 1 У’2С^2 Pi ~ (3n + 2)л/2

Assumed Radial Distributions of Inflow on the Blades Assumed Radial Distributions of Inflow on the Blades

It has been shown previously that the induced power can be written as

Notice that for n = 0 (uniform inflow) then к = 1 (ideal case). For n > 0, then /с > 1, and as the value of n increases к increases as the inflow becomes more heavily biased toward – the blade tips.