Category AERODYNAMICS

SAMPLE SOLUTIONS WITH PANEL CODES

Panel methods have the advantage of modeling the flow over complex three-dimensional configurations. However, the first thing to remember is that the method is based on potential flow solutions and therefore its “forte” is in solving attached flow fields. In the case of such attached flow fields the calculated pressure distribution and the lift will be close to the experimental results but for the drag force only the lift-induced drag portion is provided by the potential flow solution and an estimation of the viscous drag is required. For flows with considerable areas of flow separations the method usually can point toward areas of large pressure gradients that cause the flow separations but the computed pressure distributions will be wrong. The following examples will show some of the cases where such methods can provide useful engineering information, along with some cases where the effects of viscosity become more important.

Example 1 Wing-body combination. All classical methods (e. g., lifting surface)

were capable of modeling simple lifting surfaces only with some estimation of

image538

image539

image540

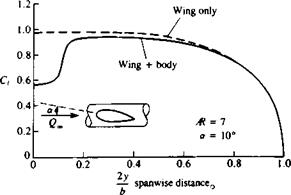
FIGURE 12.27

Effect of fuselage on the spanwise loading of a rectangular wing.

wing—fuselage juncture effects. Panel methods, on the other hand, can solve the flow over fairly complex wing-fuselage combinations. For example, Fig. 12.27 shows a typical case where the lift near the centerline is reduced due to the presence of the fuselage. The wake vortex originating near the wing-fuselage juncture, whose circulation is opposite in direction to the tip vortex, must be modeled carefully (so that it will not intersect the fuselage). The location of this vortex is important, too, since it may affect the flow on the rest of the aircraft and may cause flow separations on the aft-section of the fuselage and on the tail.

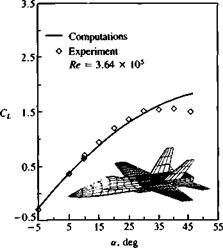
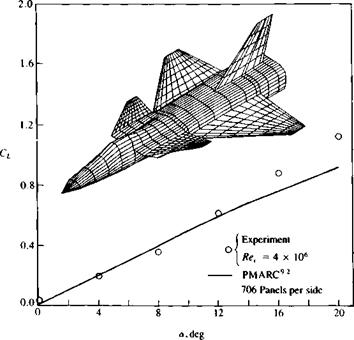
Example 2 Lift of high-speed airplane configuration. Airplanes that operate at higher speeds where compressibility effects are not negligible usually encounter low-speed flight conditions during takeoff and landing. For these conditions panel methods can provide useful aerodynamic information. As an example, the calculated and experimental lift coefficients for two such aircraft configurations are provided in Figs. 12.28 and 12.29. Both figures indicate that at the lower angles of attack (less than 15°) the calculations agree fairly well with the experiments. However, at larger angles of attack, leading-edge vortex lift (e. g., for a> 15° in Fig. 12.28 and for 15° < a <30° in Fig. 12.29) can cause additional

image541

FIGURE 12.28

Comparison between calculated and experimental lift coefficients for a generic fighter aircraft configuration. (Experimental data from Stoll, F., and Koenig, D. G., “Large Scale Wind-Tunnel Investigation of a Close-Coupled Canard-Delta-Wing Fighter Model through High Angles of Attack,” AIAA paper 83-2554).

FIGURE 12.29

image542Comparison between calculated and measured lift coefficients for the McDonnell Douglas F/A-18 airplane (using 668 panels per side). From Ref. 12.16. Reprinted with permission. Copyright AIAA.

lift and such vortex lift models were not introduced in this chapter. Also, the flow over these complete configurations is usually very complex and many regional flow separations and vortex flows exist. Therefore, even if the results presented in these two figures agree reasonably with the computations, the computations can serve mainly as a first-order prediction tool and for final validation usually extensive testing is required.

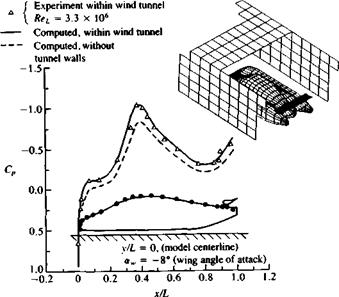
Example 3 Wind tunnel wall interference corrections. Wind tunnels provide a well-controlled environment where a variety of tests, such as measurement of aerodynamic pressures and loads, can be carried out. However, model designers usually prefer larger models and therefore, in many cases the effect of the test section walls is not neglibible. The most obvious interference between the model and the wind tunnel test section walls is called “solid blockage,” where the presence of the model inside the wind tunnel reduces the flow cross-sectional area and according to Bernoulli’s principle the flow speed will increase there. Since the local velocity at the test section is higher than it would be in a free flow outside the wind tunnel the aerodynamic coefficients are overestimated. In addition to this “blockage effect” there is a “reflection effect” that changes the lift of lifting surfaces near solid boundaries (as in the case of ground effect). Figure 12.30 shows the increase in the suction peaks (and velocity) over the upper surface of a streamlined automobile model that was well predicted by the panel method. In this case, for theoretical purposes the aft-section of the vehicle was highly streamlined and flow separations there were minimal, but a generalization of this approach to other bluff body shapes must be approached with extra care.

In general, the wind tunnel wall corrections are obtained by two sequential computations where in the first the flow field over the model within the wind tunnel test section is computed and in the second computation the wind tunnel walls are removed. The differences between these two cases provides the

image543

FIGURE 12.30

Effect of wind tunnel walls on the pressure distribution on the upper surface centerline (shown by the black dots) of a streamlined automobile (model frontal area to wind tunnel cross-sectional area ratio was about 13 percent). From Ref. 12.17.

potential flow effect of wind tunnel boundaries on model lift and blockage (Refs. 12.16 and 12.17). Also, note that this wind tunnel wall correction method inherently includes effects of lift and blockage, and provides more details than previous semi-empirical methods (for the complete wind tunnel wall effects, though, the viscous effects should be included, too).

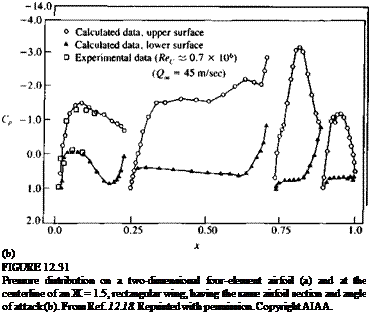
Example 4 High-lift, low-aspect ratio multielement wing. As the wing aspect ratio becomes small, two-dimensional airfoil analysis may not be applicable and a considerable difference exists between the two – and three-dimensional chordwise pressure distributions. Consequently, a two-dimensional development of such an airfoil section, without considering the complete three-dimensional analysis, is not recommended.1218 As an example, typical computational results for the two-dimensional pressure distribution on a four element airfoil are shown in Fig. 12.31a. The computed pressure distribution, at the centerline of a rectangular wing (Ж=1.5), having the same airfoil section and the same attitude, are presented in Fig. 12.31b. The most obvious difference between the two cases of Fig. 12.31 is the threefold reduction in the Cp range of the three-dimensional data and the change in the shape of the pressure distribution when compared with the two-dimensional case. Also, in the three-dimensional case, pressure gradients are the strongest near the second flap (from the trailing edge) and, with increased
SAMPLE SOLUTIONS WITH PANEL CODES

angle of attack, flow separation can be initiated here (and not near the leading edge, as it seems from the two-dimensional data).

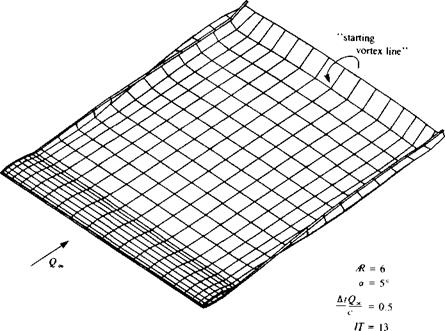
Example 5 Wake length. One of the objectives of this section is to highlight some possible errors in modeling the potential flow problems. One such frequent problem arises when the wake of a wing is too short (in steady-state flow). This problem occurs when, due to the need to present the wing and the wake in the

image546

FIGURE 12.32

Location of the starting vortex in the case of specifying a short wake for an Ж = 6 rectangular wing in a steady-state flow.

same scale, the wake model becomes short. Since in most situations the wake is modeled by constant-strength doublet elements a starting vortex is present at the edge of the far field panel as shown in Fig. 12.32. This vortex induces a downwash on the wing that reduces its lift. The problem can easily be cured by a longer wake, which should be at least 20 chordlengths behind the wing trailing edge (of course this distance depends on wing aspect ratio; see also the effect of a starting vortex in Example 1, Section 13.12).

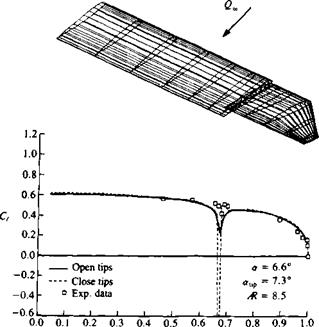
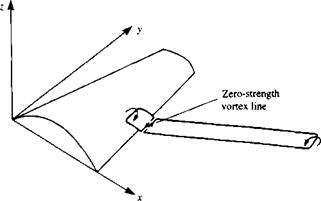
Example 6 Modeling of gap in wing. Example 4 indicated that the modeling of a gap between two airfoils is obtained in a satisfactory manner. However if the gap is parallel to the streamlines, as in the case of the chordwise gap between a main wing and a flap, establishing a good panel model may be difficult. Since the potential flow does not account for viscosity, the velocity inside a narrow gap will increase to unrealistic values, which in reality are reduced by the viscous friction. This problem is demonstrated by Fig. 12.33 (taken from Ref. 12.19) where such a side gap between a large aspect ratio wing and a moving wing tip (shown in Fig. 12.33) is calculated by different panel models. When the two wing parts were modeled as two separate, closed bodies, the high speed within the gap resulted in large suction peaks (shown by the broken line) that are different from the experimental data. The solid line shows the case where the wing and the wing tip closures were removed from the gap (thereby leaving the two bodies open in the

image547

FIGURE 1233

Effect of a gap between a floating wing tip and the wing on the spanwise loading. From Ref. 12.19.

gap region) and the results now agree more with the experimental data. Since this example was executed with a first-order panel method (Ref. 12.11) that is not sensitive to gaps in the panel model this problem was partially resolved, but this approach is not applicable to higher-order panel methods. (Note that the accurate potential solution is practically inaccurate in this case and the removal of the wing side edge closures inside the gap should be viewed as a viscous flow effect modeling exercise!)

HIGHER-ORDER PANEL METHODS

The mathematical principle behind these methods is similar to that of the low-order methods, but the complexity of the element in terms of its geometry and singularity distribution is increased. The boundary conditions to be solved are still Eq. (12.29) (Dirichlet) and Eq. (12.30) (Neumann) or a combination of both (that is, on some panels the Neumann and on the other panels the Dirichlet condition will be used—but not both conditions on the same panel).

The influence coefficients are more complex and they depend on more than one singularity parameter (only one such a parameter was required for a constant-strength source or doublet element). In the following section a brief description of such a method is presented and more details on one of these methods (PAN AIR) is provided in Refs. 12.8 and 12.9.

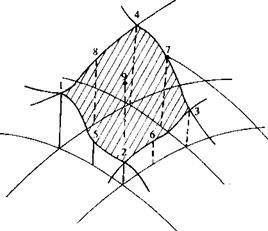
Choice of singularity elements. Using a first-order source and second-order doublet distribution as described in Section 10.5 allows us to determine the influence of each panel in terms of its values at its nine points (as shown in Fig. 12.26). The surface is divided into five subelements and the relative location of these points is shown in Fig. 10.27, too. The influence of the panel’s subelements can be summarized as:

ДФ = Fs(ou o2, ст3, o4, ct9) =fs(oQ, ox, Oy) (12.42)

Д(u, v, w) = Gs(ou o2, o3, o4, ct9) = gs(an, ox, oy) (12.43) for the first-order source element and

ДФ = Fd(jUi, fi2, Fi, Fa, Fs, Ft,, Fi, F*, F9) = fD(Fo, Fx, Fy, Fxx, Fxy, Fyy)

(12.44)

Д(и, v, w) = GD(plt F2, Fs, Fa, Fs, Fe, Fi, Fs, F9)

= go(Fo, Fx, Fy, Fxx, Fxy, Fyy) (12.45)

for the second-order doublet. The subscript 1 through 9 denotes the strength of the singularity distribution at this point according to the sequence in Fig.

12.26. Note that for a source five unknowns are used, but by assuming a linear strength distribution this can be reduced by algebraic manipulations to three (e. g., fs = a0 + axx + oyy). Similarly, by assuming a parabolic distribution for the doublet strength the number of unknowns is reduced to six per panel (e. g., gn = Fo + FxX + Fy У + FxyXy + FxxX2 + juyyy2).

image537FIGURE 12.26

Typical points used to evaluate the influence of a higher-order singu­larity distribution.

Discretization and grid generation. The grid-generation procedure is similar to the procedure described for the zero-order method, but now all nine nodal points are stored in the memory. Also, gaps in the geometry are not allowed since a continuous geometry is assumed.

Influence coefficients. Again we shall follow the case where the strength of the source (for thick bodies) is set by Eq. (12.31):

ok ^ • Q x

The Dirichlet boundary condition can then be reduced to the form

6N Nw 3 N

2 Скцк + 2 CM + 2 вкак = 0 (12.46)

= 1 t= k = 1

or if the Neumann condition is used then on the /th collocation point

6N Nw 3 N

2 Ctlik + 2 Cl to + 2 В*кок = Q« • n, (12.47)

*=і /=i *=i

In principle, for N panels we have 6N unknown doublets, but by matching the magnitudes (or slopes) of the neighbor panels, 5N very simple additional equations can be obtained (see, for example, the two-dimensional case as in Section 11.6.1). These neighbor panel relations are resubstituted into Eq. (12.46) or Eq. (12.47) such that for N panels N linear algebraic equations must be solved. Also, as before, the wake doublets ju, do not contain any new unknowns and based on the corresponding doublet values of the wake shedding panels the wake influence can be substituted into the Ck, Ck coefficients. Thus for each panel i,

2 AikPk = – 2 Bikak (12.48)

*=і *=i

where the collocation point counter і = 1 —> N.

Establish RHS. The right-hand side of this equation includes the known source strengths (for the Dirichlet boundary condition) and the free-stream component normal to the surface (for the Neumann boundary condition case) and can be computed. The additional 2N equations for the source cornerpoint values are obtained by matching the source strength at the panel edges.

Solution of linear equations. Same as for low-order methods.

Computation of velocities and pressures. The local tangential velocity is calculated by using Eq. (12.37), but since at each panel there are nine values of fi a finer arithmetic scheme is used for calculating the local gradients of the velocity potential. Once the velocity components are found the local pressure coefficient and the aerodynamic loads are found by using Eqs. (12.40) and (12.41).

More details on such higher-order panel codes can be found in Refs. 9.3 or 12.9.

FIRST-ORDER POTENTIAL-BASED PANEL METHODS

As an example of the more recent first-order panel methods, some of the features are discussed, following the six steps used for the previous computa­tional methods. It is recommended at this phase that the students use one of the available panel codes along with its graphical pre – and postprocessor. It is useful to become familiar first with the preprocessor and the grid-generation
process, through homework assignments, and only later devote more time to the aerodynamic results. In the following discussion, some of the features of a first-order method (e. g., VSAERO,1210,1211 and PMARC,12 14) are described.

Choice of singularity elements. The basic panel element used in this method has a constant strength source or doublet, and the surface is also planar (but doublet panels that are equivalent to a vortex ring can be twisted). Following the formulation of Section 9.4, the Dirichlet boundary condition on a thick body can be reduced to the form of Eq. (9.23), which states that the perturbation potential inside the body is zero:

N Nw N

2 QM* + 2 + 2 Bkak = 0 (12.29)

*=i i=i *=i

This equation will be evaluated for each collocation point inside the body and the influence coefficients Ck, Ci of the body and wake doublets and Bk of the sources are calculated by the formulas of Section 10.4.

Both the VSAERO1210,12 11 and PMARC12 14 computer programs allow additional modeling of zero-thickness surfaces by vortex-lattice grids that are treated as shown in Section 12.2. On these surfaces the zero normal velocity boundary condition is used, which results in a similar set of equations on the collocation points of panel i:

2 Cipk + 2 C?>, + 2 B*kok = —Qoo • n, (12.30)

k=l /=1 *=1

The Bk, Ck induced velocity coefficients are given, too, in Section 10.4.

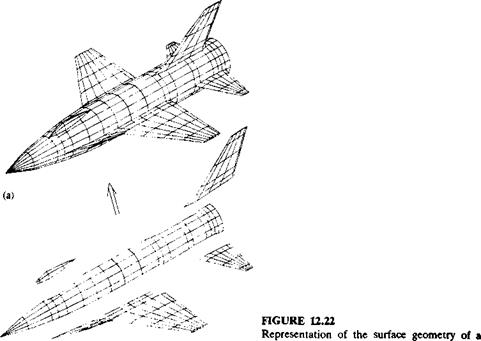
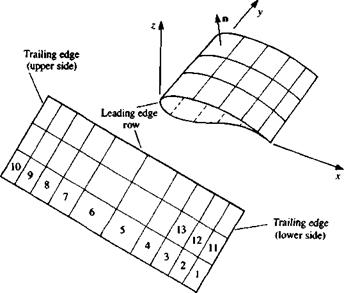
Discretization and grid generation. In this phase the shape of the body is divided into surface panel elements as shown in Fig. 12.22. It is useful to have a graphic representation of the grid so that possible input errors such as gaps between the panels and misplaced corner points can be corrected. The grid is usually constructed of rectangular subgrids (patches) and some of the patches forming the model of Fig. 12.22 are shown as well. Note that triangular panels, as in the nose cone area, are actually rectangular panels with two coinciding comers. At this phase the panel comer points, collocation points (which may be on the surface or slightly inside the body), and the outward normal vectors n*. are identified. Also, the counter к for each panel is assigned and a typical example of generating a wing grid and its unfolded patch is shown in Fig. 12.23.

Подпись: (12.31)Подпись: °k — nk ‘ Q«Influence coeflicifents. In this phase the boundary conditions of Eq. (12.29) (or (12.30)) are evaluated and for this example we shall use only the Dirichlet boundary condition. As was noted earlier, Eq. (12.29) is not unique and the combination of sources and doublets must be selected. For example, fixing the source strengths as

image530

generic airplane by subarrays (patches): (a) (b) complete model; (b) separate patches.

image531

FIGURE 12.23

Method of storing the grid information on a wing patch (and identifying the wing’s outer surface).

Wake made of constant-strength doublets

Подпись:will result in a unique set of equations with the doublet strengths as the unknowns. The above selection of the source strength is based on the results of Section 4.4 and includes most of the normal velocity component required for the zero normal flow boundary condition (in the nonlifting case). Conse­quently, the unknown fjk strengths will be smaller.

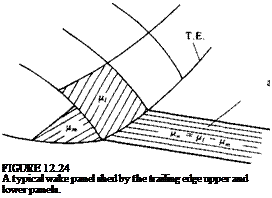
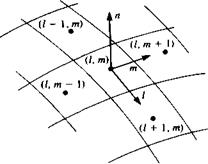
So, at this point, the potential at the collocation point of each panel (inside the body) is influenced by all the N other panels and Eq. (12.29) can be derived. Now, let us consider a wake panel that is shed by an upper panel with a counter / and a lower panel with a counter m, as shown in Fig. 12.24. Equation (12.29) for the first collocation point can be derived as:

Подпись: N

Сц/fi H—– 1- СиЦі H– 1- Clmpm H—- 1- CXNpN + 2 Cipnp + 2 Blkok – 0

(12.32)

The influence of this particular wake panel at point 1, when singled out from

image533(12.33)

where the counter p scans the wake panels. But this second summation of the wake influences in Eq. (12.29) does not contain additional unknown values of p. Therefore, the results of this second summation can be resubstituted into the equation, using the results of the Kutta condition (Eq. (12.33)). In the particular case of Fig. 12.24, the equation for the first point becomes

CnPi + ■ ■ • + (Cu + Cp)pi + • • • + (Clm — Clp)pm

Подпись: N

+ • • • + CXNpN + 2 BXkok = 0

Consequently, this equation can be simplified to a form

Подпись: NПодпись: Nimage534"(12.34)

<*11> <*12> ■ a21> a22> ■

• >

• . <*2IV

1<*V1> <*N2, ■

Подпись: aNNl
Подпись: Hi fi2 HN
Подпись: ^11, Ь2, ■ ■ , ^ідЛ 621, Ьі2, ■ • , b2N
Подпись: 01 02
Подпись: (12.35)
Подпись: AW,
Подпись: 0N

where Alk = Clk if no wake is shed from this panel and Alk = Clk ± Clp if it is shedding a wake panel. This equation now has the form

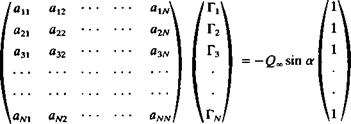
which is a set of N linear equations for the N unknown цк (ak is known from Eq. (12.31)). Also, note that akk = 1/2, except when the panel is at the trailing edge.

Establish RHS. The right-hand-side matrix multiplication can be carried out since the strengths of the sources are known. This procedure establishes the RHS vector and Eq. (12.35) reduces to the form:

<*ЛГ1, am, ■

aNN / A*IV

Подпись:Подпись: RHS„/<*11, <*12, • • •, <*ілД /И 1 <*21> <*22, • • • , <*2N I / /*2
Solution of linear equations. The above matrix is full and has a nonzero diagonal, and a stable numerical solution is possible. Usually when the number of panels is low (e. g., less than 500) a direct solver can be used. However, as the number of panels increases (up to 10000 recently), iterative solvers are used so that only one row of the matrix occupies the computer memory during the solution.

FIRST-ORDER POTENTIAL-BASED PANEL METHODS Подпись: (12.37)
image535

Computation of velocities, pressures, and loads. One of the advantages of the velocity potential formulation is that the computation of the surface velocity components and pressures is determinable by the local properties of the solution (velocity potential in this case). The perturbation velocity components on the surface of a panel can be obtained by Eqs. (9.26), in the tangential directions,

and in the normal direction,

qn = 0 (12.37a)

where /, m are the local tangential coordinates (see Fig. 12.25). For example,

FIGURE 12.25

image536Nomenclature used for the differentiation of the velocity potential for local tangen­tial velocity calculations.

the perturbation velocity component in the / direction can be formulated (e. g., by using central differences) as

qi = Y£l(t*i+- 4i-) (12.38)

where Дl is the panel length in the / direction. In most cases the panels do not have equal sizes and instead of this simple formula a more elaborate one can be used (sometimes only the term Д/ is modified). The total velocity at collocation point к is the sum of the free-stream plus the perturbation velocity

Qk = (2»,, G~m, Qoojk + (чь qm, qn)k (12.39)

where lk, mk, nk are the local panel coordinate directions (shown in Fig. 12.25) and of course the normal velocity component is zero. The pressure coefficient can now be computed for each panel using Eq. (4.53):

Срк = 1~Ш (12’40)

The contribution of this element to the aerodynamic loads AF*. is

AFk = – CPk(bQl)ASknk (12.41)

In many situations off-body velocity field information is required too. This type of calculation can be done by using the velocity influence formulas of Chapter 10 (and the strengths a and ц are known at this point).

INTRODUCTION TO PANEL CODES: A BRIEF HISTORY

From an observation of the brief history of potential flow solutions, and the methodology presented in Chapters 3-5, it is clear that the trend is toward using distributions of elementary solutions with gradually increasing com­plexity and determining their strength via the boundary conditions. So in principle, if a problem can be solved by distributing the unknown quantity on the boundary surface rather than in the entire volume surrounding the body (as in finite-difference methods), then a faster numerical solution is obtainable. This observation is true for most practical in viscid flow problems (e. g., lift of wings in attached flows, etc.).

This reduction of the three-dimensional computational domain to a two-dimensional one (on a three-dimensional boundary) led to the rapid development of computer codes for the implementation of panel methods and some of them are listed in Table 12.1. Probably the first successful three – dimensional panel code is known as the Hess code121 (or Douglas-Neumann), which was developed by the Douglas Aircraft Company and used a Neumann

TABLE 12.1

Chronological list of some panel methods and their main features

Method

Geometry of panel

Singularity

distribution

Boundary

conditions

Remarks

1962, Douglas – Neumann12 1

Flat

Constant source

Neumann

1966, Woodward I12 2

Flat

Linear sources Constant vortex

Neumann

M> 1

1973, USSAERO123

Flat

Linear sources Linear vortex

Neumann

M >1

1972, Hess I12 4

Flat

Constant source Constant doublet

Neumann

1980, MCAIR12 5

Flat

Constant source Quadratic doublet

Dirichlet

Coupling with B. L.

design mode

1980, SOUSSA126

Parabolic

Constant source Constant doublet

Dirichlet

Linearized

unsteady

1981, Hess II12 7

Parabolic

Linear source Quadratic doublet

Neumann

1981, PAN AIR12 8’12 9

Flat

subpanels

Linear source Quadratic doublet

both

M> 1

1982, VSAERO1210,1211

Flat

Constant source and doublet

both

Coupling with B. L., wake rollup

1983, QUADPAN12 12

Flat

Constant source and doublet

Dirichlet

1987, PMARC12 13,12 14

Flat

Constant source Constant doublet

both

Unsteady wake rollup

velocity boundary condition. This method was based on flat source panels, and had a true three-dimensional capability for nonlifting potential flows.

The Woodward I code,122 which originated in the Seattle area, was capable of solving lifting flows for thick airplane-like configurations. This code also had a supersonic potential flow solution option that increased its applicability. The method was later improved and was released as the USSAERO code12 3 (or the Woodward II code). At about the same time Hess added doublet elements to his nonlifting method so that he could solve for flow with lift; this code12 4 was widely used by the industry and was called the Hess I code.

All of the computer codes listed in Table 12.1 had the capability to correct for low-speed compressibility effects by using the Prandtl-Glauert transformation (as in Section 4.8).

The above computer codes were considered to be the first-generation panel programs, but as the computer technology evolved, more complex algorithms could be developed based on higher-order approximations to the panel surface and singularity distribution. For example, the MCAIR code,12 5 which evolved into a high-order singularity method, had two new interesting features. One was an inverse two-dimensional solution for multielement airfoils with prescribed pressure distribution. The second option was an iterative coupling with a boundary layer procedure. Pressure and velocity data from the potential flow solution were fed into a boundary layer analysis that estimated the displacement thickness and surface friction. During the next iteration of the potential solver the three-dimensional panel geometry was modified to include the added displacement thickness of the boundary layer.

At about the same time the SOUSSA code12 6 was developed and it used the Dirichlet boundary condition (as did MCAIR) and had the additional feature of an unsteady oscillatory mode. Also, John Hess of the McDonnell Douglas Aircraft Co. had updated the Hess I code to the Hess II code,12 7 which now had parabolic panel shape and higher-order singularity distributions.

During this second-generation panel code development period, the largest effort was invested in the PAN AIR code12 8,12 9 which was developed for NASA by the Boeing Co. The code had a five flat, subelement panel with higher-order singularity distribution and boundary conditions were usually Dirichlet, but on selected areas the Neumann condition could be used as well. This code also had the capability for solving the supersonic potential flow equations.

Until the early 1980s most panel codes were limited (along with the availability of mainframe computers) to the larger aerospace companies. However, computer technology rapidly evolved and cost decreased in these years, so that it was economically logical for smaller companies (e. g., general aviation contractors, boat builders, race-car teams, etc.) to use this technology. The first panel code commercially available to the smaller industries was VSAERO12 101211 (which was developed under a grant from NASA Ames Research Center). This code can be viewed as the beginning of a third period in the development of panel codes, since it returned to simpler, first-order panel and singularity elements. This code used the Dirichlet boundary condition for thick bodies and the Neumann condition for thin vortex-lattice panels. Interaction with several methods of boundary layer solutions along streamlines was used, but the displacement thickness effect was corrected by adding sources (blowing or transpiration), rather than adjusting the panel geometry (as in MCAIR). Also, a wake rollup routine was added that computed the induced velocity on the wake and moved the wake vortices to a new “force free” position. Following the success of this code (due to computational economy) the Lockheed company developed a similar method, called QUADPAN.1212

At this point it seems that the theory of panel methods has matured and most of the effort is invested in pre – and postprocessing (automatic generation of surface grids and graphical representation of results). Also, interactive airfoil and wing design is being developed where the designer can modify interactively the body’s geometry in order to obtain a desirable pressure distribution.

Some of the other improvements of these methods, during the second

TABLE 12.2

Claimed advantages of low – and high-order panel codes

Low-order methods

High-order methods

Derivation of

Simple derivation

More complex derivation

influence coefficients

Computer programming

Relatively simple coding

Requires more coding effort

Program size

Short (fits minicomputers)

Longer (will run on mainframes only)

Run cost

Low

Considerably higher

Accuracy

Less—for same number of panels

(but more accurate for same run time)

Higher accuracy for a given number of panels

Sensitivity to

Not very sensitive*

Not allowed

gaps in paneling

Extension to M > 1

Possible

Simple (for arbitrary geometry)

* This is a major advantage for the comparatively untrained user. Also this feature allows for an easy treatment of very narrow gaps where viscous effects control the otherwise high-speed inviscid flow (see Example 6 in

Section 12.7).

half of the 1980s, was the addition of an unsteady motion option,12 13 and an overall numeric optimization of the method (in terms of computer memory requirement and efficiency of matrix solver). Such a code is PM ARC1214 (Panel Method Ames Research Center) which was developed at NASA Ames and is now suitable for personal computers.

The recent trend of some code developers toward the use of low-order methods, and the fact that many different methods are now being used, led to several comparison studies (such as in Ref. 12.15). This particular study indicates that low-order methods are clearly faster and cheaper to operate. Some of the claimed advantages of each of the methods are listed in Table 12.2 and the decision of which one to choose for a particular application is not obvious. It is important to point out that “any method will provide good results after validating it through a large number of test cases” (free quote of Dr. John Hess).

LIFTING-SURFACE SOLUTION BY VORTEX RING ELEMENTS

In this section the three-dimensional thin lifting surface problem will be solved, using the vortex ring elements. The main advantage of this element is in the simple programming effort that it requires (although its computational efficiency can be further improved). Additionally, the exact boundary condi­tions will be satisfied on the actual wing surface, which can have camber and various planform shapes.

As with the previous example, this singularity element is based on the vortex line solution of the incompressible continuity equation. The boundary condition that must be satisfied by the solution is the zero normal flow across the thin wing’s solid surface:

V(<I> + Ф„) • n = 0 (12.1)

In the linearized lifting surface formulation of Section 4.5, this boundary condition was expressed in terms of a surface-vortex distribution (Eq. (4.50)) as

Подпись:J_ Г уу(дс-дсо) + ух(у-уо)

4л Jwing+wake [(x – x0)2 + (y~ y0)2 + z2f2 0

Note that in Eq. (12.15) the small-disturbance approximation to the boundary condition was satisfied on the wing surface projected onto the x-y plane, whereas in the following example the actual boundary condition (Eq. (12.1)) will be implemented.

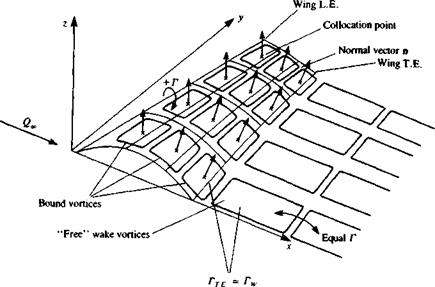
In order to solve this lifting-surface problem numerically, the wing is divided into elements containing vortex ring singularities as shown in Fig. 12.8. The solution procedure is as follows.

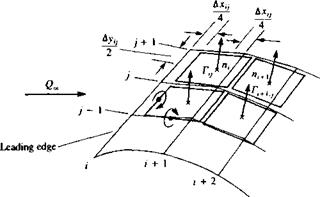
Choice of singularity element. The method by which the thin-wing planform is divided into panels is shown in Fig. 12.8 and some typical panel elements are shown in Fig. 12.9. The leading segment of the vortex ring is placed on the panel’s quarter chord line and the collocation point is at the center of the three-quarter chord line. The normal vector n is defined at this point, too. A

image513

FIGURE 12.8

Vortex ring model for a thin lifting surface.

positive Г is defined here according to the right-hand rotation rule (for the leading segment), as shown in the figure.

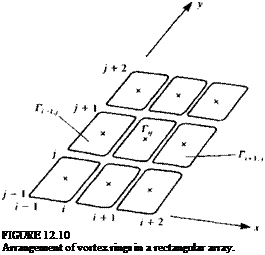
From the numerical point of view these vortex ring elements are stored in rectangular patches (arrays) with i, j indexing as shown by Fig. 12.10. The velocity induced at an arbitrary point P(x, y, z), by a typical vortex ring at location i, j can be computed by applying the vortex line routine VORTXL

image514

FIGURE 12.9

Nomenclature for the vortex ring elements.

P(X, у, г)

Подпись: FIGURE 12.10 Arrangement of vortex rings in a rectangular array. (Eq. (10.116)) to the ring’s four segments:
(ult vu w,) = VORTXL (x, y, z, хц, yiJt z, ir yi/+u zu+u r, v) (u2, v2, w2)

VORTXL (x, v, z, Xf j+if уij * і• Zt j. tf x^+ij+i, Уї+ij+if

(«з. W>3)

Подпись:= VORTXL (x, y, z, xl+hj+l, Уі+ij+iy 2, (u4, v4, w4) = VORTXL (x, y, z, xi+] ), y,+1,y, z/+1J,

The velocity induced by the four vortex segments is then

(U, V, tv) = («!, vu W!) + (u2, v2, w2) + (m3, u3, tv3) + (u4, V4, W4) (12.16)

It is convenient to include these computations in a subroutine (see Eq. (10.117a)) such that

(и, v, w) = VORING (x, y, z, і, j, Г) (12.17)

Note that in this formulation it is assumed that by specifying the i, j counters, the (x, y, z) coordinates of this panel are automatically identified (see Fig. 12.10).

The use of this subroutine can considerably shorten the programming effort; however, for the vortex segment between two such rings the induced velocity is computed twice. For the sake of simplicity this routine will be used for this problem, but more advanced programming can easily correct this loss of computational effort.

It is recommended at this point, too, to calculate the velocity induced by the trailing vortex segments only (the vortex lines parallel to the free stream, as in Fig. 12.5). This information is needed for the induced drag computations and if done at this phase will only slightly increase the computational effort. The influence of the trailing segments is obtained by simply omitting the (иь vu w,) + (u3, v3, w3) part from Eq. (12.16):

(ы, v, w)* = {u2, v2, w2) + (u4, u4, w4) (12.18)

So, at this point it is assumed that (и, v, w)* is automatically obtained as a by-product of subroutine VORING.

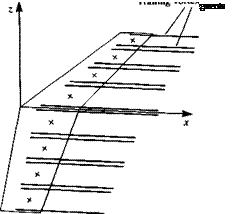
Discretization and grid generation. The method by which the thin-wing planform is divided into elements is shown in Fig. 12.8 and some typical panel elements are shown in Fig. 12.9. Also, only the wing semispan is modeled and the mirror-image method will be used to account for the other semispan. The leading segment of the vortex ring is placed on the panel’s quarter chord line and the collocation point is at the center of the three-quarter chord line. The normal vector n is defined at this point, as shown in Fig. 12.9. A positive Г is defined here as the right-hand rotation, as shown in the figure. For the pressure distribution calculations the local circulation is needed, which for the leading edge panel is equal to Г, but for all the elements behind it is equal to the difference Г;-Г(_!. In the case of increased surface curvature the above-described vortex rings will not be placed exactly on the lifting surface, and a finer grid needs to be used, or the wing surface can be redefined accordingly. By placing the leading segment of the vortex ring at the quarter chord line of the panel the two-dimensional Kutta condition is satisfied along the chord (recall the lumped-vortex element). Also, along the wing trailing edges, the trailing vortex of the last panel row (which actually simulates the starting vortex) must be canceled to satisfy the three-dimensional trailing edge condition:

Yt. e. — 0 (12.19)

For steady-state flow this is done by attempting to align the wake vortex panels parallel to the local streamlines, and their strength is equal to the strength of the shedding panel at the trailing edge (see Fig. 12.8 where Гт E = for each row).

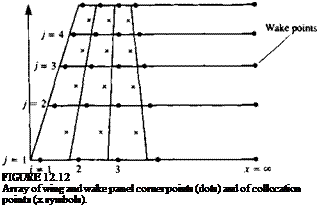
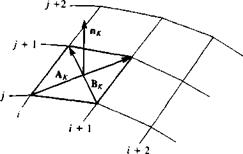
For this example (in Fig. 12.8) the chord is divided equally into M = 3 panels and the semi-span is divided equally into N = 4 panels. Therefore, the chordwise counter і will have values from 1—> M and the spanwise counter j will have values between 1—*N. Also, geometrical information such as the vortex ring corner points, panel area SK, normal vector n*, and the coordinates of the collocation points are calculated at this phase (note the panel sequential counter К will have values between 1 and M x N). A simple and fairly general method for evaluating the normal vector is shown in Fig.

12.11. The panel opposite corner points define two vectors AK and and

FIGURE 12.11

image516Definition of wing outward normal.
their vector product will point in the direction of nK

Подпись: (12.20)A-к *

|AK x BK|

The results of the grid generating phase are shown schematically in Fig.

12.12. For more information about generating panel corner points, collocation points, area and normal vector, see the student computer Program No. 12 in Appendix D (and subroutine PANEL for the use of Eq. (12.20)).

Influence coefficients. The influence coefficient calculation proceeds in a manner similar to the methods presented so far, but in this three-dimensional case more attention is needed to the scanning sequence of the surface panels.

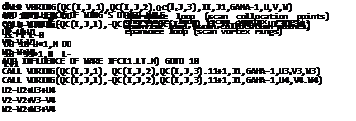
Let us establish a collocation point scanning procedure that takes the first chordwise row where і = 1 and scans spanwise with j = l-*N and so on (see Fig. 12.10). This procedure can be described by two “DO loops” shown in Fig.

12.13.

Подпись: FIGURE 12.12 Array of wing and wake panel corner points (dots) and of collocation points (x symbols).

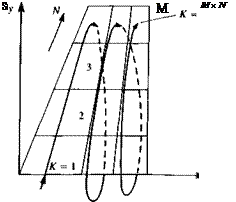
As the panel scanning begins, a sequential counter assigns a value К to each panel (the sequence of К is shown in Fig. 12.14) that will have values from l-»Mx)V.

A(K, L)-U2*AL(I, J)+V2*AH(ItJ)+W2*AN(I. J)

A(K, L) is influence coefficient and

(AL(ItJ),AH(I, J),AN(I, J)) is the normal vector of panel (I, J) CONTINUE

LIFTING-SURFACE SOLUTION BY VORTEX RING ELEMENTS
Подпись: C
LIFTING-SURFACE SOLUTION BY VORTEX RING ELEMENTS

FIGURE 12.13

Example of a double “DO loop” to calculate the influence coefficients of a vortex ring model.

Let us assume that the collocation point scanning has started and K = 1 (which is point (i = 1 ,j — 1) on Fig. 12.12). The velocity induced by the first vortex ring is then

(m„ Vi, иОп = VORING (x, y, z, і = 1, j = 1, Г = 1.0) and from its image on the left semi-span

image518 Подпись: FIGURE 12.14 Sequence of scanning the wing panels (with the counter K).

(m„, vih w,,),, = VORING (x, – y, z, і = 1, j = 1, Г = 1.0)
and the velocity induced by the unit strength Г, and its image at collocation

point 1 is:

(и, v, w)n = (и, + uih Vi – v„, w, 4- tv„) (12.21)

Note that the subscript ( ),, represents the influence of the first vortex at the first collocation point, and both counters can have values from 1 to M x N. Also, a unit strength vortex is used in the process of evaluating the influence coefficient an, which is

an = (u, v, w)n – n,

To scan all the vortex rings influencing this point, an inner scanning loop is needed with the counter L = 1—*N X M (see Fig. 12.13). Thus, at this point, the К counter is at point 1, and the L counter will scan all the vortex rings on the wing surface, and all the influence coefficients aiL are computed (also, in Eq. (12.21) the ( )n index means K = 1, L = 1):

aL = (u, v, w)lL • n, (12.22)

When a particular vortex ring is at the trailing edge, a “free wake” vortex ring with the same strength is added to cancel the spanwise starting vortex line (as shown in Fig. 12.15). Therefore, when the influence of such a trailing-edge panel vortex is calculated (I = M, in the inner vortex-ring loop in Fig. 12.13) the contribution of this segment is added. For example, in Fig. 12.8 the first wake panel is encountered when і = 3 (or the L counter is equal to 9). If the wake grid is added into the M +1 comer point array (as shown in Fig. 12.12 where this point is added at x = ») then the velocity due to the і = 3, j = 1 (or L = 9) panel is

(и, v, w)19 = VORING (*!, ylt zu і = 3, j = 1, Г = 1.0) and due to the attached wake

(u, v, w)l9W = VORING (xu Уг, Z, і = 3 + 1, j = 1, Г = 1.0)

image519

FIGURE 12.15

Method of attaching a vortex wake panel to fulfill the Kutta condition.

When the wing is symmetric as in this case and only the right half wing is paneled, then the (и, v, w) velocity components of the trailing edge and wake panels include the influence of the left hand side image (as in Eq. (12.21)). The corresponding influence coefficient is

fl19 = [(m, v, w)19 + (и, v, w)i9W] • n, (12.22a)

As mentioned before, parallel to the computation of the aKL coefficients, the normal velocity component induced by the streamwise segments can also be computed by using the (и, v, w)* portion as in Eq. (12.5). For the first element then

bL = (m, v, w)*L • nt (12.23)

This procedure continues until all the collocation points have been scanned and a FORTRAN example is presented in Fig. 12.13.

Establish RHS. The RHS vector is computed as before by scanning each of the collocation points on the wing:

RHSK = —Q„ • nK (12.24)

image520

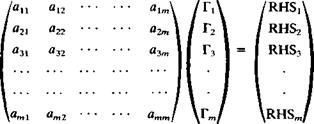
Solve linear set of equations. Once the computations of the influence coefficients and the right-hand side vector are completed, the zero normal flow boundary condition on each of the collocation points will result in the following set of algebraic equations:

Here К is the vertical collocation point counter and L is the horizontal vortex ring counter and the order of this matrix is m = M x N.

Secondary computations: pressures, loads, velocities, etc. The solution of the above set of equations results in the vector (Гі,. . . , Г*, . . . , Гт). If the counter К is resolved back to the original i, j counters then the lift of each bound vortex segment is obtained by using the Kutta-Joukowski theorem:

ALi< = РЄ ДГ, – r,_w) Дуц і > 1 (12.25)

and when the panel is at the leading edge (i = 1) then

Подпись:= РС)°£ц &У„ і = 1

The pressure difference across this panel is

image521(12.26)

where AS,, is the panel area.

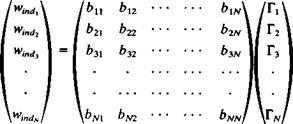
Подпись: ADij = —pwindl .(rij - r,-_w) Ay,,, A D„= -pw^JijAy,, Подпись: i> 1 i=l Подпись: (12.27) (12.27a)

The induced drag computation is somewhat more complex. The total aerodynamic loads are then the sum of the contributions of the individual panels. In this case

where the induced downwash at each collocation point i, j is computed by summing up the velocity induced by all the trailing vortex segments (see Fig.

12.5

image522

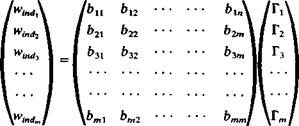
for the horseshoe vortex element case). This can be done during the phase of the influence coefficient computation (Eq. (12.23)) by using the VORING routine with the influence of the bound vortex segments turned off. This procedure can be summarized by the following matrix formulations where all the bK, and the Г* are known:

where again m = N x M.

image523

The induced drag can also be calculated by using Eq. (8.146) in the Trefftz plane, through the discretization of Eq. (12.10a):

Here the counter к scans the trailing edge vortices and Nw is the number of trailing edge vortices. Since the wake is force free, the trailing vortex lines will be normal to this plane and their induced velocity wind can be calculated by using the two-dimensional formula (e. g. Eqs. (3.81) and (3.82)). If wake rollup routines are used it is recommended to calculate first the wing circulation with the rolled up wake and for this induced velocity and drag calculation to use the spacing Дy,, of the vortex lines, as released at the trailing edge. (This is the simplest approximation for a force-free wake since many wake rollup routines may not converge to this condition.)

Example: Planar wings. Consider a planar wing planform, where the leading,

trailing, and side edges are made of straight lines and the wing has no camber. By

LIFTING-SURFACE SOLUTION BY VORTEX RING ELEMENTS

image524

FIGURE 12.16

Effect of aspect ratio on the lift coefficient slope of untapered planar wings. From Jones, R. T. and Cohen, D., “High Speed Wing Theory”, Princeton Aeronautical Paperback, No. 6, I960, Princeton University Press, Princeton, N. J.


LIFTING-SURFACE SOLUTION BY VORTEX RING ELEMENTS

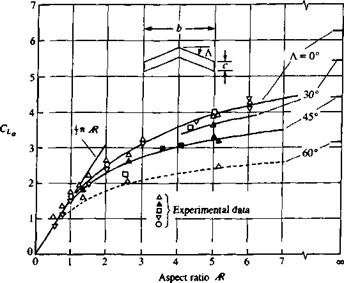
using the method of this section the lift slope CLa can be calculated and the general effect of wing aspect ratio Ж and sweep Л is summarized in Fig. 12.16. The two-dimensional values of the lift slope are shown at the right-hand side of the figure where Ж = For the two dimensional unswept wing CLa = 2л, as obtained in Chapter 5. The effect of leading edge sweep is to reduce this lift slope. Similarly, because of the increased downwash of the trailing vortices, smaller aspect ratio wings will have smaller lift slope.

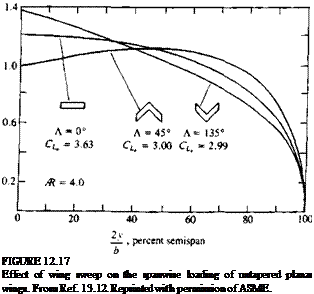
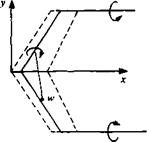
The effect of leading-edge sweep on the spanwise loading is shown in Fig. 12.17 for an Ж = 4 planar wing. Aft-swept wings will have more lift toward their tips while forward-swept wings will have larger loading near the root. This effect can be explained by observing the downwash induced by the right wing vortex on the left half-wing (Fig. 12.18). This downwash is larger near the wing centerline, and decreases toward the wing tip. In the case of the forward-swept wing, an upwash exists at the wing centerline that will increase the lift there.

From the wing structural point of view, for the same lift, the root bending moments will be smaller for a forward-swept wing than for a wing with the same aft sweep. Also for such untwisted wings the stall will be initialized at the root section of the forward-swept wing, which will create smaller rolling moments (due to possible asymmetry of the stall) than in the case of a comparable aft-swept wing. The main reason that most high-speed wings use aft-sweep is the aeroelastic divergence of the classical wing structures. (This problem can be avoided by tailoring the torsional properties of composite structures.)

Wing root bending can be reduced, too, by tapering the wing. The taper ratio A is defined as the ratio of tip to root chords:

Подпись: (12.28)c(y =6/ 2)

c(y — 0)

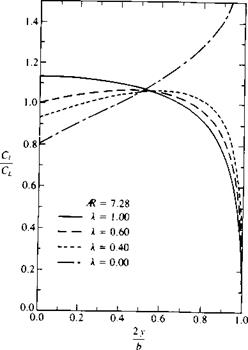
The spanwise loading of an untwisted wing with various taper ratios is shown in Fig. 12.19. As was noted, the load is decreasing toward the tip but the local lift coefficient (divided by the local chord) is increasing with a reduction in taper ratio. This means that the tip of such wings will stall first, an unfavorable behavior that can be corrected by twist (which reduces the angle of attack toward the tip).

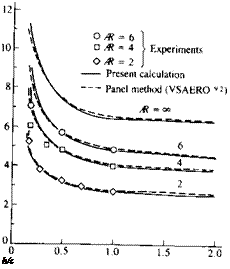
The method presented here can model ground proximity. Figure 12.20 presents the effect of distance from the ground for unswept rectangular wings. The increase in the lift slope in the proximity of the ground is present also for the smaller aspect ratio wings. In the case of the finite wing the image trailing wake

image526FIGURE 12.18

Schematic description of the effect of wing’s leading edge sweep.

FIGURE 12.19

image527Подпись: h/c Effect of taper ratio on the span – wise variation of the lift coefficient for untwisted wings. From Bertin, J. J. and Smith, M. L., “Aerodynamics for En­gineers”, Second Edition, 1989, Prentice Hall, p. 258. Reprinted by permission of Prentice-Hall, Inc., Englewood Cliffs, N. J.
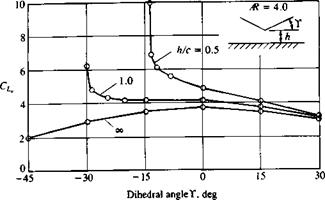
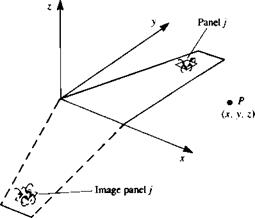
FIGURE 12.20

Effect of ground proximity on the lift coefficient slope of rectangular wings. From Ref. 13.12. Reprinted with permission of ASME.

image529

FIGURE 12.21

Effect of dihedral on the lift coefficient slope of rectangular wings in ground effect. From Kalman, T. P., Rodden, W. P. and Giesing, J. P., “Application of the Doublet-Lattice Method to Nonplanar Configurations in Subsonic Flow”, Journal of Aircraft, Vol. 8, No. 6, 1971. Reprinted with permission. Copyright AIAA.

induces an upwash on the wing that results in an additional gain in the lift due to ground proximity.

The effect of wing dihedral (see inset in Fig. 12.21) in ground proximity is shown in Fig. 12.21. Far from the ground the dihedral (as the sweep) reduces the lift slope. But near the ground, especially for negative values of dihedral (anhedral), the increase in lift of the wing portion near the ground is large, as shown in the figure.

MODELING OF REFLECTIONS FROM SOLID BOUNDARIES

In situations when symmetry exists between the left and right halves of the body’s surface, or when ground proximity is modeled, a rather simple method can be used to include these features in the numerical scheme. In terms of programming simplicity these modifications will affect only the influence coefficient calculation section of the code.

For example, consider the symmetric wing (left to right), shown in Fig.

12.6 where only the right-hand half of the wing must be modeled. The influence of a panel j at point P can be obtained by any of the influence routines of Chapter 10. For this example, let us use the HSHOE routine of the previous section. Thus, the velocity induced at point P by the /th element is

(u„ v„ wt) =

HSHOE (x, y, z, xAj, yAj, zAj, xBj, yBj, zBj, xCj, yCj, zCj, xDj, yDp zDj, Гу)

But because of the left/right symmetry, the image panel in the left half-wing in Fig. 12.6 will have the same strength, and its effect can be evaluated by calling the influence of the actual vortex at point (x, – y, z). Note that the sign was changed for the у coordinate. Thus,

(иin vih wu) =

HSHOE (x, – y, z, xAj, yAJ, zAJ, xBj, yBj, zBj, xCj, Ус,, zc,> *n,, У a,, zDj, Гу)

and the velocity induced by the two equal-strength elements at point P is

(u, v, w) = (u, + uih Vi – vih w, + w„) (12.11)

This procedure can reduce the number of unknowns by half, and only the vortices of the right semi-wing need to be modeled. Therefore, when scanning the elements of the semispan in the “influence coefficient” step the coefficients

image511FIGURE 12.6

Image of the right-hand side of a sym­metric wing model.

a, y are modified (see Eq. (12.7)) such that

ац = (m, v, w)y • n, = (и, + Uu, Vi – vit, Wi + wu)ij • n, (12.12)

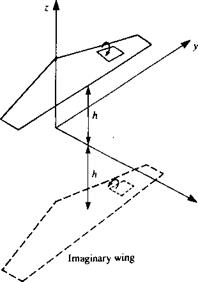
The inclusion of ground effect can be achieved by using the same method. In this situation (described in Fig. 12.7) the ground plane is simulated by modelling a mirror image wing under the x-y plane. Again, the velocity at a point P induced by the elements on the real wing (ug, vg, wg) and of the imaginary wing (ugg, vgg, wgg) are added up. Using the HSHOE routine to demonstrate this principle, the upper element induced velocity is

(ug, vg, wg) =

HSHOE (x, у > z, x^j, у a j, zA,, Xgj, Yu,, z^j, Xq, Уср %cp %Dj> Уиї, ^Dp Г)) and the velocity induced by the same element but at a point {x, y, – z) is

iugg’ vgg> wgg) ~

HSHOE (де, у, z, x^j, yAj, zAj, Xgj, Увр zp,, Xq, yep zq> Xpj, уp,, Zpj, Гу)

and the combined influence is

(m, v, w) — (ug + Ugg, Vg + Vgg, Wg — Wgg) (12.13)

The coefficient a, у that includes the “ground effect” is

— (**> w),y • n, — (Ug + Ugg, Vg + Vgg, Wg — Wgg),у • n, (12.14)

Note that the wing in Fig. 12.7 is raised in the x, y, z system and the ground plane is assumed to be at the z = 0 plane.

image512FIGURE 12.7

Modeling of ground effect by using the image technique.

Using this method for computing the flow over a symmetric wing in ground proximity reduces the number of unknown elements by a factor of four. Since a large portion of the computational effort is the matrix inversion, which increases at a rate of N2, the use of this reflection technique can reduce computation time by approximately 1/16! Examples for incorporating this technique into a computer program are presented in the next section and in Appendix D, Programs No. 12 and 14.

LIFTING-LINE SOLUTION BY HORSESHOE ELEMENTS

As a first example, consider the numerical solution of the lifting-line problem of Section 8.1. This can help the students to understand the assumptions and limitations of the single vortex line method, which in this numerical form can be extended easily to include effects of wing sweep, dihedral, or even side slip. For simplicity only one chordwise vortex is used here but the method can easily be extended to include more chordwise vortices. The small-disturbance assumption of Chapter 8 still holds for this case, and a thin lifting wing with large aspect ratio (Ж > 4) is assumed. This problem is stated in terms of a vortex distribution in Section 4.5 and the following horseshoe model can be considered as the simplest approach to its solution.

In regard to solving Laplace’s equation, the vortex line is a solution of this equation and the only boundary condition that needs to be satisfied is the zero normal flow across the thin wing’s solid surface:

У(Ф + Фоо) • n = 0 (12.1)

In the classical case of Prandtl’s lifting-line model, the wing is placed on the x-y plane and then this boundary condition requires that the sum of the normal velocity component induced by the wing’s bound vortices wb, by the wake wit and by the free-stream velocity Q„ will be zero (see also Eq. (8.2a)):

Wb + Wi + Q^a = 0 (12.2)

Based on the proposed horseshoe element and on the above boundary condition, let us construct a numerical solution, following the six-step procedure of Chapter 9.

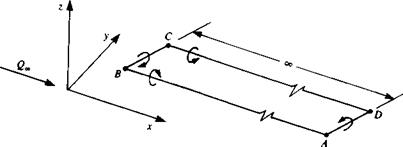
Choice of singularity element. In order to solve this problem the horseshoe element shown in Fig. 12.1 is selected. This element consists of a straight bound vortex segment (BC in Fig. 12.1) that models the lifting properties, and of two semi-infinite trailing vortex lines that model the wake. The segment BC

image504

FIGURE 12.1

“Horseshoe” model of a lifting wing.

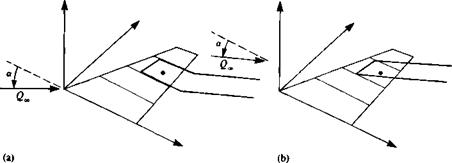
does not necessarily have to be parallel to the у axis, but at the element tips the vortex is shed into the flow where it must be parallel to the streamlines so that no force will act on the trailing vortices. In order not to violate the Helmholtz condition, these vortex elements are viewed as the near portions of vortex rings whose starting vortices extend far back, so that the effect of this segment (AD in Fig. 12.1) is negligible. The requirement that the “far wake” must be parallel to the free stream poses some modeling difficulties (which were not raised at all when constructing the classical lifting-line model). This is illustrated in Fig. 12.2a, which shows that the trailing wake has to be bent near the trailing edge in order to meet this “free wake” condition. Another possibility is shown in Fig. 12.2b, where the simple horseshoe vortex is kept, but the trailing segments are not shed at the trailing edge. Of course the very small angle of attack assumption (as in the case of the lifting-line model) allows the placing of the wake on the x-y plane of the body coordinate system as shown in Fig. 12.3. Since in this section the numerical solution of the

image505

FIGURE 12.2

Difficulties of meeting the “wake parallel to local velocity” condition by a single horseshoe vortex representation.

image506

FIGURE 12.3

Horseshoe vortex lattice model for solving the lifting-line problem.

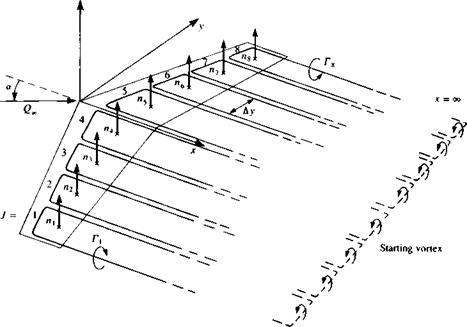
lifting-line model is attempted, we shall adapt the model shown in Fig. 12.3, which assumes small angles of attack. However, the method can easily be modified to treat the general case, as presented in Fig. 12.2a, and an even more detailed model will be presented in the next section.

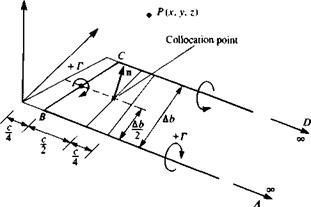
The method by which the thin-wing planform is divided into elements is shown in Fig. 12.3 and a typical spanwise element is shown in Fig. 12.4. Here, based on the results of the lumped-vortex model, the bound vortex is placed at the panel quarter chord line and the collocation point is at the center of the panel’s three-quarter chord line. The strength of the vortex Г is assumed to be constant for the horseshoe element and a positive circulation is defined as shown in the figure. Since this element is based on the lumped-vortex model, which includes the two-dimensional Kutta condition, it is assumed that this three-dimensional model accounts for (in an approximate way) the Kutta condition:

Ут. е. — 0 (12.3)

where the subscript T. E. stands for trailing edge^The velocity induced by such an element at an arbitrary point P(x, y, z) shown in Fig. 12.4 can be computed by applying three times the vortex line routine VORTXL (Eq. (10.116)) of

image507

FIGURE 12.4

A spanwise horseshoe vortex element.

Section 10.4.5:

(uu vu wO = VORTXL (x, y, z, xA, yA, zA, xB, yB, zB, Г)

(u2, v2, w2) = VORTXL (x, y, z, xB, yB, zB, xc, yc> *c, Г) (12.4)

(u3, v3, w3) = VORTXL (x, y, z, xc, yc, zc, xD, yD, zD, Г)

At this point, let us follow the small-disturbance lifting-line approach and

assume

Уа=Ув Ус = У d and xA=xD->™

Of course oo means that the influence of the vortex line beyond xA or xD is negligible, which from the practical point of view means at least 20 wing spans behind the wing. It is possible, at this point, to align the wake with the free stream by adjusting the points at x = » (e. g., zA = xA sin or, and zD = xD sin nr). It is also possible to use the model of Fig. 12.2a, which requires breaking the two trailing vortex segments into two segments each, and computing their induced velocity in a similar manner.

The velocity induced by the three vortex segments is then

(u, v,w) = (uuvu H-0 + (m2, v2t w2) + (m3, v3, w3) (12.4a)

It is convenient to include these computations (Eqs. (12.4) and (12.4a)) in а subroutine such that

(u, v, w) = HSHOE (x, y, 2, xA, yA, zA, xB, yB, zB, xc, yc, zc, xD, yD, zD, Г)

It is recommended at this point to separate and save the trailing vortex wake-induced downwash (и, v, w)* from the velocity induced by the bound vortex segments. This information is needed for the induced drag computa­tions and if done at this phase will only slightly increase the computational effort. The influence of the trailing segment is obtained by simply omitting the (u2, v2, w2) part from Eq. (12.4a):

(m, v, w)* = (uu vu wO + (a3, v3, w3) (12.5)

So, at this point it is assumed that (u, v, w)* is automatically obtained as a by-product of subroutine HSHOE.

Discretization and grid generation. At this phase the wing is divided into N spanwise elements as shown by Fig. 12.3 (the panel side edge is assumed to be parallel to the x axis). For this example the span is divided equally into N = 8 panels, and the spanwise counter j will have values between l—*N. Also, geometrical information such as the panel area Sr normal vector ny and the coordinates of the collocation points (xh yit z,) are calculated at this phase. For example, if the panel is approximated by a flat plate then the normal ny is a function of the local angle a) as defined in Fig. 11.3 or Fig. 11.17:

By = (sin ary, cos ay) (12.6)

Influence coefficients. In order to fulfill the boundary conditions, Eq. (12.2) is specified at each of the collocation points. The velocity induced by the horseshoe vortex element no. 1 at collocation point no. 1 (hence the index 1,1) can be computed by using the HSHOE routine developed before:

(u, v, w)n = HSHOE (xu y,, zu xA 1> Уаі> ZAU Xgi, Уві, ZB1, xci> Уси Zci, xDi, урі, zDi, Г = 1.0)

Note that Г = 1 is used to evaluate the influence coefficient due to a unit-strength vortex. Similarly, the velocity induced by the second vortex at the first collocation point will be

(U, V, w)12 = HSHOE (xi, Ух, Zu XA2, УA2> ZA2, XB2, yB2> ZB2,

XC2> Ус2> ZC2> XD2> УD2> ZD2, Г = 1.0)

The no normal flow across the wing boundary condition, at this point, can be rewritten for the first collocation point as [(и, v, Н’)„Г1 + (и, v, Н’)12Г2 + (u, v, иОхзГз + ■ ■ • + (и, v, w)1NrN

+ (tto, Ко, Woo)] • Пх = 0

and the strengths of the vortices Гу are not known at this phase.

Establishing the same procedure for each of the collocation points results

in the discretized form of the boundary condition:

ЯцГ! + dl2^2 "b а1зГз + • •

• + aiN rN = —Qoo • n,

а2іГі + а22Гг + Я23Г3 + • ■

■ + я2ЛіГлі = —Qoo • n2

Я31Г1 + П32Г2 + аззГз + ■ •

■ + ПзлгГд, = —Qoo • n3

аЛцГі + aN2^2 + аЛ/зГ3 + • •

• + aNNTN — Qoo •

where the influence coefficients are defined as

a, j = (u, v, w)ij • n, (12.7)

The normal velocity components of the free stream flow Q„ • n, are known and are moved to the right-hand side of the equation:

RHS, = -(l/„, V., W„) • n, (12.8)

This is a set of N linear algebraic equations with N unknown Г, that can be solved by standard matrix solution techniques.

As an example, for the case of a planar wing with constant angle of attack a this results in the following set of equations:

image508

In practice it is recommended to automate the computation of the atj coefficients by two “DO loops”. The first will scan the collocation points and the inner loop will scan the vortex elements for each collocation point:

DO 1 i = 1, N collocation point loop RHS, = – Q, n,

DO 1 j = 1, N vortex element loop

(u, v, w)jj — HSHOE (x,-, y,*, Zjt Xajj УAj> %Aj> Хщу ущ*

zBj> XCj> Уср ZCj> XDp У Dp zDj> Г = 1-0) ait = (и, v, w)tj • n, by = (m, v, w)*j • n,

1 END

Here by is the normal component of the wake-induced downwash that will be used for the induced drag computations and (ы, v, w)fj is given by Eq.

(12.5) .

Establish RHS vector. The right-hand side vector, Eq. (12.8), is actually the normal component of the free stream, which can be computed within the outer “DO loop” of the influence coefficient computations (as shown above). However, if an upgrade of the code is planned to include unsteady effects or the simulation of normal “transpiration” flows, then it is recommended to do this calculation separately.

Solve linear set of equations. The solution of the above-described problem can be obtained by standard matrix methods. Furthermore, since the influence of such an element on itself is the largest, the matrix will have a dominant diagonal, and the solution is stable.

Secondary computations: pressures, loads, velocities, etc. The solution of the above set of equations results in the vector (Г,, Г2,. . . , Г*,). The lift of each bound vortex segment is obtained by using the Kutta-Joukowski theorem:

Подпись: (12.9)A L, = pQoSj Ay,

where A)>j is the panel bound vortex projection normal to the free stream. The induced drag computation is somewhat more complex. The total aerodynamic loads are the sum of the contributions of the individual panels. Following the lifting-line results of Eq. (8.20a)

Подпись: (12.10)AD, = -pwindTj Ay j

where the induced downwash windj at each collocation point j is computed by summing up the velocity induced by all the trailing vortex segments (see Fig.

12.5)

image509 Подпись: FIGURE 12.5 Array of the trailing vortex segments responsible for the induced downwash on the three-dimensional wing.

. This can be done during the phase of the influence coefficient computations or even later, by using the HSHOE routine with the influence of the bound vortex segment turned off. This procedure can be summarized by

the following matrix formulation where all the btj and the Г, are known:

image510

The induced drag can also be calculated by using Eq. (8.146) in the Trefftz plane, which is selected to be far behind the trailing edge and normal to the free stream. Since the wake is force free, the trailing vortex lines will be normal to this plane and their induced velocity can be calculated by using the two-dimensional formula (e. g. Eqs. (3.81) and (3.82)). Consequently, the wake-induced downwash at each of the trailing vortex lines is:

1 у xi~ x‘

Wmd’ Ілйії-г. У + ІХі-х,)2

where Nw is the number of trailing vortex lines and the influence of a vortex line on itself is set to zero. Once the induced downwash at each of the vortex lines is obtained, the induced drag is evaluated by applying Eq. (8.146):

D = ~t [ T(y)wdy = riwindj Ayj (12.10a)

If wake rollup routines are used it is recommended to calculate first the wing circulation with the rolled up wake and for this induced velocity and drag calculation to use the spacing Ayt of the vortex lines, as released at the trailing edge. (This is the simplest approximation for a force-free wake since many wake rollup routines may not converge to this condition.) Also, note that Eq. (12.10a) is similar to Eq. (12.10) but it has a coefficient of which is a result of the first being evaluated at the Trefftz plane (where the trailing vortices seem to be two-dimensional), whereas Eq. (12.10) is evaluated at the spanwise bound-vortex line (and there the trailing vortices are observed to be semi-infinite).

This first simple example presented a numerical solution for the lifting line model, and inclusion of wing sweep and dihedral effects can be done as a homework assignment. Some of the limitations with regard to the wake model and the trailing-edge conditions will be studied in the vortex-ring model that will be presented next. Also, the method presented here does not take advantage of the wing symmetry in order to reduce computational effort. This important modification is discussed in the following section.

THREE – DIMENSIONAL NUMERICAL SOLUTIONS

Three-dimensional numerical solutions based on surface singularity distribu­tions are similar, in principle, to methods presented for the two-dimensional case. From the theoretical aspect, only the wake and the trailing edge conditions (three-dimensional Kutta condition) will require some additional attention. The most difficult aspect in three dimensions, though, is the modeling of the geometry, especially when arbitrary geometry capability is sought.

In the first part of this chapter the geometry (of the wing) is kept relatively simple and the aerodynamics of a thin lifting surface is modeled. In principle, this simple method has all the elements of the more complex panel methods and is capable of modeling the effect of wing planform shape on the fluid dynamic loads. In addition, the examples that are presented require only limited programming effort and, therefore, are suitable for classroom instruction.

In the second part of this chapter the principles of panel codes capable of solving the flow over bodies with arbitrary three-dimensional geometry will be presented. Over the years many such methods were developed and improved, but recent trends indicate an increased use of the approach which is based on the combination of surface source and doublet distributions with the inner potential boundary condition (for closed bodies). Consequently, only this approach will be presented through a brief description of one low-order and one high-order panel method.

In terms of classroom instruction it is recommended to use at this phase one of the commercially available panel codes and train the students first to use the pre- and post-processor. This graphic pre-processor generates the surface grid (panel model) which is used to define the input to the computer program. The post processor is usually a graphic utility that allows for a rapid analysis of the three-dimensional results by using extensive graphic repre­sentation. It is believed that after studying and preparing examples with the lifting surface code in this chapter (Section 12.3) the students can safely proceed to use a larger panel code since at this phase they must have a deep understanding of the formulation and the construction of these codes.

SOME CONCLUSIONS ABOUT PANEL METHODS

The examples presented in this chapter indicate that most methods can yield reasonable results. The methods were presented in their simplest form and their computational efficiency usually can be improved. For example, when calculating the influence of the panels, terms that depend on panel cornerpoint geometry are calculated twice (for each of the neighbor panels) and this redundancy can easily be corrected in the computer programming phase.

It seems that in terms of ease of construction and the least computational effort the constant-strength doublet method with the internal velocity potential boundary condition is the most successful. Also, in general, the use of the velocity potential boundary condition will result in less numerical manipula­tions and hence less computational time.

The use of higher-order methods requires more computational effort and is justified when the velocity near the body must be continuous (as inside the gaps of multielement airfoils). However, constant-strength singularity element based methods can give good results, too, when a sufficient number of panels are used (see Fig. 11.28).

All of the methods presented for the solution of lifting flows can be extended to include several bodies (or airfoils) and then for each element a separate Kutta condition is used. As an example, the chordwise pressure distribution along a four-element airfoil is presented in Fig. 11.33. The

image490

image491

FIGURE 11.36

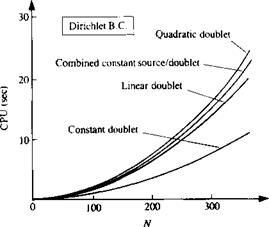
Comparison of computational time (CPU, in seconds for VAX-6000-320 computer) between the various panel methods, versus number of panels.

computation was done with a linear-strength source and doublet combination using the internal Dirichlet boundary condition.

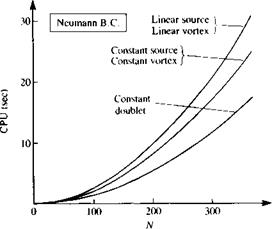
Most of the methods presented here were investigated in Ref. 11.1 and the computation times (CPU—measured in seconds for the VAX-6000-320 computer) versus number of panels N is presented in Fig. 11.36. In this data the matrix inversion time (which has the same order of magnitude) was subtracted in order to increase the resolution in the figure. This indicates that the constant doublet method with the Dirichlet boundary condition is the fastest, and computational effort increases with increasing order of the method (however, it seems that low – and higher-order methods can converge to solutions of similar quality in terms of circulation and lift with a similar number of panels).

It is noted, too, that each computational method depends on the grid and on various other parameters. Therefore, each technique must be validated first

image492

c

FIGURE 11.37

Effect of panel density on the computed pressure distribution, using very few panels (linear doublet method with the Dirichlet B. C.).

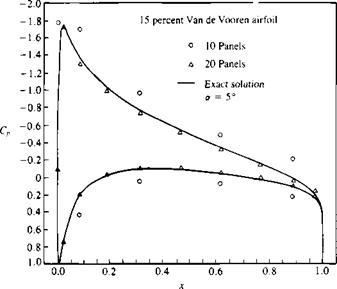
before it can be applied to unknown cases. As an example, the sensitivity of the linear doublet (with the internal Dirichlet boundary condition) to panel density is presented in Fig. 11.37. The very low density of 5 upper and 5 lower panels resulted in a crude solution, which improved considerably by doubling the number of panels. When panel density was increased to 70, results similar to those presented in Fig. 11.31 were obtained.

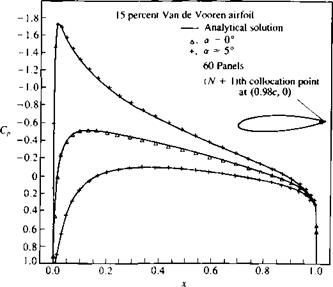
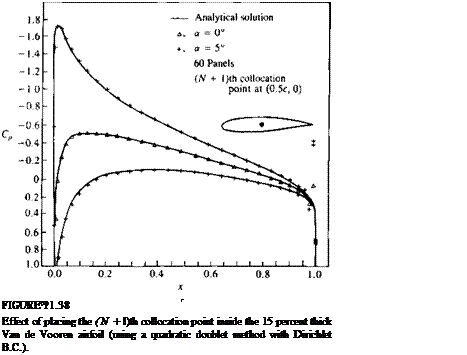
Another example for the sensitivity of the methods to geometrical details is presented in Fig. 11.38. Here the (N + l)th collocation point for the quadratic doublet (with Dirichlet B. C.) is moved inside the airfoil. In Fig. 11.38a this collocation point is placed near the trailing edge and the results for both a – 0° and 5° are good. (Bringing this point too close to the trailing edge panel collocation points, though, may cause the matrix to be ill-conditioned for large panel numbers.) But if this point is placed at the center of the airfoil (as shown in Fig. 11.386) the results near the trailing edge become erratic.

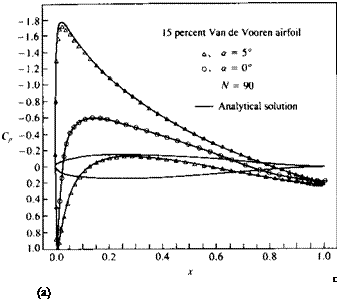
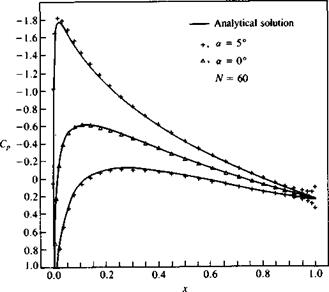
Another interesting problem arises when attempting to model airfoils with cusped (very thin) trailing edges. The geometry of such an airfoil is presented in the inset to Fig. 11.39a, and more information on this 15 percent thick airfoil is provided in Sections 6.6 and 6.7. Most methods will have problems near the trailing edge because of the very tight placing of the collocation points. This is illustrated in Fig. 11.396, where the data was calculated with a constant strength source/doublet method using the Dirichlet

SOME CONCLUSIONS ABOUT PANEL METHODS

image493

SOME CONCLUSIONS ABOUT PANEL METHODS

image496

FIGURE 11.39

Pressure distribution on a cusped trailing edge 15 percent thick Van de Vooren airfoil using: (a) linear vortex method with Neumann B. C., and (b) constant-strength source/doublet method with the Dirichlet B. C.


B. C. Such problems can be cured by modeling a finite angle there (instead of zero angle) and this can be achieved by simply having larger trailing edge panels. The linear-strength vortex method with the Neumann B. C. seemed to be the only method that was not sensitive to this cusped trailing edge problem (see Fig. 11.39a).

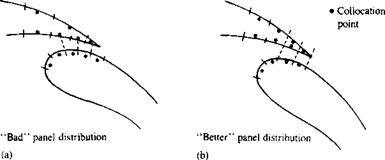
In conclusion, most methods will work and can be tailored to particular needs, and in many cases problems can be avoided by simple means such as selecting a better spacing of the panels. As a final example, to enforce this statement, consider the panel distribution inside the gap of a two-element airfoil, as shown in Fig. 11.40a. Since the lower surface collocation points are close to the panel cornerpoints the influence of this panel can be overestimated (e. g., in the case of a vortex being at the panel corner point). A simple rearrangement of the panels, as shown in Fig. 11.40b, can improve the solution in this area.

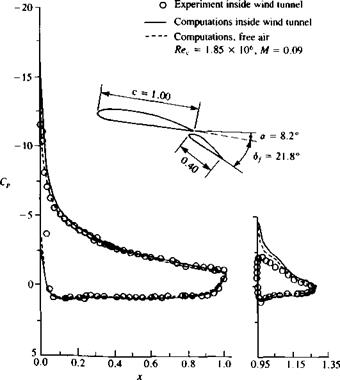
Finally, before concluding this chapter we must note that the present analysis is based on potential flow theory and, for example, the calculated drag coefficient is zero. However, the viscous boundary layer does result in certain values of drag coefficient (even at zero lift) and a large selection of such information is provided by Abbot and Doenhoff11 2 The effect of viscosity on the pressure distribution (for the smaller angles of attack) is usually small but at larger angles of attack due to flow separation the pressure distribution may change considerably (for more details see Chapter 14). As an example, the calculated (by a constant strength doublet-source method with Dirichlet B. C.) and experimental pressure distribution on a NACA 4412 airfoil with a NACA 4415 flap are presented in Fig. 11.41. In this condition the airfoil is near stall; that is, the flow on the front airfoil is attached and on the flap a limited trailing edge separation is present. Near the leading edge the calculated suction peak is larger than the experimental data and on the flap it is considerably less because of the trailing edge separation. Also, in general, even for the attached flow case the experimental circulation is slightly less as indicated by the comparison

image497

FIGURE 11.40

Recommended and not recommended options for panel distributions inside the gap of a two-element airfoil.

image498

C

FIGURE 11.41

Two-dimensional experimental and computed (constant source/doublet method, with Dirichlet B. C.) chordwise pressure distribution on a NACA 4412 wing and a NACA 4415 flap (flap chord is 40 percent of wing chord). Experiments from Adair, D. and Horne, W. C., “Turbulent Separated Flow in the Vicinity of a Single-Slotted Airfoil Flap,” AIAA Paper 88-0613, Jan. 1988.

Quadratic Doublet Method

The method of the previous section can be further simplified by equating the source strengths to zero in Eq. (11.60). The value of the constant for the internal potential is selected to be zero and consequently the boundary condition describing the internal potential (Eq. (11.60)) reduces to

Есл + Ф. = 0 (11.81)

where Ni is the number of singularity strength parameters, and

Фоо = + W„z (11-82)

Again, note that now fi will represent the potential jump from zero to Ф„ on the boundary (see Fig. 11.26) and therefore Фи is the local total potential (whereas in the previous example ц was the jump in the perturbation potential only).

Equation (11.81) can be specified at each collocation point inside the body, providing a linear algebraic equation for this point. The steps toward establishing such a numeric solution are very similar to those of the previous method:

Selection of singularity element. The potential at an arbitrary point P due to the y’th doublet element with the three doublet parameters ц0, and ц2 is given by Eq. (11.129):

Recall that the superscripts ( )a, ( )h and ( )c represent the panel influence contributions due to the three coefficients describing the panel doublet distribution.

Discretization of geometry. The N + 1 panel corner points and N collocation points are generated in a manner similar to the previous examples (see Fig.

11.18) . In this case of the internal Dirichlet boundary condition the collocation points must be placed inside the body. This small inward displacement of the collocation point can be skipped if the panel self induced influence is specified in a separate formula.

Influence coefficients. The influence of this doublet panel is calculated exactly as in the previous section. The velocity potential at each point is the sum of all the individual panel influences and, for example, for the first collocation point due to the first panel is

(Ф>0 + Фі|Иі + Ф^2>1 = «11^01 + bllMll + C„jU,2

and the potential at this collocation point due to all the doublet panels is given by Eq. (11.131):

Фш = (aiiPoi + biiMn + Сіф21) + (<*12^02 + hi2/*i2 + C12M22)

+ • • • + (dlN^ON + bliV/l 1JV + Ctn/*2n) 3" Alwfiw (11.131)

where (iw is the constant-strength wake doublet element (as in Section 11.3.1) and A1W is the wake influence coefficient, which can be calculated by using Eq.

(11.66) . The strength of this wake doublet element is set by applying the Kutta condition at the trailing edge and is given by Eq. (11.135).

image480 image483,image485 Подпись: (11.140)
image482

Using the backward substitution process described in the previous section the potential at the N + 1 collocation points (the additional point is inside the body and near the trailing edge) will have the form

Here the last two equations are the trailing edge conditions, based on Eqs. (11.134) and (11.135) and the coefficients Alt are the result of the backward substitution as described in the previous section. Substituting this into the

(11.141)

where again the last two equations are the trailing edge conditions and are known (e. g. from Eq. (11.82)).

Establish RHS vector. The second term in Eq. (11.141) is known and can be transferred to the right-hand side of the equation. The RHS vector then becomes

image486RHS, RHS2

(11.142)

image487,image488

and the terms are calculated by using Eq. (11.82).

image489

Solve equations. Substituting the influence coefficients of the doublets and the RHS vector into boundary condition Eq. (11.141) we get

(11.143)

This full-matrix equation with N + 3 unknown values fik can be solved by standard matrix solvers. Note that in this case (compared to Eq. (11.136)) the doublet represents the jump in the total potential (and not the perturbation only).

Calculation of pressures and loads. Once the values of the doublet parameters ((U01,…, n0N, HiN, h2n) are known, each panel doublet distribution can be obtained by using the backward substitution equations (e. g., Eqs. (11.134), (11.135), and (11.137)). Then the velocity at each collocation point can be calculated by differentiating the local potential,

&, = (/*„ + 2nv^) (11.144)

and the pressure coefficient can be calculated by using Eq. (11.18). The lift and pitching moment of the panel can be obtained by using the method described by Eqs. (11.78-11.80).

This method seems to involve less numerical calculations than the equivalent quadratic doublet/linear source method and therefore will require somewhat less computational time. (A computer program based on this method is presented in Appendix D, Program No. 10.)