Category Aerodynamics of V/STOL Flight

Behavior of a Wing in a Propeller Slipstream

Several approaches to the problem of a wing in a propeller slipstream can be found in the literature. None of these is quite satisfactory. Either the physical model is too simplified and restricted in its range of application or more exact solutions are too complicated for practical application.

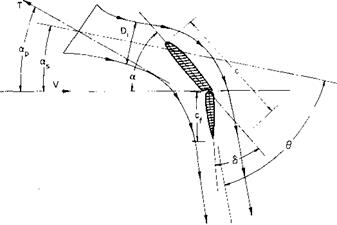
In general, a solution applicable over an extreme range of operating conditions, including wing angle of attack, flap angle, and propeller loading, is required. Consider the arbitrary wing-propeller combination shown in Figs. 8-9 and 8-10.

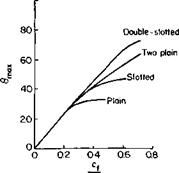
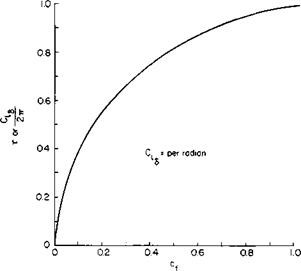
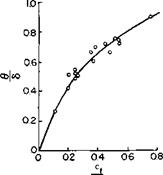
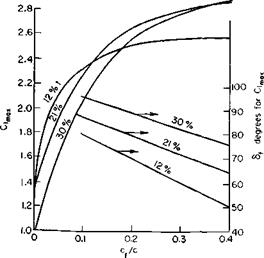
In this figure Di is the contracted slipstream diameter, c is the wing chord in the slipstream, and cf is the flap chord; 0 is the angle through which the slipstream is turned by the wing. Reference 2 argues on the basis of experimental data that the ratio of this angle to d is a function primarily of the ratio of cf to Dv Figure 8-11 taken from the reference presents this relationship together with the limitation of в. The maximum 0 depends both on the type of flap and the ratio cf! Dl.

Consider the limiting case in which Dj becomes small as the number of propellers N becomes large. The wing is then submerged in a thin jet which

Behavior of a Wing in a Propeller Slipstream

Fig. 8-9. Propeller-wing combination: a. p = prop angle of attack; as = slipstream angle of attack; a = wing angle of attack; S = flap angle; (I = angle through which slipstream is turned.

follows the contour of the airfoil and leaves tangent to the trailing edge. This is seen to be analogous to a jet-flap. The momentum coefficient Сц for the equivalent jet-flap would be approximately

Подпись: (8-14)

Подпись: Fig. 8-10. Slipstream velocity before and after wing.

NT

w

where N is the number of propellers, T is the thrust of each propeller, q is the free-stream dynamic pressure, and S is the projected wing area immersed in the stream. When Dt increases, it is assumed that the analogy to the jet flap will still hold if the angle at which the jet leaves the airfoil is obtained from Fig. 8-11.
Behavior of a Wing in a Propeller Slipstream Behavior of a Wing in a Propeller Slipstream

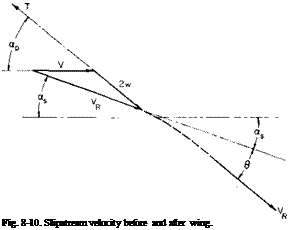
From Fig. 8-10 VR sin as = 2w sin ap. The vertical component of the

Fig. 8-11. Turning performance of flaps.

thrust is T sin ap = mVR sin as, where m is the mass flow rate through the propeller. The vertical component of the deflected thrust is mVR sin (as + 0). Hence the vertical lift of the turned slipstream in dimensionless form is

Ct(prop) = C„ sin (as + 0).

Behavior of a Wing in a Propeller Slipstream Подпись: (8-15)

Thus the lift of the wing-propeller combination can be expressed as the sum of three parts:

CLt=о is the lift that the wing would produce without the propellers. The last term is the vertical component that results from the turning of the momentum in the slipstream. CLr is the lift that results from the additional circulation produced by the effect of the slipstream acting as a jet flap on the flow external to the slipstream.

In addition, CL must be reduced by the vertical component of the profile drag of the wing immersed in the propeller slipstream. This drag, pro­portional to VR, must reduce VR by an increment AKR so that

D = jpVRSCD = m &VR

or

AFr D sin as

VR T sin ap

Hence Eq. (8-15) becomes

Cl = Ci-° + + C"sin (“s + 6) (S “ t}

We can estimate CD to obtain D/T or use the fact that for the same turning

D _ yVjCdS T pAV’2w

but

(D _ jP(2w0)2CdS

T )v = o 2pAwl

= C^S A ‘

Therefore

D=(£ Ії_

T Tjy=0 4 V’w

Подпись: where

V = [(F + w cos ap)2 + (w sin ap)2]1/2.

Подпись: Q. = Qr=o + Qr + s'n (as + Подпись: sin ap sin a5 Подпись: F Vj ' TjAV’w Подпись: (8-16)

The quantity 1 — (D/TV=0 is defined in Ref. 2 as the thrust recovery factor F/T. Hence CL finally becomes

The function F/T is presented in Fig. 8-12.

There are two other effects that have not been considered. First, the slipstream may increase CLr=o. The accelerating flow in the slipstream may provide some boundary layer control that would delay separation.

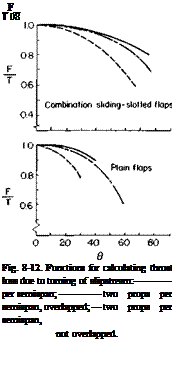
Подпись: N Slotted flops Подпись: _F_ T 08 Fig. 8-12. Functions for calculating thrust loss due to turning of slipstream: one prop per semispan; two props per semispan, overlapped; two props per semispan, not overlapped.
і о

Second, at an angle of attack a propeller produces a force normal to its axis. In general, however, in the range of interest these effects, in comparison with the other terms in (8-16), are negligible.

CLv can be calculated from two-dimensional jet flap theory corrected for finite aspect ratio from Fig. 3-17 or Eq. (7-21) and for vortex sheet deflection from Fig. 3-10. Figure 3-8 should also be checked for the limiting CL.

From Spence’s developments [2] C, for the two-dimensional jet flap is given by

C, r = Cta + CJ (8-17)

where

C, a = 1.152л/с~„ + 0.106C,, + 0.051C2/2 per radian,

Cl6 = 3.54- 0.675C„ + 0.156C2/2 per radian.

In these equations the contribution to C, of the jet reaction and angle of attack for C„ = 0 has been removed.

Behavior of a Wing in a Propeller Slipstream

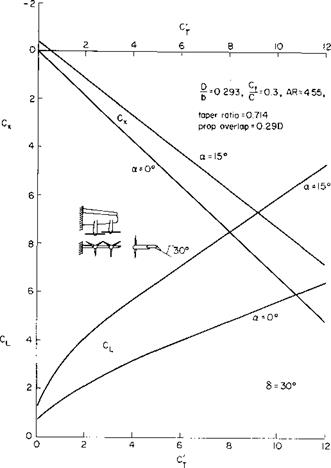
The above is perhaps best explained by means of an example. In Ref. 3 the data of Fig. 8-13 is presented. For illustrative purposes consider a = 15°, 5 = 30°, and C’T — 8; C, is defined according to (8-14), hence Cp — C’T = 8, but C„ and wJV are related by

For this example

Подпись: 1.04.Ap 24 n ~S = 4(18.17)

Подпись: V_ w0 Подпись: 4(1.04)T/2 8 Подпись: 0.72.

Therefore

From Fig. 8-3, w/w0 = 0.69 so that 2w/V = 2(0.69/0.72) = 1.92. The velocity diagram of the slipstream going into the wing is thus shown in Fig. 8-14.

First, considering the turning of the slipstream by the wing at an angle of 5.2°, from Fig. 8-11 for c/D = 0.76, 6/a = 0.9 so that в = 4.7. Added to this is the contribution of the flap. For this cf/D = 0.25 so that 0/<5 = 0.5 or в = 15°. The total в is thus 19.7. On the average, therefore, the slip­stream leaves at an angle of 9.8 + 19.7, or 29.5° from the horizontal. Hence C, r is given by

Ci r = Ctx + Cl6(<xs + в – a)

or

Behavior of a Wing in a Propeller Slipstream

15_

57.3


+ c.


C, r = Cl.


Behavior of a Wing in a Propeller Slipstream

Fig. 8-13. Experimental longitudinal force and lift coefficients for plain flap: C j — NT/qS Cx = FJqS S = wing area.

Behavior of a Wing in a Propeller Slipstream

Fig. 8-14. Example slipstream velocity diagram.

where

Cu = 1.152^8 + 0.106(8) + 0.051(8)3/2 = 5.16,

Cu = 3.54^8 – 0.675(8) + 0.156(8)3/2 = 8.13,

or

C, r == 1.35 + 2.05 = 3.40.

From Fig. 8-12 F/T =* 1.0, and there is no significant correction to C, for

turning losses.

Behavior of a Wing in a Propeller Slipstream Подпись: 5.92.

The aspect ratio of the example wing is approximately 4.5. From Fig. 3-17 C, r is reduced to 2.17; CL for T = 0 for this wing is 1.2. The redirected thrust contribution is

Hence the total predicted CL is

CL = 1.2 + 2.17 + 5.92 = 9.29.

By comparison with Fig. 8-13 the predicted CL is seen to be a little higher than the experimental value.

Consider the same case but for a = 0°. w/V is nearly the same so that for this case the slipstream is turned through an angle of only 15°; CL = 0.8 for T = 0 for this case, whereas

Clr=Cu5

= 2.12.

Correcting for AR, CLr = 1.35. Hence

CL = 0.8 + 1.35 + 8 sin (15°)

= 4.22.

This predicted value is somewhat lower than the measured value, but the agreement is certainly satisfactory for preliminary design purposes.

Propeller Analysis

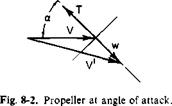
It is assumed that the propeller is far enough ahead of the wing to neglect the velocities induced there by the wing. If this is not the case, correction of the propeller angle of attack can be made for the upwash ahead of the wing. Figure 8-2 shows a propeller at an angle of attack.

Propeller Analysis

At the plane of the disk a velocity w is induced, given, according to Glauert’s hypothesis, by

T = 2pAV’w, (8-1)

where

V = [(F cos a + и’)2 + (F sin a)2]1/2.

This leads to a quartic in w:

w4 + w32V cos a + w2V2 = • (8-2)

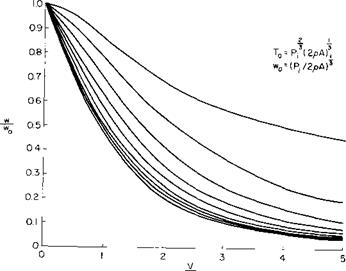
This equation can be nondimensionalized in terms of F. However, it leads to difficulties in the hovering or static thrusting case in which F is zero. Instead, the induced velocity which would be induced statically for the same thrust is used as the reference velocity.

This velocity, given in Chapter 4, is

T 1/2

Hence (8-2) can be written as

Подпись:w4 ,/wY У

— ) +21— 1 —cos a +

W n / VWn / W n

Propeller Analysis Propeller Analysis

The ideal power required by the propeller is given by the product of the thrust and the velocity normal to the disk.

P0 = Tw0

= power required to produce T statically.

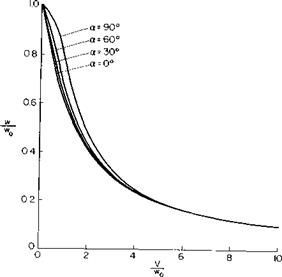
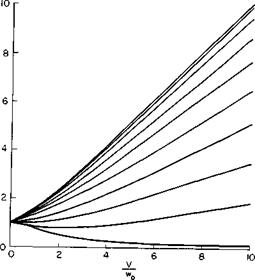
Equations (8-3) and (8-5) have been solved numerically for w/w0 and Pj/P0 as a function of V/w0 and a and their solutions are presented in Figs. 8-3 and 8-4. These curves represent the variation of w and P, for a constant thrust at a fixed angle of attack. Notice that w/w0, the ratio of the induced power for the general case to the induced power in hover, decreases for all angles of attack with increasing forward velocity but decreases more rapidly, the lower the angle of attack.

These relations can also be manipulated to give the variation of w and T with forward velocity for a constant power. From (8-4), for P, constant,

Подпись:(8-6)

where from Chapter 4

T0 = Pfl3(2pA)113,

Подпись:ЧІ/3

^0

Подпись:(—Y + 2(—Y+co.. + (—Y(—Y – ©

WqJ woJ w0 w0; w0J t0j or


Propeller Analysis

(V w

— cos a – I—-

w0 Щ


3 V (w

— cos a + — И’о Vw’o


= 1.0. (8-7)


+ 2


Propeller Analysis

Propeller Analysis

Fig. 8-3. Variation of induced velocity with speed for constant thrust.


a = 0° a = 10°

a =20°


a = 30°


a = 40°


a = 50°


Подпись: Q_ Q5

a =60°


a = 70°


a = 80°


a =90°


Fig. 8-4. Variation of required ideal power with speed for constant thrust.


Propeller Analysis

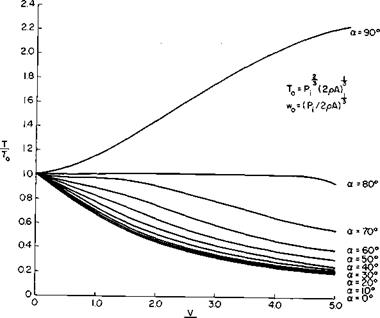
These relations have been solved numerically for w’/h’0 and T/T0 as a function of V/и’0 for various a. The results are presented in Figs. 8-5 and 8-6. Notice that for a constant power the thrust decreases with forward speed for a = 0, that is, as a propeller, and increases with forward speed for a = 90°, that is, when acting as a rotor. It is interesting to note that for an a of 80° the thrust is nearly constant with speed.

These curves would be utilized as follows: suppose we wished to calcu­late the power to produce a given thrust at a given a and V. First we would calculate w0 to obtain V/w0 and P0. Then, from Fig. 8-4, P/P0, hence P, would be obtained.

The power according to (8-5) is ideal in that it includes neither tip losses nor profile power. It might be expected that the tip losses would be accounted for fairly well if P0 were calculated by vortex theory rather than by simple momentum principles.

Propeller Analysis Propeller Analysis

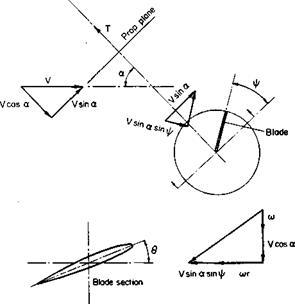
The profile power is calculated in a manner similar to that for a rotor in forward flight. Figure 8-7 illustrates the velocity components under which a blade section is operating when the propeller is operating at an angle of attack. If the section Cd is assumed constant along the blade, then

^-[1 +(„зт«)Ч^С„

or

Подпись: (8-8)Cp = Cpo(l + /і’2),

where p’ = p sin a,

P = V/VT,

CP0 = CP for P = 0-

The addition to the parasite power resulting from drag of the blades is again similar to the rotor.

= 2P’2Cro (8-9)

In Ref. 1 data are given on a wing and propellers in combination and separately at angle of attack from zero to 90°. Here still another thrust coefficient is defined, namely,

Propeller Analysis

Fig. 8-5. Variation of available thrust with speed for constant ideal power.


a = 90°


a = 80°


a = 70° a= 60° a = 0°


Fig. 8-6. Variation of induced velocity with speed for constant ideal power.


Propeller Analysis

Propeller Analysis

Fig. 8-7. Velocity components for propeller section with the propeller at an angle of attack.


Because T/A = 2pw%, T" can be written as

T‘= 4 + (K/h-0)2

or

Подпись: 2Подпись: 1/2Propeller Analysis(8-11)

Propeller Analysis Подпись: _P Po

The ratio of the power required for a given V and T to the ideal power required for V = 0 can be written in terms of CT and Cp as

where Cp and CT are defined according to 4-51(a) and (c).

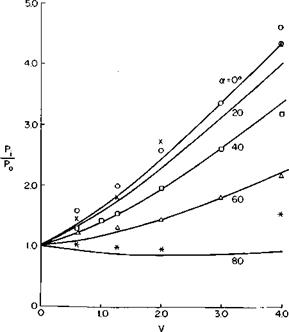
In order to compare the data of Ref. 1 with Fig. 8-4, the profile power must be subtracted from the measured Cp values. For comparison pur­poses it is assumed simply that Cd is a constant, independent of r and V, and that V ^ 0. Thus the profile power coefficient becomes approximately

For the propeller in Ref. 1 CPp was estimated to be 0.004, which corre­sponds to a Cd of approximately 0.016.

The following table illustrates the reduction of the data from Ref. 1; Fig. 9 of that reference is used.

Table 8-1 shows that the method of presentation of the data of Ref. 1 is

Table 8-1

Reduction of Data of Ref. 1

a

Cj-

Tr" = 0.20

cp2

CP

V

— = 4.C

wo

С, – 0.004

P,

К =

(ni 2 (Cp – 0.004)

W cp2

0

0.052

0.012

0.048

0.044

4.6

20

0.059

0.014

0.052

0.048

4.30

40

0.080

0.023

0.062

0.058

3.18

60

0.134

0.049

0.088

0.084

2.14

80

0.234

0.113

0.140

0.136

1.51

Propeller Analysis

Fig. 8-8. Variation of power with forward speed for tilting propeller. Experiment: a = 0 O;

30 x ; 40 □; 60 Л: 80*.

misleading. We might think that the power required for a constant T" increases as a increases, since Cp increases. Actually, however, the power required at 80° is only about one-third of that required at 0°.

Figure 8-8 compares the data of Ref. 1 with predictions based on the foregoing analysis. The data appear to confirm the analytical predictions.

Wings and propellers separately and in combination at high angles of attack

Many schemes for VTOL or STOL aircraft employ wings or propellers operating in an angle of attack range of zero to 90°. A prediction of their behavior under these conditions requires a blending of analytical con­siderations and experimental results. Not only is each problem separately

Wings and propellers separately and in combination at high angles of attack

difficult, but the difficulty is compounded when the wing and propeller are interacting with one another.

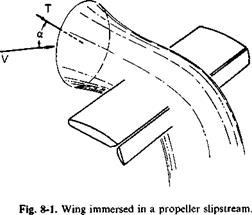
Consider the wing-propeller combination shown in Fig. 8-1, in which a portion of the wing is immersed in the propeller slipstream and is therefore under the influence of a velocity different from the outer portion. The outer portion may be completely stalled, whereas the inner portion may not. The

212

lift on the inner portion occurs as a result of deflecting the flow in the slip­stream and the flow external to it. In turning the slipstream, the wing reduces the forward component of the propeller thrust.

An entirely analytical solution to this problem is unlikely in view of the real fluid effects involved, such as stalling. Hence in the final analysis we resort to semiempirical approaches. Nevertheless, some insight into the behavior of the wing-propeller system is provided by analytical means. We begin by considering the behavior of the propeller alone. A combination blade element-momentum theory is used for the propeller.

Thrust and Drag

It has already been stated that in the two-dimensional case the jet is ultimately turned in the direction of the free stream and that the thrust is equal to the flux of momentum in the jet. In the actual case the thrust will be something less than the flux of momentum due to frictional losses on the boundaries of the jet in contact with the solid surfaces of the airfoil or with the slowly moving free-stream air.

For a finite, jet-flapped wing the jet is ultimately deflected in a direction slightly different from the free-stream direction because of the downwash.

Thrust and Drag

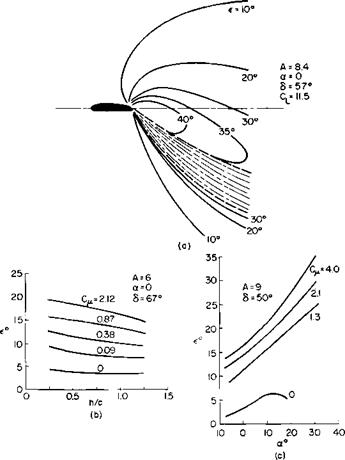
Fig. 7-11. Experimental measurements of downwash behind jet-flapped wings: (a) contours of constant downwash angle; (b) variation of downwash with tailplane height; (c) variation of

downwash with incidence.

This results in a reduction in the thrust which can be viewed as an addition to the induced drag.

If au denotes the downwash angle at infinity by the application of the momentum theorem far ahead and behind the wing, the thrust and lift become

T =

– у)иА +

jj (P ~ Pco) dy dz,

(7-27)

L =

«i. ftijVj + pVAj

w dy dz.

(7-28)

Подпись: ІР ~ Poo) dy dz = Thrust and Drag

These integrals are evaluated over the whole yz-plane at infinity, that is, the

Implicit in the derivation of (7-31) are the assumptions of an elliptical distribution of both Г and and the assumption that the downwash angle is small. The last can be checked with Eq. (7-30). Should a, prove large, then (7-31) must be multiplied by the factor obtained from Fig. 3-9, using an effective aspect ratio A’ defined by

A’ = A + (7-32)

71

This is still only an approximate correction, for the momentum and vor – ticity in the jet were neglected in arriving at Fig. 3-9.

The net thrust coefficient for a finite wing with full-span jet flaps can now be written as

Г2

г = r – L T M nA + 2CM

Подпись: CT = rC„ Thrust and Drag Подпись: (7-33)

Reference 4 suggests modifying this equation in the following way:

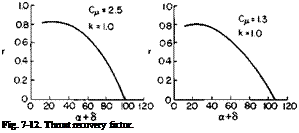
Подпись: Fig. 7-12. Thrust recovery factor.

CDo is the profile drag at zero lift without blowing, whereas r and к are correction factors for the theoretical values of the thrust and induced drag,

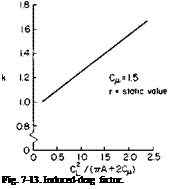
Подпись: Fig. 7-13. Induced-drag factor.

respectively. The values of r and k, given in Ref. 4, depart appreciably from unity, and we wonder whether this departure may not be the result of neglecting the deflection of the trailing vortex sheet in developing (7-31) rather than of a severe loss of jet thrust. For values of a + S below 40° r is approximately 0.8, which seems reasonable. Above 40°, however, r falls off

rapidly to zero at about an angle of 100°. The factor k, however, according to Ref. 4, increases nearly linearly with СЦ(пА + 2CM) from к = 0.95 at zero to about 1.55 at C]J(nA + 2CM) equal to 2.0. This is considerably less for к than Fig. 3-9 would indicate. Hence some of the rapid decrease of r with a + <5 beyond 40° may be caused by an incorrect assessment of the factor к in reducing the data.

This general area is an uncertain one at the present time and is in need of further study. However, since they are based on experimental data, and in the absence of another method, values of r and к taken from Ref. 4 are presented in Figs. 7-12 and 7-13.

Ground Effect

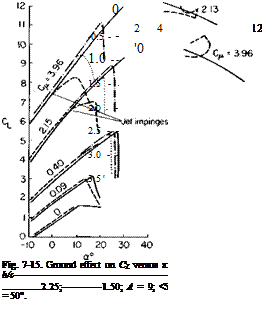
The effect of the ground on a jet-flapped airfoil is similar to conventional airfoils if the momentum coefficient is not too great. If CM is high enough, the jet can impinge on the ground and effectively blocks the flow between the lower surface of the airfoil and the ground. With increasing or 8 a vortex forms below the airfoil and reduces the pressure on the rear lower

Thrust and Drag

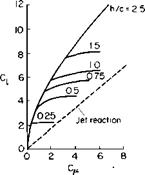
Fig. 7-14. Ground effect on C, versus С/х.

surface. Further increases in Сд lead to little or no change in C, but to a rapid forward movement of the center of pressure. Lift data on a two – dimensional section at a = 0° and 8 = 58° are presented in Fig. 7-14 for various height-to-chord ratios. Below h/c values of approximately 1.5, the ground is seen to have a significant limiting effect on C,.

Somewhat similar data are presented in Fig. 7-15 for a wing of aspect ratio 9. For Сд values of 0.40 or less the jet does not impinge on the ground for the lowest clearance studied of 1.5 c. Hence for these C^ values there is a slight increase in C, for an incidence angle below the stall. However, the angle of stall decreases with decreasing height and there is a slight decrease in CLmax. For a C„ of 2.15 and higher the jet impinges on the ground at the incidence angles shown; a significant decrease in CL results for angles above these critical values.

The effect of ground clearance on pitching moment and thrust is shown for the finite wing in Figs. 7-16 and 7-17. Again the effect is negligible until Сд and a are large enough to cause jet impingement. Above these values

significant changes are seen to occur in Cm and CT ; Cm becomes more positive and CT drops considerably.

Подпись: Cm
Thrust and Drag

Possibly the most serious ground effect, in addition to the effect on CL, is the effect on the downwash at the tail, which is shown in Fig. 7-18 for two different incidence angles for 8 = 50° for C„ from 0 to 3.96. For a of 20°, 8 — 50°, and = 3.96 the downwash angle is seen to drop from 30° out of ground effect to nearly zero at one chord length above

The jet flap

It was shown in Chapter 6 that the highest CLmax obtainable with an ordinary flap is about 2.7. This chapter treats the jet flap, where power is expended to generate much higher CLmax’s. The pure jet flap utilizes a jet of air only at the trailing edge, deflected downward, whereas the blown flap consists of a physical flap that directs a sheet of air blown over its upper surface. The two flaps are similar in their behavior in that a sheet of high – momentum air is directed downward from the trailing edge of the airfoil. In turning in the direction of the mainstream, this sheet of air can sustain a pressure difference across it which deflects the main stream. The pressure difference between the upper and lower surfaces of the airfoil does not have to vanish at the trailing edge. The result is an increased lift on the airfoil and a rearward shift in the center of pressure.

The jet flap was investigated as early as 1933 by Shubauer [1], but it was not until the development of the turbojet, with its ready supply of blowing air, that the application became feasible. It has even been proposed that the lifting system be completely combined with the propulsion system, for theoretically all of the jet momentum is recovered as thrust as the jet ultimately aligns itself in the free-stream direction.

Lift Performance

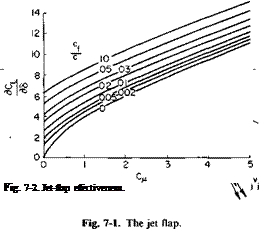
A jet flap is shown in Fig. 7-1. A jet with a mass flow rate of m – s and a velocity of Vj leaves the trailing edge of a deflected flap at an angle of S relative to the zero lift line of the airfoil section. This line, in turn, is at an angle of attack of a. As shown later, and as might be suspected, the lift coefficient of the airfoil can be divided into two parts:

The jet flap(7-1)
As might also be suspected, the derivative SCJ85 is a function of the ratio of Cf to c. It is also, however, a function of the momentum in the jet expressed in a dimensionless form as a momentum coefficient:

Подпись: (7-2)= 4th

qc

The jet flap

C„ is a “lift coefficient” of sorts, for m-Vj would be the jet force or reaction. Indeed, one way of determining Сц experimentally is simply to measure the

reaction statically. However, some error is introduced because of the en­trainment of the surrounding air. Instead, is usually determined from the measured mass flow rate and, assuming an isentropic expansion of the jet, from measured reservoir conditions in or just before the jet.

The derivative dCJda. is a function only of and is equal to dCJdd for

cy/c equal to one. Figure 7-2 presents dCJdd as a function of Сц for various values of the ratio of cf to e. For cy/c of 0 the values are given by

A

The jet flap Подпись: (7-4)

~ = [4тгС„(1 + 0.151СУ2 + 0.139СД)]1/2, (7-3)

For intermediate values of cfjc, Fig. 7-2 can be used, or we can inter­polate between Eqs. (7-3) and (7-4) by using the results for Сд = 0 developed in Chapter 6.

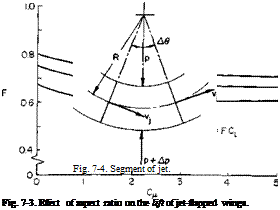
Подпись: F(A, C„) Подпись: A + 2C,Jn A + 2/тг (dCJda) - 2(1 + a) Подпись: (7-5)

Equations (7-3) and (7-4) are interpolations of theoretical results obtained by Spence [2] and are covered in more detail later. Reference 3 derives similar derivatives for a wing of finite aspect ratio. For the wing of aspect ratio A (7-3) and (7-4) are multiplied by a factor

where

(1 – QCJnA ° C – (1 – QCJnA

к _________ 2Cl / (a + S)

^ nA + 2(дС1/да) – 2tc(1 + a)

This implicit relation for F(A, CM) is unwieldy. Instead, for the usual case, it is sufficiently accurate to use an approximation for F(A, Cfl) which holds for small CM or large A.

FM r A + 2C"/7r n fit

1 ’ ^ “ A + 2 + 0.604C*’2 + 0.876СИ ( ’

Equation (7-6) is presented graphically in Fig. 7-3.

Before continuing, the theory of the thin jet-flapped airfoil from which Eqs. (7-3) and (7-4) were obtained must be examined. The general procedure presented in Ref. 2 by Spence is followed, but for the sake of simplicity some of the mathematical exactness and manipulations have been forsaken.

Consider a segment of the jet aft of the airfoil shown in Fig. 7-4. The mass rate of flow through the jet is т} and the velocity is ty. If we assume a pressure difference of Ap across the jet, then, from the momentum theorem
applied to the differential element, we can write

ntjVj A6 = ApR Л0 or

Подпись: (7-7)A mJVJ

where R is the radius of curvature of the jet.

The reaction of the jet on the flow external to the jet is

F = ApR Д0.

A vortex of strength per unit length along the jet of у would produce a reaction of

F = pVyR A0.

The jet flap

Hence, equating these two forces, we can calculate the action of the jet on

The jet flap Подпись: (7-8)

the flow external to the jet by replacing the jet with a running vortex strength yj given by

The total lift on the airfoil is equal to the sum of the lift due to the circulation around the airfoil and the vertical component of the jet reaction.

L = pVTc + trijVj sin (a + 5). (7-9)

Подпись: Уі = Подпись: — mjOj cpy pV dx2 Подпись: (7-10)

It is of interest to consider further the contribution of the jet in light of (7-8). For a nearly horizontal jet with a large radius of curvature (7-8) becomes

where x is distance downstream of the airfoil and у is the vertical location of the jet sheet positive downward. This can be integrated from x = 0 to x = oo to obtain the total circulation around the jet Г}.

~mjvj f*

PV Jo

Подпись: cPy dx2
The jet flap Подпись: dx

Tj = у dx

dy/dx is zero at infinity and for small angles is equal to a + 3 at x = 0. Hence Tj becomes

Г,. = ^(а + <5). (7-11)

Hence from (7-11) the total lift becomes

L = pV(Tc + Г j). (7-12)

If (7-12) is divided by %pV2c, the airfoil lift coefficient is obtained as

Подпись: 2Г,тл’

Because the jet is ultimately turned in the direction of the free stream, the thrust produced is theoretically equal to the flux of jet momentum:

T = mfj

Подпись: or in dimensionless form

Подпись:C – T T %pV2c

= CL

Подпись: Fig. 7-5. Airfoil and jet vortex system.

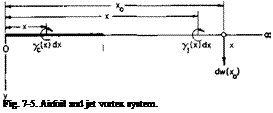
We are now in a position to formulate the boundary value problem which must be solved to determine Гс and Г,. Referring to Fig. 7-5, the

airfoil, which lies on the x-axis between 0 and 1, is replaced by a running vortex strength of yc(x) given by

7c(x) = Vf(x). (7-15)

The jet sheet lies between x = 1 and сю and is represented by the vortex distribution given by (7-10). In a manner similar to that for thin airfoil theory both у-distributions are assumed to lie along the x-axis, and the boundary conditions are also satisfied along the x-axis.

Now consider the velocity induced downward at a location x0 by the two vortex distributions. This can be calculated as

Подпись: x), . Г ycdx f00 Jjdx Ч*0) = ———- + —1

The jet flap Подпись: (7-16)

Jo 27c(x0 – x) J1>0 2л:(х0 –

Подпись:

The jet flap Подпись: (7-18)

For a flat plate airfoil at an angle of attack of a ^ = a for 0 < Xn < 1

2na., 0 < x0 < 1, (7-19)

2я/(:х0), *o > 1. (7-20)

Подпись: 4 f(x) dx *°° y"(x) dx Jo xo ~ x 2 J i,o *o - * f1 f(x) dx f00 fix) dx Jo *o - * 2 ji x0 - X

Hence (7-16) becomes a pair of simultaneous integro-differential equations

subject to the boundary conditions

/(1) = a + S,

/(со) = 0.

From here on the reduction and solution of Eqs. (7-19) and (7-20) become an exercise best left to the mathematician. The ultimate solution is not expressible in closed form. However, those students who are mathe­matically inclined are urged to refer to the original reference by Spence for a very challenging analysis.

The numerical results of Spence’s solution have already been presented in the form of Eqs. (7-3) and (7-4), which are simply interpolated fits to the results that hold closely for C„ values up to 10. These theoretical calculations agree remarkably well with experimental results, even for flap deflections as high as 60°, where we would expect serious departures from linearized theory.

The slope of the lift curve for ordinary airfoils is less than that predicted from thin airfoil theory and is attributable to the growth of the boundary layer which relaxes the Kutta condition at the trailing edge. In the jet – flapped airfoil the jet definitely fixes the trailing edge condition. In fact, the slope of the lift curve is higher for the jet-flapped airfoil than thin-wing theory predicts. This discrepancy is attributable to the effects of finite thickness. An allowance for thickness can be made by assuming that it affects the lift resulting from circulation around the airfoil as it does in the case of C,, = 0. For an ordinary airfoil of thickness ratio t/c the lift is higher than that predicted by thin airfoil theory by a factor of approxi­mately (1 + t/c). Thus Eq. (7-13), corrected for thickness, becomes

The jet flap

c‘ = Vc f1 + 0 + c"(a + 5)

Подпись: CL = F Подпись: Ci,8 + C,aa Подпись: — CM (а + 8) с Подпись: (7-21)

Equation (7-1), corrected for thickness ratio and aspect ratio, therefore becomes

where dCJda. and dC,/d5 are obtained from Fig. 7-2 or Eqs. (7-3) and (7-4) and F, from Fig. 7-3 or Eq. (7-6).

Reference 4 offers two additional corrections to (7-21) to account for part-span flaps and fuselage cut-out; X and v are presented as corrections to the lift increment resulting from jet deflection 8 and wing incidence a, respectively. These corrections are obtained from such relatively simple considerations as

Я = | (7-22)

_ S'(dCJda) + (5 – S"KdCl/da)’Cu=0 V S{dCJd a) ’ 1 " ’

Подпись: CL = F The jet flap Подпись: + v Подпись: '8Ci da. Подпись: a The jet flap
The jet flap

where S is the gross wing area and S’ is the reference wing area corre­sponding to the spanwise extent of the jet slot. CL, based on S, then becomes

The derivatives in (7-24) are understood to be for two-dimensional, or infinite aspect ratio, thin wings. CM is also based on S.

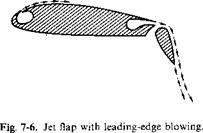
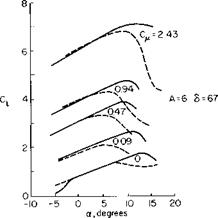
So far we have been concerned only with the increments to CL and not with the maximum value of CL that can be obtained with a jet-flap. There are two effects that must be considered as limiting CL. First is the real-fluid effect of the flow separating from the upper surface of the airfoil and second is the limiting effect on CL for finite aspect ratio wings due to the deflection of the trailing vortex sheet discussed in Chapter 3. It is somewhat risky to generalize on CLmax for jet flaps in view of the many complications involved. At low Сц values the jet-flapped airfoil tends to be limited by leading-edge separation. This causes a slight decrease in the incidence angle of one or two degrees at which Ctmax is obtained, as compared with the Cw = 0 case. As Сц is increased above approximately 2, however, the boundary layer control afforded by the jet apparently prevents leading-edge separation and results in increases in a for Cimax as great as 6 to 8° at Сц of the order of 7. Leading-edge separation can be reduced by the use of drooped leading edges or highly cambered thick sections. Leading-edge blowing is also another means of preventing leading-edge separation, as shown in Fig. 7-6.

The effect of Cp and nose droop on the CL versus a curve, shown in Fig. 7-7, is taken from Ref. 4. At each См the effect of the droop is to increase the incidence angle for stall about 5°. From this figure the difference “max — “max (C„ = 0) is plotted versus Сд and presented in Fig. 7-8. Also plotted on the figure are some points taken from Ref. 5. In the absence of actual test data it is recommended that this curve, together with the methods of Chapter 6, be used to estimate Cimax for a jet-flapped wing. For extremely

The jet flap

The jet flap

The jet flap

Fig. 7-7. Effect of leading-edge droop on stall:—————————————————————- basic leading edge;

———- drooped leading edge.


Подпись: (Cu=0),degrees

Fig. 7-8. Effect of C/t on incidence angle for stall.


The jet flap

high values of predicted C, max, however, that part due to circulation after the jet reaction has been subtracted should be checked against the limiting CL as a function of aspect ratio derived in Chapter 3.

Pitching Moment

The nose-down pitching moment of a jet flap is high for two reasons. First, the center of pressure of the circulatory lift moves aft with increasing Cfl and second the vertical component of the jet reaction acts at the trailing

The jet flap

Fig. 7-9. Theoretical change of Cm with C,.

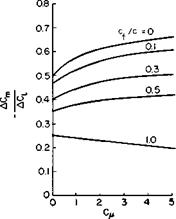
edge. Theoretical values of the change in pitching moment with lift co­efficient change due to flap deflection only, as obtained by Spence [4], are presented in Fig. 7-9. Values of cfjc from 0 to 1.0 are covered. In general, for a flat-plate airfoil Cm would be written as

The jet flap

where (dCJdC,)3=conslani is obtained from Fig. 7-9 and the (<5C,/d<5)0=conslant is obtained from Fig. 7-2. The corresponding derivatives with respect to a, with S a constant, are obtained from the same figures with cf/c = 1.0.

Experimental results are not included on Fig. 7-9, but in general they agree reasonably well with the theoretical predictions.

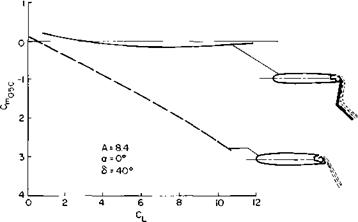
A possible method of counteracting the high nose-down pitching moments associated with jet flaps is given in [5]. In Fig. 7-10 a double-hinged flap is used to redirect the jet reaction to a point forward of the trailing edge. In the present case it was directed through the midchord point. A significant improvement in Cm as a function of CL resulted.

The jet flap

Fig. 7-Ю. Effect of double-hinged flap on midchord pitching moment.

Downwash

A problem to be overcome with the application of jet flaps is the large amount of downwash produced at the horizontal tail. It appears useless even to consider theoretical estimates of the downwash, for experiments have shown them to be in considerable error. Instead, some experimental measurements taken from Refs. 4 and 5 are presented in Fig. 7-11 which should be of some help in estimating the downwash angle e. It becomes readily apparent that all-movable tails will have to be used with jet-flapped aircraft, for downwash angles of the order of 30° may be encountered.

Effect of Sweepback on Flap Performance

Reference 1 contains information of the effect of sweepback on the lift, drag, and pitching moment changes caused by flap deflection. Admittedly, the scatter in the available data is rather large, but trends are established. Because of the thickening of the boundary layer at the tips of sweptback wings and the increased loading at the tips, CLmax would be expected to decrease with increasing sweepback. The increment in CLmax appears to decrease approximately as the cube of cos A, although there is no analytical substantiation for it. ACD seems to decrease approximately with cos A. The increment in the pitching moment is complicated by the fact that, because of the sweep, changes in the spanwise loading distribution can affect the pitching moment as much as changes in the section moment coefficients. It is recommended that an analysis of the spanwise loading distribution be performed to determine CM for the sweptback wing relating CM to CL according to Eq. (6-23).

Example

For illustrative purposes consider an aircraft equipped with 30% c Fowler flaps extending 65% out along the span. The horizontal tail is located three mean chord lengths aft of the wing aerodynamic center. The rectangular wing has an aspect ratio of 5.0 and is 15% thick. What is the maximum trim lift coefficient and what flap deflection is required to achieve it?

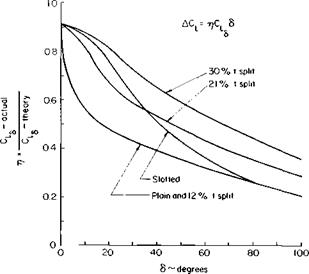
Based on the extended chord, the 30% Fowler flap becomes a 23% c flap; hence Cl6 is 3.9 C,/radian from Fig. 6-3. This must be corrected for nonlinearities (see Fig. 6-8). Using the curve marked “slotted,” we find that a maximum value of jj<5 occurs for a d of 60° and is equal to 22.2°. Hence AC, equals 3.9 (22.2)/57.3, or 1.51; AC, max is only two thirds of this amount, or 1.01. Assuming a sufficiently high Reynolds number, the unflapped C, max for an 11.5% (30% more chord) thickness ratio would be approximately 1.6, depending on its camber. Hence C, max for the two-dimensional section with flaps would be approximately 2.6. However, AC, max must be corrected for partial-span effects (see Fig. 6-20). Compared with the full-span case,

ACLmax is only 69% as great for a bf/b of 0.65. Also, it should be reduced approximately 27% to account for the fuselage. Hence ACLmax = 1.01 (0.69) (0.73) = 0.51, so that CLmax equals only 2.11. This also must be corrected for tail download.

Подпись: ACV AC, Подпись: = -0.28 (0.65) Подпись: -0.181.

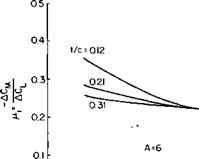
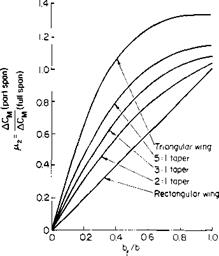
Referring to Eq. (6-13) for the extended chord c/lT = 1/2.3, we find that fi1 and fi2 equal 0.28 and 0.65, respectively (see Figs. 6-23 and 6-24). Hence ACM is calculated from (6-24) as

Подпись: AC, Подпись: = 0.51 1 Подпись: 0.18 ~23

Hence AC, corrected for trim becomes

= 0.47,

Effect of Sweepback on Flap Performance

so that the final predicted CLmax, based on the actual chord and remember­ing that only 65% of the wing is flapped, would be equal to 2.48.

(b)

A discussion of high-lift devices can also be found in Chapter 8 of Ref. 7. In particular, the reader is referred to that reference for a discussion of the geometry of slotted flaps. The performance of a slotted flap can depend quite critically on its geometry. Just “any old” slot will not do the job. For example, Ref. 7 shows that the optimum slot width (for a particular case) is about 1.5% of the chord. Increasing this to 3% of the chord decreases C, from 2.8 to 2.5.

•max

Some mention should also be made of slots and slats before closing this chapter. The leading-edge retractable slat and leading-edge slot shown in Fig. 6-27 are very similar in appearance and action except that the slat may extend the chord and can be positioned for maximum benefit. When used alone a well-designed leading-edge slot can increase C, max by as much as

0. 80. When used in combination with a trailing-edge flap, the increment due to the slot is only about half this value.

Nose Flaps

Nose flaps are probably not so important to V/STOL applications as trailing edge flaps, for they appear to be advantageous only to thin sections used for high-speed applications. High-speed V/STOL applications will probably depend on direct-lift engines or fans-in-wing for their high lift. Nevertheless, for completeness some discussion of nose flaps is warranted.

Nose Flaps

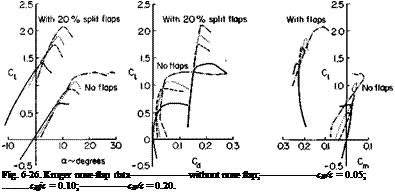
Two forms have been developed, the Kruger flap and the plain leading – edge flap. Kruger’s nose flap is hinged at the leading edge and rotates out from under the wing to an optimum position of about 130°. The Kruger flap has no marked effect at angles of attack below the stall, but rather it prolongs the lift curve and delays the stall for several degrees. Figure 6-26 presents some data on this type of flap obtained from Ref. 1.

The plain leading-edge flap appears to have the advantage over the Kruger flap in that its geometry can be varied in a more continuous manner. Hence increments in lift, drag, and pitching moment would take place in a continuous manner and not in a sudden jump, as with the Kruger flap. A variety of settings, coupled with the trailing-edge flaps, can be used to provide a variable camber wing. Tests made at RAE of a 20% c leading – edge flap and a 7^% thick bi-convex section with the flap down about 30° showed an increase in CL of about 0.4.

"max

Finite Wings with Flaps

Two questions are considered here: first, the calculation of C, max for a finite wing and, second, the behavior of a wing below stall with flaps.

Consider an elliptic wing, that is, one with an elliptic lift distribution. In this case the section C, is constant and equal to the wing CL. Hence at stall the section C, is everywhere the same and equal to the section CImax so that the wing CLmax must equal the section C, max. For this case, therefore, there is little or no dependence of Ctmax on aspect ratio. Next, consider a wing for which the section C, is not constant but which varies across the span. As the wing CL increases, the C, at each section must increase until finally at some section the section C, will equal the section C, max at that location. Because CL is an integrated average of the section C,’s, the highest C, at which stall first occurs will be higher than CL. Hence in this case CLmax will be less than C, max. However, for geometrically similar wings of varying aspect ratio, for example, tapered wings of the same taper ratio, CJCL is constant for the same relative spanwise location. Thus, even for a non- elliptic distribution, CLmax should not depend to any significant extent on the aspect ratio.

This nondependence of C, max on aspect ratio is shown rather clearly in Fig. 6-18. Here, both two – and three-dimensional wing data on C/max is presented as a function of Reynolds number. Little if any difference is noted between the section C, and the three-dimensional C,

CLmax is most effected by wing twist and planform taper. In order to estimate CLmax for a twisted tapered wing, we must estimate the distribution of the section C, for a given wing CL and compare the section C,’s with the section Cimax. Although elaborate lifting surface or lifting line techniques can be used to estimate the spanwise distribution of C,, it is questionable whether the accuracy of the Ctmax prediction justifies the effort. Relative effects of changes of geometry on CLmax can be predicted fairly well on the basis of Schrenk’s approximation for calculating spanwise load distribu­tions. This approximation assumes the loading distribution to be equal to

Finite Wings with Flaps

4 5 6

Re x 10’*

1.8

1.6

1.4

1.2

Ci

1.0

umox

vmox

0.8

0.6

0.4

0.2

0

О


□ 23015

V 23015

S (2151-418) (3181-018? (261-0161 164(261-418) X (65(318)-018 > (66(261-06) (64(26) —4ЙІ o{65(3l8)-OI8} (66(261-06)


2- dimensional

3- dimensional


2-dimensional


3-dimensional with fusetoge 3 – dimensional without fuseloge


10


8


Finite Wings with Flaps

Finite Wings with Flaps

Fig. 6-18. Comparison of two – and three-dimensional СІшм’s.

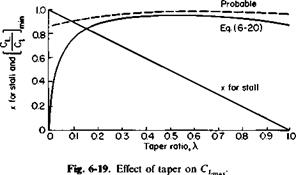
the average of an elliptic distribution and a distribution proportional to the chord.

Equation (6-20) is plotted in Fig. 6-19. If CL for C, = C, max is assumed to be equal to CLmax, then (6-20) predicts less than a 7% variation in CLmax for taper ratios from 0.2 to 1.0. Actually, the variation will be less than that. Although C, may equal Cimax at one particular section, the other sections are below stall and will develop increased lift with an increase in the wing angle of attack. The ratio of CL to CLmax is therefore higher than predicted by (6-20), being more like the dashed curve in Fig. 6-19.

Most tapered wings incorporate washout, which is a negative twist of 4 or 5° that reduces the section C, near the tip and improves aileron control at high wing CL’s.

It would appear that the designer can do no wrong; C/max varies little with flap type, airfoil section, aspect ratio, or taper ratio. This is almost
true. Unless extremely thin airfoil sections or low taper ratios are used, we can expect a CLmax from a wing with full-span flaps of about 2.5 to 2.7.

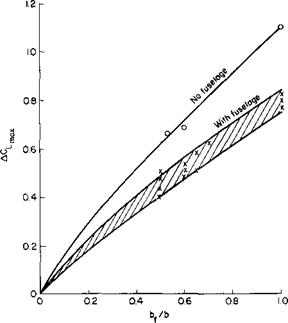
Most aircraft employ only partial-span flaps because of the span taken up by the ailerons. Thus the value of C, of about 2.7, which can be obtained with full-span flaps, is reduced to the order of 2.2 because of the incomplete flap. Experimentally and theoretically, it is found that ACimax due to flaps increases nearly linearly with the flap span. Figure 6-20 presents a limited amount of data on the variation of ACimax with bf/b, the ratio of flap span to wing span. Most of the loss in ACLmax due to ailerons can be regained if we are willing to employ “drooped ailerons.” Here both ailerons are lowered to serve as plain flaps. However, care must be taken to ensure adequate aileron control.

Finite Wings with Flaps

Notice the effect of the fuselage on CLmax. From Fig. 6-18, without flaps, the fuselage has little or no effect. With flaps, however, ACLmax is reduced about 30% due to the fuselage, as can be seen from Fig. 6-20.

For flapped wings operating below the stall Ref. 1 offers a treatment of flaps that is a mixture of analytical and empirical relationships for different types. For a finite wing with partial span flaps Ref. 1 expresses ACL, based on the extended chord, as

ACL = F(A) Х^У^д) X3(^J,

Finite Wings with Flaps Finite Wings with Flaps Подпись: (6-21)

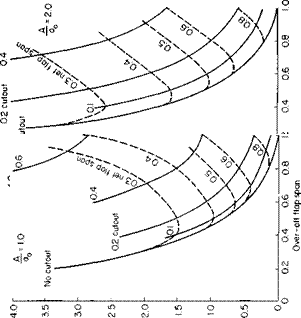
where F(A) is comparable to the variation of the lift curve slope with aspect ratio, /_! is comparable to i, the flap effectiveness, k2 is equal to the product of r] from Fig. 6-8 and S, and 23 is the effect of partial span flaps. Hence, with the present notation, it is recommended that ACL below stall be calculated from

a0 is the slope of the section lift curve and is approximately equal to 0.1 C,/deg; dCJda. is the slope of the wing lift curve and can be obtained from Fig. 3-17 or Eq. (3-55); A3 is obtained from Fig. 6-20 and is equal numerically to ACLmax at bf/b divided by ACLmax for bf/b = 1.0. When a flap has a central cutout so that the spanwise positions of its inboard and outboard ends are at bfJ2 and bfJ2 from the center line, respectively, the part span correction factor is

Finite Wings with Flaps

The increment in profile drag coefficient due to flaps is expressed in Ref. 1 by

АСВо = г1^)г2(5)йз^- (6-22)

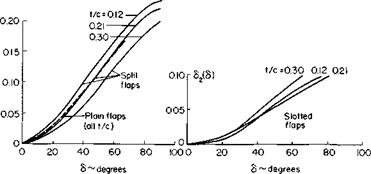
The function d2(S) for different flaps is given approximately by a constant times sin2 <5.

For split flaps

d2 ^ 1.1 sin2 S.

The functions and b2 are presented in Figs. 6-21 and 6-22; <53 is simply the ratio of the flapped wing area to the total wing area.

Finite Wings with Flaps

Finite Wings with Flaps

Fig. 6-21. Factor to calculate drag increment due to flaps.


Подпись: 8,(8)

Finite Wings with Flaps

The increment in pitching moment coefficient is nearly proportional to the increment in the lift coefficient. For full-span flaps

ACM = -/x, ACL. (6-23)

For part-span flaps (6-23) is multiplied by another function n2(bf/b).

ACM = – цфг Aci. (6-24)

Finite Wings with Flaps

o1—— 1—— 1—— 1—– ‘

0 01 0.2 0.3 0.4

Fig. 6-23. Factor for calculating increment in pitching moment.

Finite Wings with Flaps

Finite Wings with Flaps

Finite Wings with Flaps
Подпись: Fig. 6-25. Factor for calculating induced drag of elliptic wing with part-span flaps and cutout.

The functions /л1 and ц2 are given in Figs. 6-23 and 6-24. Approximately = 0.25, which means that the increment in CL produced by the flap acts approximately at the center of the flap.

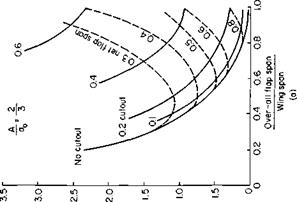
The flap may also have an appreciable effect on the induced drag. A method of correcting for this is also given in Ref. 1, in which ACD. is given by

ACDt = ^ (AQ)2. (6-25)

The function К is presented in Figs. 6-25a, b, and с; К depends on the flap span, cutout, and aspect ratio.

Two-Dimensional Unpowered Flaps

The trailing edge flap, considered first, can be divided into two types: those that extend the chord when deflected and those that do not. The Zap, Fowler, and most slotted flaps fall into the first category and plain or

167

Подпись: Split flap
Two-Dimensional Unpowered Flaps

Fig. 6-1. Types of flap.

split flaps to the second. Obviously a flap that extends the chord will look better than one that does not if C, max is based on the unextended chord length. To make a rational comparison of one flap type against the other, the actual or extended chord is therefore used here. For example, a value of C, max quoted for a 30% chord Fowler flap in the literature was divided by 1.3 to compare with theory or experimental results of a plain flap.

There are several questions that must be answered in the application of any flaps:

1. How much does C, increase with flap deflection angle at an oc below

the stall?

2. How much does C(max increase with flap angle?

3. How does Cm vary with flap angle?

4. How does Cd vary with flap angle?

To answer these questions let us first consider thin airfoil theory, developed in Chapter 3, applied to a plain flap.

The chordwise vorticity distribution is expressed there in a Fourier series (3-7) with the coefficients given by (3-10). Referring to Fig. 6-2, we note that the angle of attack of the chord line with the flap deflected, aeff, is

ac + be,

aeff = ———————

C

or

c Cr

aeff = a + §—-

c

Подпись: (6-1)
Two-Dimensional Unpowered Flaps

Подпись:

Two-Dimensional Unpowered Flaps
Подпись: aeff ^
Подпись: Over the flap the slope is
Подпись: * . s(c-L - 1 dx c
Подпись: Thus, according to (3-10),

These equations, of course, assume small angles.

From (3-16) the lift coefficient of the flapped airfoil becomes

С, = 2k + 2<5 sin 0f

or

Подпись:Cj = 2kol + 2(л — 6f + sin 0f) 8.

From the above C, can be written as

C, = 27t(a + xd)

where t is the flap effectiveness factor given by

. 0r — sin 0f

X = 1—————– ———————– -•

к

t is seen to be an effective rate of change in the angle of attack with 8.

The moment coefficient about the aerodynamic center, as given by (3-19), becomes for the flapped airfoil

Cm. c= -(gsin^. (6-7)

One other quantity of importance to a flap is the hinge moment. This quantity can be obtained from

H = – pV f y(x – xf)dx (6-8)

Jxf

or in dimensionless form

Подпись:H

%pV2C2

= —j* [л/-1 +. C°S ^ + Yj An sin «0 j(cos 0f — cos 0) sin 0 dO.

The expression for Ch can be easily evaluated, but the result is not expressible in closed form. However, from Eqs. (6-2) and (6-3) it can be seen that C,, C„ac, and Ch are all expressible in the form

c, = C, d + c, ts

= Cms8,

Ch = Cha + ChS,

Two-Dimensional Unpowered Flaps Подпись: (6-9)

where, for example,

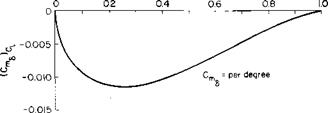
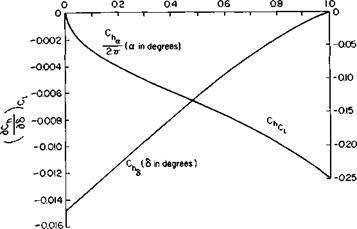
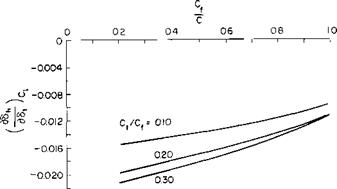
The partial derivatives in (6-9) are a function of the ratio of flap chord to airfoil chord. Theoretical values of these derivatives are presented in Figs. 6-3, 6-4, and 6-5. In addition, a derivative Chii is presented in Fig. 6-6. This

Two-Dimensional Unpowered Flaps

C

Fig. 6-3. Change of lift coefficient with flap angle and chord.

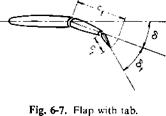
is the rate of change of hinge moment for the flap with tab deflection for the flap with a tab shown in Fig. 6-7.

The above is a linearized theory, the results of which must be used with caution. Consider first the derivative Cla. The departure of Cia from the theoretical in the physical case is so severe that the theory is rendered

C

Two-Dimensional Unpowered Flaps

Fig. 6-4. Change of moment coefficient with flap angle and chord.

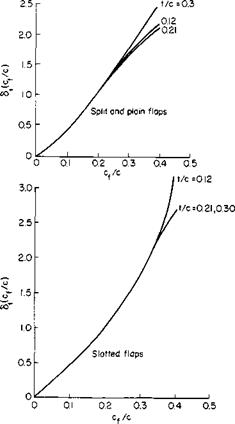
almost useless. Nevertheless, the theoretical values of Ch are used as the basis on which to predict the actual value. Based on Ref. 1, a correction to C, d is presented in Fig. 6-8, which is a function of S. Thus the theory’s primary value lies in predicting the relative effect of flap chord and not the effect of & By the use of Figs. 6-3 and 6-8 we determine the increment in C, below the stall from

AC, = r, ClaS

or, in terms of t, the flap effectiveness factor,

AC, = г]2пт5.

c

Two-Dimensional Unpowered Flaps

Fig. 6-5. Change of hinge moment with 6 and C,.

Two-Dimensional Unpowered Flaps

Fig. 6-6. Change of hinge moment with tab deflection.

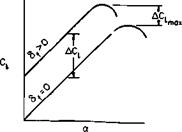
If the airfoil were to stall at exactly the same angle of attack with the flap deflected as without, the increment in C, would also be the increment in

Two-Dimensional Unpowered Flaps

Unfortunately, this is not the case. The stalling angle may decrease as the flap angle increases so that the increment in Clmax would be less than the increment in C, in the linear portion of the lift curve. This is illustrated in Fig. 6-9. In general, at the higher Reynolds numbers (6 x 10⁶ or above).

Two-Dimensional Unpowered Flaps

Fig. 6-8. Correction to theoretical C,..

the increment in C, is only about two-thirds of the increment in C, below

‘max » *

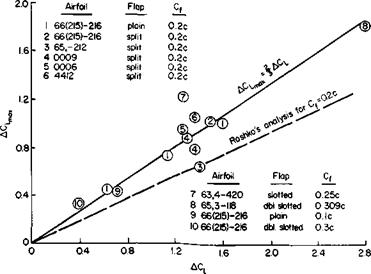
stall. This is based on data taken from Ref. 2 for several different airfoil – flap combinations shown in Fig. 6-10.

A prediction of the increment in C/max, applicable to a thin airfoil, is presented in Ref. 3. The developments are based on the fact that stalling occurs at the nose of a thin airfoil near the suction peak on the upper surface. The boundary layer profile in the nose region depends on the location of the stagnation point. Hence at stall, for different thin airfoils, the stagnation point should have the same location for all cases relative to the suction peak.

Two-Dimensional Unpowered Flaps

Fig. 6-9. Stall performance of a flapped airfoil.

Two-Dimensional Unpowered Flaps

Fig. 6-Ю. Increment in versus increment in C,.

For a cambered airfoil we define otf as the ideal angle of attack in which the lift is obtained from camber alone with no suction peak on the nose. The suction peak then depends on the departure of a from a*. For a sym­metrical airfoil a,- = 0. If, therefore, a symmetrical airfoil stalls at an angle of arao, a cambered airfoil would stall at an angle of am where

The angle a,- must be such that A0 from Eq. (6-2) is zero. Hence

Подпись: and

– -£)*•

The increment in C, max would thus equal the increment AC, in C, in the linear portion of the curve due to d, minus the product of amo — am and the slope of the lift curve;

Подпись: (6-10)Подпись:Подпись: (6-11)

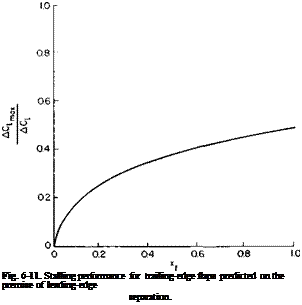
Two-Dimensional Unpowered Flaps Подпись: sin Or

AClmax = 2(n -6, + sin ef)d – (l – °^j2n5, or, in terms of AC,,

Equation (6-11) is presented graphically in Fig. 6-11. For 20% chord trailing edge flaps AC, mJAC, is about 0.48. This value is low in comparison with the data of Fig. 6-10. However, remember that the premise for Fig. 6-11 is leading-edge separation, which implies thin airfoils and low Reynolds numbers.

Подпись: Fig. 6-11. Stalling performance for trailing-edge flaps predicted on the premise of leading-edge separation.

As mentioned previously, in comparing the aerodynamic performance of

different types of flaps, we should consider the extension of the flap, if any, when deflected. Fowler flaps, for example, always exhibit much higher values of C, max than plain or split flaps. However, a large portion of the increment in C, for Fowler flaps arises from the increase in chord instead of an improvement in its stalling performance. The extensible chord is also the reason why the slope of the lift curve apparently increases with flap deflec­tion, for C, is based on the original chord.

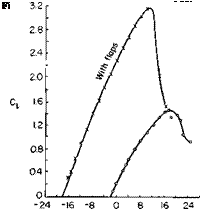
To emphasize the above consider Fig. 6-12 taken from Ref. 2. The lift curve presented here is for a slotted flap with a large tab. The 30% chord

Two-Dimensional Unpowered Flaps

37°

flap angle is 37°, whereas the 10% tab is deflected an additional 30°. When deflected, the flap increases the chord by 20%. For the undeflected flap the slope of the lift curve is approximately 0.106 C,/degree with a C, max of 1.43. With the flap deflected the slope of the lift curve apparently increases to 0.125 C,/degree and C(max, to 3.10. However, based on the extended chord, these values are only 0.104 and 2.58, respectively. At a = 0, AC,, when based on the actual extended chord, is 1.7. Hence the value of AC, of 1.15 for a AC, of 1.7 from Fig. 6-10 is about what we would expect from a plain or split flap. The important point is made here that there is little significant difference in the performance of all types of unblown flaps when based on the actual chord of the airfoil with the flap extended. A survey of available
data on split, plain, slotted and double-slotted flaps has revealed the some­what unexpected result that, when based on the extended chord at a Reynolds number of 6 x 10⁶ or higher, the maximum attainable C, is nearly the same, or approximately 2.7, regardless of flap type.

Slotting apparently offers some boundary layer control at the lower flap angles, for the curve of C, versus <5 is more linear with the slotted flap than with the plain or split flap. However, in the region of CImax the flow over the upper surface of any flap is apparently separated from the surface.

Two-Dimensional Unpowered Flaps

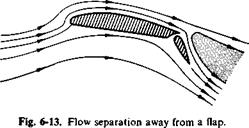
An interesting study of flap performance is reported in Ref. 4. Here an Army L-19 was modified and the flaps carefully faired so that tufts on their upper surfaces indicated that flow was attached. However, the measured value of Cimax was lower than would have been expected for attached flow. Subsequent observations showed that although the flow was attached at the surfaces a short distance away from the flaps the flow was separated and was not being turned by the flaps. This effect is illustrated in Fig. 6-13.

To calculate the highest C, max that could be expected from a flap system a rule of thumb value of 2.7, based on the extended chord, could be used. However, if C, max is needed as a function of 5, then Figs. 6-3, 6-8, and 6-10 should be used with the C, of the airfoil without flaps.

Two-Dimensional Unpowered Flaps Подпись: (6-12)

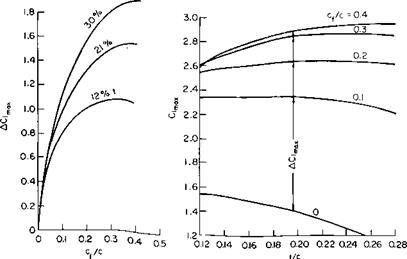
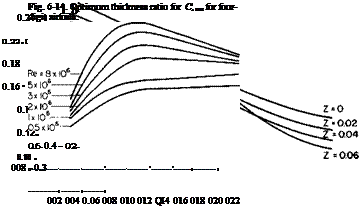
Reference 6-5 is an empirical correlation of airfoil data for four – and five-digit series NACA airfoils from which an estimate of C, max for the un­flapped airfoil can be made. For an unflapped four-digit airfoil the following empirical formula is presented for C,_______________________________ for a Reynolds number of 8 x 10⁶.

t, z, and p are thickness, camber, and position of maximum camber, respectively, expressed as a fraction of the chord. Figure 6-14, taken from this reference, presents the optimum thickness ratio for Qm as a function of Reynolds number for families of four-digit airfoils with maximum camber at midchord. At the lower Reynolds numbers laminar separation occurs near the nose, so that the optimum thickness increases with decreasing Reynolds number.

The variation of Cimax with thickness ratio for NACA 24XX airfoils for various Reynolds numbers is presented in Fig. 6-15. It can be seen that below a thickness ratio of approximately 12% Clmix drops off rapidly with decreasing thickness, whereas increasing t above 0.12 has only a gradual adverse effect onС/іп>х at the higher Reynolds numbers and none at the lower values of R.

Two-Dimensional Unpowered Flaps

Consider now the prediction of C, max at a high Reynolds number for a

Fig. 6-15. Variation of C, m„ with thickness ratio of NACA 2400 airfoils for various Reynolds

numbers.

25% chord, extensible slotted flap at a S of 80° on a 15% thick airfoil with 4% camber at the 40% chord location.

From Eq. (6-12) for the airfoil with no flaps

From Fig. 6-3

t = 0.52

From Fig. 6-8

tj = 0.26.

Therefore

A С, = 0.26(2яХ0.52) —

= 1.185

From Fig. 6-10, AC, m.x = f(1.185) = 0.79, C, m>x = 2.52 based on extended chord, or C;max = 3.15 based on original chord.

The effect of thickness and flap-chord ratio on C, m>x is shown in Fig. 6-16 for 23000 airfoils with split flaps. From this figure several observations can be made. First, a flap chord of at least 30% to probably no more than 50% is optimum for the highest C, max. The greater the thickness ratio of the section, the greater the flap chord ratio should be. The flap angle for maxi­mum CL decreases with increasing flap-chord ratio and increasing airfoil thickness ratio.

Trim Lift Coefficient

Deflecting a flap effectively changes the camber of an airfoil, hence changes its moment about its aerodynamic center. This moment change, for a positive flap deflection, is a nose-down one that requires a download on the tail of the aircraft for longitudinal trim. Hence part of the increased lift afforded by the flap must support the download of the tail so that not all of the AC, max can be used to support the weight of the aircraft. Referring to Fig. 6-17, defining lift increments and moment increments positively up­ward and nose upward, respectively, gives

AL (effective) = AL + ALT,

Two-Dimensional Unpowered Flaps

Two-Dimensional Unpowered Flaps

Fig 6-16. Split-flap data 230xx airfoils Re = 4 x 10⁶.

Hence

ACim„ (effective) = AC(max Гі + у д^-1- (6-13)

Because ACM/AC, max is negative, the effective value of AClmax is less than the wing AC, max. The difference resulting from the tail download required

Two-Dimensional Unpowered Flaps

Fig. 6-17. Longitudinal trim force and moment increments.

for trim is usually an appreciable portion of the weight of the aircraft and must be considered for most configurations.

Unpowered flaps

Introduction

A flap is a movable portion of the trailing or leading edge of an airfoil which can be deflected downward to increase the maximum lift coefficient of the airfoil. Many different types of flap have been used on aircraft, the selection of which involves considerations, in addition to aerodynamic performance, of mechanical complexity, cost, and weight. The effectiveness of a flap can be increased by injecting high-velocity air over its upper sur­face near the nose of the flap. This arrangement is referred to as a blown flap. The same effect as that produced by a flap can be accomplished by replacing the physical flap entirely with a jet of air deflected downward from the trailing edge of the airfoil, a scheme known as a jet flap. Sketches of unpowered flaps, the blown flap, and the jet flap are presented in Fig. 6-1. The leading-edge flaps, of course, are normally used in combination with a trailing edge flap.

Considerable data are available on flaps, but most of them are in a rather disorganized state. Reference 1 is an admirable attempt to bring order out of chaos. In addition to its summary curves, Ref. 1 contains an extensive bibliography of sources of information on specific flap configurations. How­ever, it falls somewhat short in that it treats the increment in the lift co­efficient below stall and not the increment in C, itself. This chapter does not present extensive data on the different types of flap, but there are enough to substantiate some of its general conclusions and observations.