Category Airplane Stability and Control, Second Edition

Fences and Wing Engine Pylons

Wing fences are streamwise panels on the wing’s upper surfaces. They are intended to interrupt and shed the wing’s low-energy boundary layer outflow (toward the wing tips) that would otherwise accumulate and cause flow separation and tip stall. Fences are found

Fences and Wing Engine Pylons

Figure 11.10 Stall patterns on a sweptback wing equipped with slat, leading-edge extension, and drooped-nose leading-edge flap. Initial tip stall is prevented in all three cases. (From Furlong and

McHugh, NACA Rept. 1339, 1957)

on some early swept-wing jets, such as the Comet 1, Sud Caravelle, Tupolev Tu-54M, and Gulfstream II.

The pylons for underwing jet engines can be a substitute for wing fences on high – aspect-ratio-swept wings. This was discovered by the Boeing Company, probably during the wind-tunnel test program for the B-47 airplane. Figure 11.11 shows how bound vorticity of a lifting wing induces sidewash at the nacelle-pylon combination, which in turn causes a sideload. The side-loaded pylon-nacelle combination creates a tip or edge vortex over the top of the wing, opposing the normal outward wing boundary layer flow, which tends to

Fences and Wing Engine Pylons

Figure 11.11 Wing bound vorticity induces sidewash on jet engine pylons. The pylon load creates an upper wing surface vortex that opposes the normal outflow of wing boundary layer, reducing the tendency to flow separation at the wing tips.

follow isobars on the wing and so reduces the tendency toward wing tip stall and airplane pitchup. This same phenomenon is taken advantage of on the B-52 and 707 airplanes, neither of which ever required boundary layer fences on the upper surfaces of their wings.

The Boeing 707 pylon-nacelle arrangement was adopted by the Douglas Aircraft Corpo­ration for the DC-8 airplane. On the DC-8, in addition to reducing spanwise wing boundary layer flow, the pylon-nacelle combination also caused early wing stall at the pylon locations. When fixed slots (opened only with full flaps) were put on the wing near the pylons to inhibit local stall, pilots complained of airplane pitch-up problems (Shevell, 1992). Pitchup was remedied by reducing slot size and later by cutting back the pylons to the location of the wing stagnation point at maximum lift coefficient. Cutting back the pylons also reduced local high-Mach-number “hot spots” on the wing’s upper surface at cruising speeds.

Douglas company aerodynamicists realized what a good thing pylon-nacelle combina­tions were during the wind-tunnel development for the DC-9 airplane, which had none. Fitting two pylon-nacelle combinations from the DC-8 model to the DC-9 model cured its tip stalling problems; removing the nacelles from the pylons worked, too. Finally, the pylons were reduced in size, streamlined, renamed “vortillons,” and patented. The spanwise vortillon location was chosen to produce desirable vortex flow at the tail, which up till then had been insufficient to recover from a deep stall.

The DC-10 airplane has large vortex generators, or strakes, on the sides of its nacelles to alter nacelle and wing stall behavior at high angles of attack. Nacelle strakes also are found on some Boeing airplanes, but on one side of the nacelle only. David A. Lednicer writes:

The story I have heard is that McDonnell Douglas [held] the patent for the use of strakes on both sides of the nacelle, so Boeing circumvented the patent by putting them on only one side.

Lifting Body Stability and Control

A lifting body is a wingless vehicle that depends on lift generated from an elongated body or fuselage. Both lifting bodies and ballistic shapes had been studied as space vehicles by NASA before the choice of the Mercury, Gemini, and Apollo ballistic capsule designs. However, lifting body research continued, first at the NASA Ames and Langley Research Centers, then at the NASA Flight Research Center (Reed, 1997). Figure 14.19 is a general arrangement drawing of a typical lifting body design, the NASA/Northrop HL-10 (Heffley and Jewell, 1972). Configurations such as the HL-10 have evolved into the space shuttle Orbiter and follow-up concepts such as the X-33 research vehicle.

Lifting Body Stability and Control

Figure 14.19 Three-view drawing of the NASA/Northrop HL-10 lifting body. (From Heffley and Jewell, NASA CR-2144, 1972)

Stability and control characteristics of a series of lifting bodies were investigated in wind – tunnel and flight tests starting in the mid-1950s in the United States and later in Russia, Japan, and France. All of the problems associated with swept wings and heavy fuselage loadings appeared in the course of these tests, in addition to a number of instances of control oversensitivity and pilot-induced oscillations. Lifting body configurations typically have high dihedral effect, or rolling moment due to sideslip, in proportion to roll damping. The coupled roll-spiral mode of motion (Chapter 18, Sec. 9) may thus exist.

Early Numerical Work

Useful solutions to Bryan’s equations of airplane motion for scientific or engi­neering uses are either roots or eigenvalues or actual time histories, which give airplane responses to specific control or disturbance inputs. Either type of solution was essentially out of the question with the means available in 1911. However, by 1920 Bairstow had found useful approximations that served as starting points for developing eigenvalues from the Bryan equations.

When, later on, research engineers in both the United States and in Britain generated time history solutions to the linearized Bryan equations, it was only with great labor. Early step-by-step numerical solutions were published for the S. E.-5 airplane of World War I fame by F. Workman in 1924. A year later, B. Melvill Jones and A. Trevelyan (1925) published step-by-step solutions for the lateral or asymmetrical motions.

As an advance over step-by-step methods, B. Melvill Jones (1934) applied the for­mal mathematical theory of differential equations to the linearized Bryan equations, pro­ducing a marvelously complete set of time histories for the B. F.2b Bristol Fighter at an altitude of 6,000 feet (Figure 18.5). A generation of pre-electronic-computer engineers struggled through those formal solutions. The complementary function is found first. In addition to using a considerable amount of algebra, one has to find the real and complex roots of a fourth-degree polynomial. The complementary function gives the time histories of the variables of motion under no applied forces and moments, but with arbitrary initial conditions.

The last step in the formal solution is finding a particular integral of the equations. This adds to the complementary function the effects of constant applied moments, such as are produced by deflections of the airplane’s control surfaces. In Jones’ own words, “The numerical computations involved… are heavy, they involve amongst other things, the solution of four simultaneous equations with four variables.” It is little wonder that numerical time history calculations languished for years, until electronic analog computers were commercially available, about the year 1950.

Control System Coupling with Elastic Modes

Coupling of the B-47’s yaw damper system with the airplane’s fuselage side­bending mode was resolved simply when the yaw damper’s rate gyro was relocated. That is, the rudder’s yaw damping action cut off at a low enough bandwidth that the side-bending mode itself was not reinforced.

The coupling of stability augmentation systems and airplane elastic modes takes on a new dimension for high-bandwidth control systems. If the flight control system is capable of interacting with the airplane’s structural modes, the stability of the combination must be assured. A conventional approach is gain stabilization, in which control system response at structural mode frequencies is attenuated by notch filters. The notch filters reduce rate gyro and accelerometer outputs in a narrow band around modal frequencies.

While effective, notch filtering invariably introduces lag at lower frequencies, which can adversely affect flying qualities. Phase stabilization (Ashkenas, Magdaleno, and McRuer, 1983) attempts to replace or supplement notch filtering by creating dipoles out of the

Control System Coupling with Elastic Modes

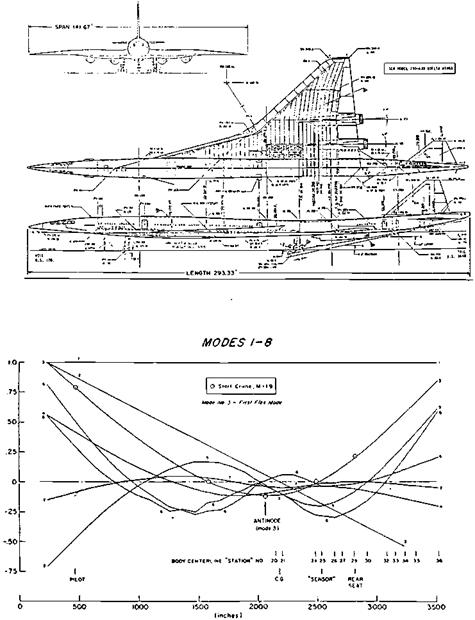
Figure 19.10 The first six normal modes at the centerline of a Boeing supersonic transport proposal, typical of the data used in the normal-mode method for the effect of aeroelasticity on stability and control. The modes are normalized in amplitude. Modes 1 and 2 are rigid-body plunge and pitch.

(From Ashkenas, Magdaleno, and McRuer, NASA CR-172201, Aug. 1983)

structural bending poles. The dipoles are the stable type referred to in the “Transfer Function Dipoles” section of Chapter 20, with the zero below the pole in the s-plane. Zero location for particular modes can be controlled by sensor location, but locations that produce stable dipoles for some modes will be wrong for others.

Bandwidth-Phase Delay Criteria

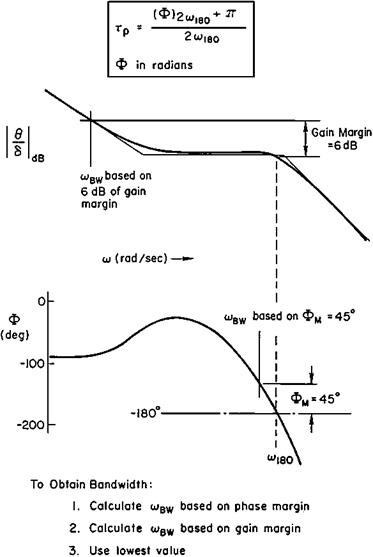
The insights furnished by the crossover model for compensatory operation lead to criteria that can be used in control system design, as in the Neal-Smith approach. An important example is the Hoh-Mitchell-Ashkenas bandwidth and phase delay criteria (Hoh, 1988), a combination of two individual metrics, illustrated in Figure 21.6.

The first metric is aircraft bandwidth, defined as the frequency at which the phase angle of attitude response to stick force input is -135 degrees. The aircraft bandwidth measures the frequency over which the pilot can control without the need for lead compensation. The second metric is phase delay, defined as the difference in response phase angle at twice the frequency for a -180-degree phase angle and 180 degrees, divided by twice the frequency for a -180-degree phase angle. The phase delay metric approximates the phase character­istics of the effective airplane dynamics, from the region of crossover to that for potential pilot-induced oscillations. Systems with large phase delays are prone to such oscillations.

Boundaries in aircraft bandwidth-phase delay space have been developed using flight and simulator pilot ratings and commentary. Similar boundaries have been especially useful for rotorcraft and special (translatory) modes of control. With these boundaries, designers are able to account for closed-loop pilot-airplane dynamics, using effective airplane dynamics alone. A related airplane-alone criterion based on the crossover model is the Smith-Geddes (1979) criterion frequency. Still another criterion based on airplane-alone dynamics places boundaries in the Nichols plane of the attitude frequency response (Gibson, 1995). The idea is to confine the attitude frequency response within boundaries defined by the best piloted closed-loop flying qualities. All of these boundary methods depend on simple correlation. They should be effective to the extent that new cases resemble those on which the boundaries are based.

Bandwidth-Phase Delay Criteria

Figure 21.6 Definitions of the bandwidth and phase delay criteria. (From MIL-STD-1797A, 1990)

Good design practice suggests using all of these criteria to examine airplane dynamics at issue.

Modern Stability and Control Teaching Methods

The digital computer has revolutionized the teaching of airplane stability and control, just as it has its practice. In precomputer times, flight dynamics students had to learn numerical techniques for factoring high-degree polynomials and producing linearized transient responses. Eigenvalues or roots of the equations of airplane motion were extracted by factorization, and the flight modes of motion were found.

Computer programs for root extraction and a great deal more are at the modern engineer’s fingertips, and present-day teachers of flight dynamics have found ways to use the digital computer to improve their courses. A few instances follow. Stanford University Professor Arthur Bryson’s book Control of Aircraft and Spacecraft uses Matlab® computer routines in many examples and problem assignments. For example, pages 199-201 show a student how to synthesize an optimal climb-rate/airspeed stability augmentation system using Matlab. As with other mathematics computer packages, Matlab is available in a low-cost student edition.

The State University of New York at Buffalo Professor William J. Rae assigns exercises that use a 6-degree-of-freedom computer program called SIXDOF to explore in detail the solutions of the nonlinear equations of airplane motion. This supplements normal instruction in the modes of motion and control theory using linearized equations. Still another approach has beenpursuedby University ofFlorida Professor Peter H. Zipfel. He makes available to his students a CADAC CD-ROM disk, with which to build modular aerodynamics, propulsion, and guidance and control computer models. As in the previous cases, students are able to solve realistic stability and control problems without getting lost in routine mathematical detail.

In France, Professor Jean-Claude Wanner, on the staffs of several universities, is devel­oping an advanced flight mechanics teaching tool, in the form of a CD-ROM. A stability volume computes the time response of an airplane specified by the user to control and throt­tle inputs, presenting results in the form of conventional strip charts, but also in real time as viewed from the cockpit or the ground. There are preliminary interactive chapters, including text and exercises, on subjects such as phugoid motion and accelerometer instruments.

The only cautions that might be applied to these modern approaches are the same ones that must be observed in the practice of engineering, using powerful digital computers. Both student and working engineer must keep in mind the assumptions that lie behind flight dynamics computer programs, their limitations as well as their capabilities. Good practice also requires reasonableness checks on computer output using independent simple methods.

Background to Aerodynamically Balanced Control Surfaces

When airplanes and their control surfaces became large and airplane speeds rose to several hundred miles per hour, control forces grew to the point where even the Gough – Beard-McAvoy force limits were exceeded. Pilots needed assistance to move control surfaces to their full travels against the pressure of the air moving past the surfaces. An obvious expedient was to use those same pressures on extensions of the control surface forward of the hinges, to balance the pressure forces that tried to keep the control surfaces faired with the wing.

The actual developmental history of aerodynamically balanced control surfaces did not proceed in a logical manner. But a logical first step would have been to establish a background for design of the balances by developing design charts for the forces and hinge moments for unbalanced control surfaces. That step took place first in Great Britain (Glauert, 1927). Glauert’s calculations were based on thin airfoil theory. W. G. Perrin followed in the next year with the theoretical basis for control tab design (Perrin, 1928).

Background to Aerodynamically Balanced Control Surfaces

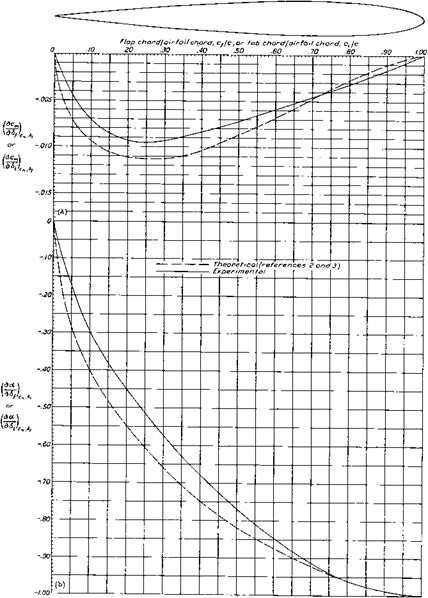
Figure 5.1 Pitching moment and control effectiveness parameters for plain flaps on the NACA 0009 airfoil, derived from pressure distributions. The dashed lines are Glauert’s thin airfoil theory. (From Ames and Sears, NACA Rept. 721, 1941)

The next significant step in the background for forces and hinge moments for unbalanced control surfaces was NACA pressure distribution tests on a NACA 0009 airfoil, an airfoil particularly suited to tail surfaces (Ames, Street, and Sears, 1941). Figures 5.1 and 5.2 compare those results with Glauert’s theory. The trends with control surface hinge position along the airfoil chord match Glauert’s thin airfoil theory exactly, but with lower flap effec­tiveness and hinge moment than the theoretical values. Ames and his associates developed

Background to Aerodynamically Balanced Control Surfaces

Figure 5.2 Hinge moment parameters for plain flaps on the NACA 0009 airfoil, derived from pressure distributions. The dashed lines are Glauert’s thin airfoil theory. (From Ames and Sears, NACA Rept. 721, 1941)

a fairly complex scheme to derive three-dimensional wing and tail surface data from the two-dimensional design charts. That NACA work was complemented for horizontal tails by a collection of actual horizontal tail data for 17 tail surfaces, 8 Russian and 3 each Polish, British, and U. S. (Silverstein and Katzoff, 1940). Full control surface design charts came later, with the publication of stability and control handbooks in several countries (see Chapter 6, Sec. 2.6).

5.2 Horn Balances

The first aerodynamic balances to have been used were horn balances, in which area ahead of the hinge line is used only at the control surface tips. In fact, rudder horn balances appear in photos of the Moisant and Bleriot XI monoplanes of the year 1910. It is doubtful that the Moisant and Bleriot horn balances were meant to reduce control forces on those tiny, slow airplanes. However, the rudder and aileron horn balances of the large Curtiss F-5L flying boat of 1918 almost certainly had that purpose.

Wind-tunnel measurements of the hinge moment reductions provided by horn balances show an interesting characteristic. Control surface hinge moments arise from two sources: control deflection with respect to the fixed surface (5) and angle of attack of the fixed or

Background to Aerodynamically Balanced Control Surfaces

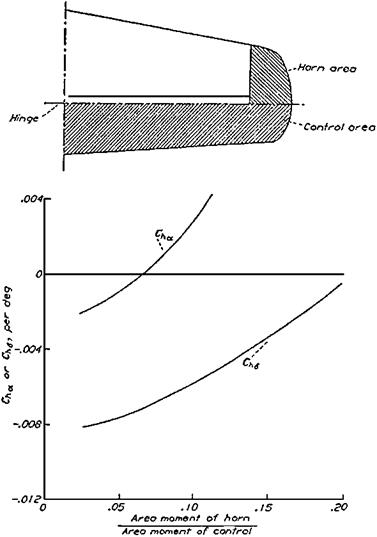
Figure 5.3 Typical hinge moment parameter variations with size for unshielded horn aerodynamic balances. The hinge moment due to angle of attack Cha is affected more strongly by the horn balance than by the hinge moment due to surface deflection Ch5. (From Phillips, NACA Rept. 927, 1948)

main surface (a). The relationship is given in linearized dimensionless form by the equation Ch = ChsS + Chaa, where the hinge moment coefficient Ch is the hinge moment divided by the surface area and mean chord aft of the hinge line and by the dynamic pressure. Chs and Cha are derivatives of Ch with respect to 8 and a, respectively. Both derivatives are normally negative in sign. Negative Ch8 means that when deflected the control tends to return to the faired position. Negative Cha means that when the fixed surface takes a positive angle of attack the control floats upward, or trailing edge high.

Upfloating control surfaces reduce the stabilizing effect of the tail surfaces. It was discov­ered that horn balances produce positive changes in Cha, reducing the upfloating tendency and increasing stability with the pilot’s controls free and the control surfaces free to float (Figure 5.3). This horn balance advantage has to be weighed against two disadvantages. The aerodynamic balancing moments applied at control surface tips twist the control sur­face. Likewise, flutter balance weights placed at the tips of the horn, where they have a good moment arm with respect to the hinge line, lose effectiveness with control surface twist.

A horn balance variation is the shielded horn balance, in which the horn leading edge is set behind the fixed structure of a wing or tail surface. Shielded horn balances are thought to be less susceptible to accumulating leading-edge ice. Shielded horn balances are also thought to be less susceptible to snagging a pilot’s parachute lines during bailout.

6.2.7.1 Vortex Lattice Methods

When the vortex lattice method is applied to wings, the surface is arbitrarily di­vided in the chordwise and spanwise directions into panels or boxes. Each panel contains a horseshoe vortex. The vortex-induced flow field for each panel is derived by the Biot-Savart

6.2.7.1 Vortex Lattice Methods

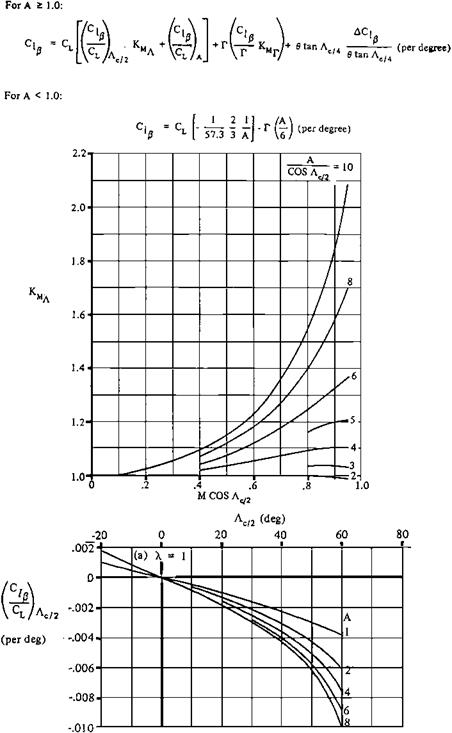
Figure 6.3 Example formula and charts from the USAF DATCOM. This covers only a small part of the material for calculation of the derivative C^ for straight-tapered wings. RAeS data sheets have similar functions and appearance.

law. While this implies incompressible flow, the Prandtl-Glauert rule can extend the results to subcritical Mach numbers. The boundary condition of no flow across panels is fulfilled at just one control point per panel. Angle of attack and load distributions for the panels are found from a system of simultaneous linear equations that are easily solved on a digital computer. Distortions in data due to Reynolds’ number mismatches, jet boundary correc­tions, and model attachment problems in real wind tunnels are replaced with the necessary approximations of computational fluid dynamics.

When the panels lie in a flat plane and occupy constant percentage chord lines on an idealized straight-tapered wing at more or less arbitrary spanwise locations, and when each panel contains a line vortex across its local quarter chord point and trailing vortices along its side edges, whose collective vorticity provides tangential flow at every panel local three – quarter-chord point, the bound vorticity in each panel can be found by desktop methods, as in the Weissinger method. However, when panels or a mesh cover a complete airplane configuration, automatic machine computation methods become necessary. Depending on the method used, the computer defines the vortex strength for each panel.

Criteria for Departure Resistance

The word “departure” is used for uncontrolled flight following stalls, the first stages of spin entry. Rather violent departures appeared with the advent of swept wings and long, heavily loaded fuselages, the same features that lead to inertial coupling. Pilots reported nose slices, whirling motions, wing rock, and roll reversals and divergences. There was interest almost at once in finding aerodynamic parameters specifically tied to these anomalies.

The initial search led back to stability and control’s early days, a time of high interest in Routh’s criterion and stability boundaries. Lateral stability boundaries are formed from the lateral characteristic equation

X4 + BXi + C Xі + DX + E = 0.

A necessary condition for stability is that the constants B, C, D, and E all be positive in sign. The last two constants, D and E, are associated with real roots, or convergences or divergences, rather than an oscillation.

In the lateral stability boundaries developed by L. W. Bryant in 1932 and by Charles H. Zimmerman in 1937, sign changes in D and E plotted as functions of static lateral and directional stability define the boundaries. Zimmerman specifically associated the constant D with directional divergence.

Two later investigators, Martin T. Moul and John W. Paulson, followed in Bryant’s and Zimmerman’s footsteps, but associated directional divergence with the constant C rather than D. Robert Weissman’s name is also associated with this development (Figure 9.10). Moul and Paulson coined a new term, “dynamic directional stability,” or C„^dyn for an approximation to C. This approximation is

Cnedyn = Cne cos a – (Iz/Ix)Ch sin a.

Together with another factor called “lateral control departure parameter” or LCDP, departures and post-stall gyrations, as well as roll reversals and tendencies to spin, are

Criteria for Departure Resistance

Figure 9.10 The 1972 Weissman spin susceptibility and departure boundaries. The curved lines are parametervalues forthe McDonnell Douglas F-4J and two variants (C and D) with improved departure resistance. (From Mitchell and Johnson, AFWAL-TR-80-3141, 1980)

correlated with stability derivatives. LCDP in particular, developed by Pinsker (1967), predicts high angle of attack nose slice departures while the pilot attempts to hold the wings level.

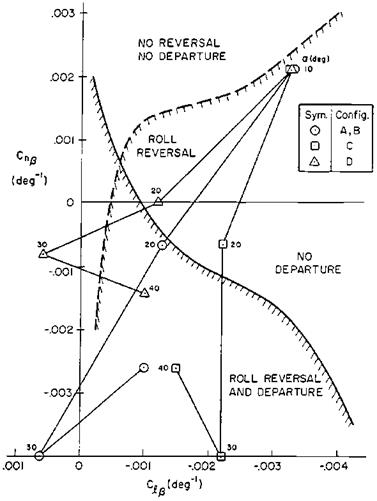
The pioneering work of Moul, Paulson, Pinsker, and Weissman in revisiting the Bryant – Zimmerman concept of stability boundaries for departures and post-stall gyrations was followed by several other noted investigators, who developed additional criteria for departure resistance. Figure 9.11 shows another set of departure and roll-reversal boundaries that are based completely on static aerodynamic derivatives (Bihrle and Barnhart, 1978). The advantage of using static derivatives in setting the boundaries is that they can be applied on the spot during conventional low-speed wind-tunnel tests of a complete model.

The Bihrle boundaries are based on digital simulation of a canned full control deflection maneuver involving an initial steep turn followed by full nose-up pitch control, then full opposite roll control. In papers given in 1978 and 1989, JuriKalviste and Bob Eller proposed coupled static and dynamic stability parameters that are based on separation of the full airplane equations of motion into rotary and translatory sets. These parameters amount to generalizations of the Moul-Paulson C„^dyn and LCDP parameters.

The level of sophistication of this work was raised by use of pilot-in-the-loop considera­tions, which are treated more fully in Chapter 21, “Flying Qualities Research Moves with the Times.” In the period 1976 to 1980, David G. Mitchell and Donald E. Johnston correlated

Criteria for Departure Resistance

Figure 9.11 The simplified 1978 Bihrie roll reversal and departure boundaries forthe case of adverse yawing moment due to aileron deflection. These simplified boundaries involve static parameters only and can be applied during a routine wind-tunnel test. In configuration A the circles apply to the unmodified McDonnell Douglas F-4J and the other symbols are for F-4J variants. (From Mitchell and Johnston, AFWAL-TR-80-3141, 1980)

some departure characteristics with airplane frequency-response parameters involved with pilot loop closures. Negative values of the lateral transfer function numerator term NSa causes roll reversal, for example. Mitchell and Johnston found two additional closed-loop departure parameters for either rudder or aileron maneuvering control that correlate with nose-slice departures.

The vexing question of just how far one can go in using departure criteria based on linearized aerodynamics, or the stability derivatives, is addressed in a paper delivered by Donald Johnston at a1978 AGARD Symposium on Dynamic Stability Parameters. Although the linearized parameters clearly have some predictive value, Johnston concludes:

the more common frequency domain linear analysis techniques applied to symmetric, frozen point airframe models may produce totally erroneous answers if the aircraft exhibits significant coupling due to sideslip. These same analytic techniques provide valid predic­tions incases where Cm, Cl, Cn are f (а, в) providing the frozen point model represents asym­metric trim conditions and the analytic results are not applied to в excursions through zero.

Calculations on the Vought A-7 airplane provide additional evidence of the importance of sideslip coupling on departures (Johnston and Hogge, 1976). Sideslip angles up to 15 degrees have a moderate stabilizing effect on the Dutch roll and longitudinal short-period modes of motion. However, the spiral and roll modes combine to form a new low-frequency or phugoid-type lateral mode, which is unstable at the higher sideslip angles. A pitch attitude numerator factor, or zero, moves to the right half of the s-plane with sideslip, creating a potential instability with pilot loop closure.

The presence of stability augmentation, such as roll rate feedback to the ailerons, clearly affects departures. Extension of the determinant of the equations of motion to include augmentation feedbacks produces modified departure criteria (Lutze, Durham, and Mason, 1996).

Peter Mangold of Dornier reviewed departure again, to account for the trend toward higher usable angles of attack, where forebody vortices from the nose, strakes, or canards dominate lateral-directional stability. From Mangold’s paper (1991):

For the older aircraft the dynamic [rotary] data were of minor influence and the departure characteristics in Weissman’s correlation were dominated by the static derivatives. High angle of attack characteristics of modern aircraft are more dependent on dynamic derivatives which are heavily influenced by forebody geometry.

Mangold goes on to reaffirm the validity of the Bryant-Zimmerman characteristic equa­tion approach in the modern context and offers four rules to follow to avoid departure, as follows:

1. Avoid autorotation tendency (Clp < 0) and maintain yaw damping (C„r < 0) in order to keep the B coefficient [not Zimmerman’s D or Moul’s C] of the characteristic equation greater than zero.

2. C„edyn must be kept larger than zero, since this parameter determines the C coeffi­cient.

3. Close to maximum lift, where Cir is considerably larger than 1.0, it is essential to maintain C„edyn > 0 with negative Cie and only slightly positive C„e.

4. Nonlinearities and hysteresis effects versus sideslip have to be avoided.

The interesting reason for the fourth rule is the inaccuracy of sideslip sensors at high angles of attack, which makes it difficult to schedule control laws to cope with the problems of nonlinearities and hysteresis.

Recognizing the ingenuity and skill of the developers of departure parameters, it is still possible to question the place of these parameters in modern design practice. Departure pa­rameters such as C„edyn and LCDP may remain of interest in preliminary design. However, in a sense, departure parameter research is working behind the curve of modern computer development. Designers responsible for the stability and control of expensive new airplanes will recognize the essential nonlinearity of the departure and spin problems and plan ex­haustive digital simulations to explore the full envelope of flight and loading conditions and control inputs. Automated analysis can stack cases on cases and then winnow out those of no interest by algorithms that scan the results.

There is still the major effort required to build aerodynamic data bases for such enter­prises. Furthermore, such efforts would presumably evaluate candidate stability or control augmentation schemes, as well. Augmentation schemes for fly-by-wire systems, such as

used on the Tornado, can produce care-free airplanes that cannot be made to depart under any pilot action. Departure parameters would be of interest after the fact, to help make sense of the results and as a guide to the future.

Theoretical Studies

The carrier-approach problem for naval aircraft received a great deal of atten­tion from leading aeronautical research organizations, starting in the late 1950s. We note

Theoretical Studies

Figure 12.2 Carrier landing approach airspeeds chosen by pilots are below the airspeed for minimum drag forboththeNorthAmericanF-100A (top) andthe Douglas F4D-1 (bottom). (FromWhite, Schlaff, and Drinkwater, NACA RM A57L11, 1957)

particularly contributions to the theory by groups at the NACA Ames Aeronautical Labora­tory, the Royal Aeronautical Establishment, and Systems Technology, Inc. Two main lines of investigation were prediction of the minimum acceptable carrier-approach airspeed for any airplane and the physics of optimum vertical path control during approaches.

Theoretical Studies

Figure 12.3 Ling-Temco-Vought A-7E engine response characteristics. Lag in developing engine thrust is large at low power settings, creating path control problems in carrier approach. (From Craig, Ringland, and Ashkenas, Syst. Tech., Inc. Rept. 197-1, 1971)

The NACA Ames group examined some five candidate predictors for minimum ap­proach airspeeds (Drinkwater and Cooper, 1958). As found earlier, minimum drag speed correlated poorly with minimum acceptable carrier-approach airspeed. Other performance – related criteria were no better. Two that failed to correlate were the minimum air­speeds at which a given rate of change of flight path angle or a 50-foot climb could be obtained.

In the end, the Ames researchers concluded that a simple criterion based on stalling speed correlated best with the data. The minimum comfortable carrier-approach airspeed agreed best with 115 percent of the stalling speed in the power approach (PA) configuration, that is, flaps and landing gear down, power for level flight.

The Ames result is valid for airplanes of the general type tested, but one might be concerned at applying the 115-percent stalling speed prediction result to airplanes that differ radically from those tested. It seemed logical to try to develop a carrier-approach flight path model based on the fundamental flight and control dynamics and human factors of the problem. That was the motivation behind the work at Systems Technology, Inc., sponsored by the U. S. Navy. The STI engineers, including Tulvio S. Durand, Irving L. Ashkenas, Robert F. Ringland, C. H. Cromwell, Samuel J. Craig, Richard J. Wasiko, and Gary L. Teper, brought to the carrier-approach problem their well-known systems analysis techniques.

An interesting result, due to Ashkenas and Durand, identifies the transfer function pa­rameter associated with minimum drag speed, the point at which height control by elevator becomes reversed from the normal sense. This is a numerator factor in the elevator to height transfer function called 1/Th1. Negative values of this factor put a zero in the right half of the s-plane. Closing the height to elevator loop results in an aperiodic divergence corresponding to the reversal of normal height control below the minimum drag speed.

Around 1962, Ashkenas came up with the first systems analysis basis for minimum carrier-approach airspeed prediction. That is, his prediction for minimum approach airspeed was based on assumed pilot loop closures with an airframe defined by arbitrary mass, aerodynamic, and thrust characteristics (Ashkenas and Durand, 1963). Since the systems analysis approach does not merely correlate the behavior of existing airplanes, the results should apply to airplanes not yet built whose characteristics are beyond the range of those tested so far.

The Ashkenas-Durand systems analysis prediction for minimum carrier approach air­speeds can be explained as follows:

1. The approach is assumed to be made in gusty air.

2. In gusty air the pilot attempts to close the pitch attitude loop at a higher frequency than the gust bandwidth, or as high a frequency as possible.

3. The highest possible pitch attitude loop bandwidth occurs when the pilot’s gain is so high that the closed-loop system is just neutrally stable.

4. By excluding pilot model leads and lags, or treating the pilot as a pure gain, a definite gain value is associated with the neutrally stable closed pitch loop.

5. Similarly, an outer altitude control loop is closed by the pilot using pure gain, or thrust proportional to altitude error.

6. With both pitch and altitude control loops closed by the pilot, the sensitivity of the pitch control loop break frequency to pilot pitch control gain is calculated, as a partial derivative.

7. The sign of this partial derivative of pitch loop bandwidth to pilot pitch control gain, called the reversal parameter, is taken as an indication of carrier-approach performance. Positive reversal parameter values mean that increasing pilot gain improves bandwidth and performance.

8. The lowest airspeed at which the reversal parameter is positive is taken as a pre­diction of minimum carrier-approach airspeed.

The reversal parameter was refined in subsequent studies by Ashkenas and Durand in 1963 and by Wasicko in 1966. An interesting consideration was the finding in 1964 by Durand and Teper that the carrier-approach piloting technique as the airplane nears the carrier ramp changes from that assumed in the reversal parameter model. However, the approach airspeed would have already been set in the early part of the approach.

A later (1967) study of the carrier-approach problem by Durand and Wasicko went into the problem in greater detail, including the dynamics of the optical projection device that pilots use as a glide slope beam. The 1 /Te2 zero in the pitch attitude to elevator transfer function turned up as a primary factor, both in simulation and in landing accident rates. Unfortunately, this zero is dominated by airplane lift curve slope and airplane wing loading. Lift curve slope in turn is fixed by wing aspect ratio and sweep.

Wing loading, aspect ratio, and sweep are among the most fundamental of all design parameters for an airplane, affecting its flight performance. When a new carrier-based airplane is being laid out and wing loading, aspect ratio, and sweep are being selected to maximize such vital factors as range and flight speed, it is hard to imagine that a statistical connection with landing accident rate will be prominent in the trade-off.

Systems analysis methods were applied again to the carrier-approach problem in 1990 by Robert K. Heffley of Los Altos, California. Heffley studied the factors that control the carrier-approach outer loop involving flight path angle and airspeed. The higher-frequency pitch attitude inner loop was suppressed in the analysis, assumed to be tightly regulated by the pilot.

Heffley closed the outer loop under three different strategies, depending on whether the airplane was on the front side or back side of the drag required curve. The results give interesting insights into factors affecting the approach (Heffley, 1990). Another study in this series is an application of the Hess Structural Pilot Model (discussed in Chapter 21) to the carrier-approach problem, using a highly simplified pilot-airframe dynamic model.

The current U. S. Navy criterion for minimum carrier-approach speed, as exemplified by the system specification for the F/A-18 Hornet, gives no fewer than six possible limiting airspeeds, such as the lowest speed at which a 5-foot per second squared longitudinal acceleration can be attained 2.5 seconds after throttle movement and speed brake retraction. Heffley concludes that two additional criteria might be needed. One is a refinement of existing lag metrics to one that combines coordinated pitch attitude and thrust inputs. The other is an extension of the popup maneuver dealing with the end game, when the airplane is quite near the carrier’s ramp.