Category BASIC AERODYNAMICS

Transition to Turbulence

In most practical aerodynamic applications, the boundary-layer flow is predomi­nantly turbulent. We consider laminar flows in detail to appreciate the role of vis­cosity in a fluid flow, as well as to establish definitions and ideas in a simple-flow case. Also, for a distance downstream of an airfoil or wing leading edge, the bound ary layer is laminar. However, the laminar boundary layer soon goes through a compli­cated series of changes, after which a turbulent boundary layer emerges. A turbulent­boundary-layer flow exhibits unsteady, chaotic motion that has a random character and that contains large-scale eddies. The series of changes within the boundary layer that convert a laminar to a turbulent boundary layer usually occur over a finite dis­tance, called a transition region. Because of the major differences in laminar and turbulent skin friction (and heat transfer), it is desirable to be able to predict (or estimate) both the start and the end of the transition region. Much experimental and analytical/numerical effort has been expended in this regard. We limit our discussion to an overview of the transition process from a physical perspective, with estimates of the streamwise extent of the transition region.

Recall that a laminar boundary layer in a steady flow consists of flow in smooth, steady laminas. However, the laminar shear layer is subject to small disturbances that occur in any flow (e. g., surface vibration, noise, freestream turbulence, surface imperfections, or roughness). These external disturbances usually are infinitesimal and random. They act as forcing functions that trigger two-dimensional wave-like disturbances within the laminar boundary layer. These waves, which travel down­stream in the boundary layer, are called Tollmein-Shlichting waves (T-S waves), named after two researchers who conducted basic studies on the stability of these disturbance waves in the early 1930s.

Below a certain minimum Re number, these T-S waves damp out. This number is called the critical Reynolds number, which usually is based on a boundary-layer – thickness dimension, such as 5*, rather than a streamwise dimension, x. For a
flat-plate boundary layer, Recrit, 5* typically has a value of about 700, corresponding to a value of Recr, x of about 165,000. Values of Re numbers used in this discussion, of necessity, must be prefaced by “about” or “approximately” because they depend so strongly on the environment (e. g., freestream turbulence level) of a particular boundary layer. This is not the transition point; it simply represents the lowest value of the Re number at which small disturbances in the boundary layer can be ampli­fied. For the remainder of the discussion, we think of holding the flow velocity and properties constant and increasing the Re number by increasing the downstream distance, x, from the plate leading edge. At a value above the critical Re number, the disturbance waves within a certain frequency band are found to amplify with downstream distance. Linear-stability theory is used to predict the frequency band and the rate of amplification. A classical series of measurements was made by Schu – bauer and Skramstad in the 1940s that confirmed this amplification of the T-S waves (See discussion in Schlichting, 2003). Local velocities were measured in a flat-plate boundary layer with a fast-response instrument called a hot-wire anemometer; the results are shown in Fig. 8.29. Notice that at about 5 ft. (1.52 m), wave amplification is evident; at 6 ft. (1.83 m), the local flow is becoming nonlinear; and at 8 ft. (2.44 m), it is fully turbulent.

Подпись: Reynolds number

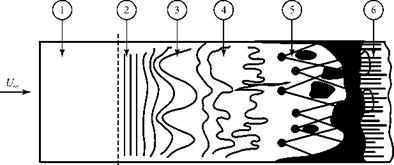
As the T-S waves are amplified, a complicated three-dimensional struc­ture evolves. The waves begin to exhibit spanwise variations, and distorted vortex structures appear. Turbulent spots are formed, which are small regions of intense velocity fluctuations. These spots grow in size and number, finally coalescing into a fully turbulent boundary layer. The process of boundary-layer transition is shown in Fig. 8.30 (White, 1974).
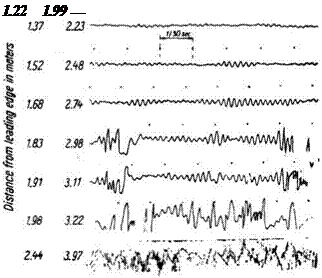
Подпись: 1.22 1.99 Figure 8.29. Oscillograms showing natural transition from laminar to turbulent flow (See discussion in Schlichting, 2003).

Transition to Turbulence

О I—► x Rcrit

Transition to Turbulence

Figure 8.30. Schematic of the transition process on a flat plate (White).

The transition Re number, Retrx, is the value of the Re number at which the boundary layer becomes fully turbulent. For a smooth flat plate with a low – turbulence level in the external flow, this value can be as large as (about) Retrx = 1 x 10⁷. This value must be used with caution. For example, the boundary layer on a swept wing becomes turbulent much closer to the leading edge than for a straight wing (or flat plate) due to three-dimensional effects. Looking at Fig. 8.29, note that the caption states that this experimental result, as well as the value for Retr, x quoted previously, is for “natural” transition (i. e., transition of a boundary layer in the pres­ence of minimal outside disturbances). At times, it is desirable to force transition to a more upstream location (i. e., smaller value of x). For example, consider the wind-tunnel test of a model wing that is conducted to predict the behavior of a much larger full-scale wing at the same velocity. On the full-scale wing, the turbu­lent boundary layer may be established close to the leading edge; whereas on the model, the same transition Re number (i. e., the same x-dimension) corresponds to a chordwise distance much closer to the trailing edge. Recall from a previous discussion that the location of the boundary-layer separation point is sensitive to whether the boundary layer is laminar or turbulent. Thus, wind-tunnel tests at high angles of attack may be misleading because the boundary-layer separation point can not be located correctly. In such a case, the boundary layer on the model often is “tripped” (i. e., forced transition) by gluing a roughness strip (e. g., sandpaper) to the model wing surface in a spanwise direction a short distance downstream of the leading edge. Such a comparatively large disturbance causes a turbulent boun­dary layer to be established much closer to the leading edge than in the natural – transition case. Care must be taken that the artificial disturbance introduced is not so large as to lead to a badly distorted (hence, unrealistic) turbulent boundary-layer profile downstream.

Transition to Turbulence

Transition to Turbulence

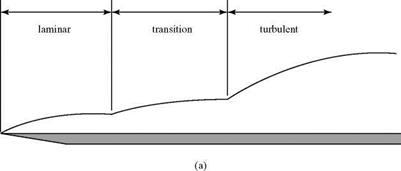
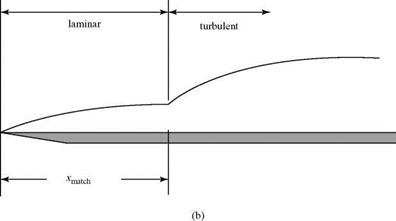
Figure 8.31. Actual and assumed boundary-layer growth.

If we want to calculate simply the behavior of an entire boundary layer from laminar through turbulent, the details in the transition region must be avoided. This normally is accomplished by making an assumption about the behavior of tran­sition. The actual boundary layer, containing a transition region, is like that shown in Fig. 8.31a. For purposes of calculation, it is assumed that the boundary layer is first laminar and then turbulent, as shown in Fig. 8.31b; the change occurs instantly at some Re number value. In similarity analyses, a virtual origin for the turbulent boundary layer may be found by matching 5* or 0 for the two boundary layers at Rematchx (i. e., at %match) . In numerical analyses, the downstream matching calcu­lation is switched from laminar-to-turbulent defining equations at xmatch. The value of Rematchx is somewhat arbitrary and comes from experience. Because it must be larger than Recrit, a typical value of Rematch used is several hundred thousand.

The following factors stabilize a laminar boundary layer and thus delay tran­sition in an incompressible flow:

1. Favorable streamwise pressure gradient. Laminar-flow airfoils are specially shaped so as to maintain a chordwise favorable pressure gradient over the air­foil for as long as possible. Boundary layers stabilized in this way are said to have natural laminar flow (NLF).

2. Suction. Bleeding off the laminar boundary layer from a wing surface through spanwise suction slots or through porous surfaces stabilizes the laminar boundary layer. The suction inhibits boundary-layer growth and also alters the boundary-layer profile, which affects stability characteristics. Designs that use an artificial mechanism such as suction to maintain a laminar boundary layer are said to have laminar flow control (LFC).

3. Cooling the surface. Cooling a surface increases the value of Recrit

4. Making the surface smoother. Increasing surface roughness has a destabilizing effect on a laminar boundary layer.

5. Decreasing the turbulence level in thefreestream. This applies to wind-tunnel tests. Turbulence in the atmosphere has a negligible effect on the transition of a boun­dary layer on a flight vehicle. However, the freestream turbulence level in a wind – tunnel test section has a major influence on transition because it acts as a trigger for boundary-layer disturbance waves. We must be careful when comparing detailed boundary-layer turbulence measurements taken in different wind tunnels.

A good discussion of transition is in White, 1986, and a detailed review of tran­sitional boundary layers is provided in, Lauchle, 1991. A comprehensive review of flow control and control devices is found in Gad-El-Hak, 1989.

The increasing cost of jet fuel has made the subject of transition and LFC increas­ingly important. Holmes et al. found that for a high-performance business jet operating at Mcruise = 0.7, NLF on the wings, fuselage, and engine nacelles leads to a drag reduc­tion of 24 percent of total airplane drag (Holmes et al., 1988). Further information on full-scale and wind-tunnel tests on NLF surfaces is found in Holmes et al., 1984.

For design purposes (see Raymer, 1989), a typical conventional aircraft (i. e., no special boundary-layer treatment) may be considered to have laminar flow over perhaps 10 to 20 percent of the wings and tails and virtually no laminar flow over the fuselage. With some NFC incorporated into the design, laminar flow can extend over as much as 50 percent of the wings and tails and about 20 to 35 percent of the fuselage. Thus, any discussion of incompressible boundary layers is incomplete without treating the turbulent boundary layer, which is the topic of the next section.

Wakes

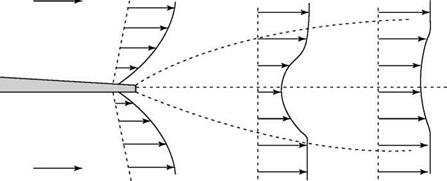
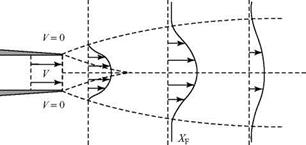
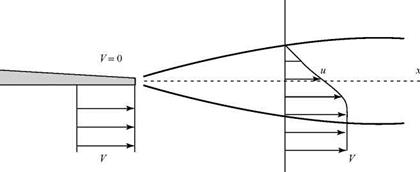
As in the discussion of the drag of an airfoil in Chapter 3, a wake forms behind a body because of the boundary layer leaving the body (as illustrated) or because of separation on the surface of the body (wake flow downstream of a cylinder). Behind the body trailing edge shown in Fig. 8.27, the two boundary layers merge. Then, the wake width increases with increasing downstream distance and the mean velocity in the wake decreases.

Free Jet

A free jet (here, a free-slot jet) is one that exhausts into a fluid at rest. Initially, the free jet at the exit has a uniform “core” with a free shear layer on either side. As the jet length increases, viscous-shear effects at the sides retard the flow at the center of

Wakes

Figure 8.27. Wake behind a flat plate.

Подпись: Figure 8.28. Free jet.
Wakes

the jet and the jet has a rounded profile (e. g., station XF). When the constant-velocity jet core disappears, the jet is said to be fully developed. With increasing distance downstream, the jet spreads and the maximum velocity decreases; both effects are caused by friction. Ultimately, the jet is dissipated.

All of these flows are unstable and quickly tend to become turbulent shear flows. It is difficult to generate them in the laboratory as laminar flows.

Free-Shear Layers, Wakes, and Jets

Space limitations do not permit a detailed discussion of these topics. The inter­ested student is referred to the book by Schlicting, 2003. The following discussion describes the physical phenomena of interest and introduces terminology. Only two­dimensional flows of this type are presented.

Free-Shear Layers

A free-shear layer is a viscous flow bounded on one side by a uniform flow and on the other side by a fluid at rest. Consider, for example, a viscous flow coming off

Free-Shear Layers, Wakes, and Jets

Figure 8.26. Free-shear layer.

the lower surface of a plate with zero-velocity flow above (Fig. 8.26). For simplicity, assume that the boundary layer on the plate surface is negligibly thin.

The shearing action tends to pull along some of the fluid at rest and retard some of the fluid coming from the plate surface; the result is a velocity profile as shown. The nonuniform portion of this profile becomes wider with increasing x. A two­dimensional free jet (i. e., slot jet) has a velocity profile (as in Fig. 8.26) on either side of the jet as it emerges into still air. A short distance downstream of the exit, the two profiles merge to form a rounded-jet profile near the center (as in the case of a jet).

Linearly Retarded Flow of Howarth

In this example case, the external flow is linearly decelerating on a flat plate, as rep­resented by:

Ue(x) = U0(1 – x/L).

02(*)

v

Linearly Retarded Flow of Howarth Подпись: - L Г-1

Then, the Thwaites equation is integrated easily to obtain:

Подпись: X(x) Подпись: B2 U v dx Подпись: -0.075 Подпись: -1 .

Then, X is given by:

From this, we can find the variation of the wall shear stress and displacement thick­ness along the plate from the previous correlation expressions. For example, the skin friction is given by:

C = pS(X) = 2 v(X + 0.09)062

f 1pU2 1pUB ^(1- x / L)0 .

Подпись: ^sep = -009 = -0.075 Linearly Retarded Flow of Howarth Подпись: -1 ,

In addition, separation is predicted at X = -0.09, which corresponds to:

leading to:

xsep

= 0.123,

L

which is within 3 percent of the exact result of 0.120.

Flow over a Circular Cylinder

Here, the potential flow is given by:

U

—- = 2sin ф.

U0

This is transformed into the distance along the cylinder, ф = x/R, where R is the cylinder radius and x is the distance along the cylinder. The expression then is expanded in a Taylor series to give:

Ue

f x >

f x 13

f 55 x

= 2

– 0.3331 — + 0.0167

U0

1R J

1R J

1R J

The presence of the boundary layer on such a bluff body, however, significantly alters the potential flow and the polynomial:

Ue

f x ^

f x ^

3

f x 1

-*■ = 1.814

– 0.271

– 0.0471

U0

v R J

v R J

1R J

+

which is a curve fit of the data found by Hiemenz in 1911. It represents a closer fit (White, 1974). Using this second polynomial results in a significantly more accu­rate solution. Separation is predicted at ф = 78.5°, which is close to the experimen­tally observed value of 80.5°. The first polynomial produces a separation point of ф = 104.5°.

Direct Numerical Solution of the Boundary-Layer Equations

In solving the boundary-layer equations, there are numerical alternatives to the integral methods using fully coupled, finite-difference methods. Integral methods tend to be fast, but they have limited range of applicability because they rely on the velocity profiles being specified—sometimes by guesswork—and being of the same geometric family at each axial location, which may not always be the case. Hence, they lack generality. Direct solutions of the governing equations by finite-difference methods are signifi­cantly slower due to the coupled nature of the equations. However, it is possible to take advantage of the rapid convergence of a novel, uncoupled procedure to give a signifi­cantly faster boundary-layer solution, which is then coupled to the inviscid-flow model.

‘ij+1 іі-

Linearly Retarded Flow of Howarth Подпись: 1

where:

The continuity equation is solved for a new value of w by a trapezoidal-rule integration:

(zij zij—1)

i wij—1———– 2—

The equations can be solved in an uncoupled manner, as described by Gad-El-Hak, 1989. The procedure is as follows:

1. The Initial values of и and w are obtained from the г-1 station.

2. The nonlinear coefficients are evaluated.

3. The momentum equation then is solved for u1j.

4. The continuity equation then is used to obtain a new value of wij.

5. The convergence of u1j. is checked.

6. If not converged, then the procedure is repeated from Step 2.

The method described is fast compared with other finite-difference calculations, even though iterations are used at each station. The iterative updating of the nonlinear coefficients, instead of simply using the value at г-1, improves accuracy and allows coarser spacing to be used. The computer code BL uses this solution procedure and is set up to demonstrate a number of flows for various freestream pressure distri­butions, as well as to accept pressure distributions from data files.

Flat-Plate Solution with a Polynomial Velocity Profile

For an example, we consider the flow over a flat plate and assume that the velocity profile is given by a third-order polynomial in n:

u = an3 + bn2 + cn + d. (8.105)

The constants in the equation can be evaluated using the boundary conditions that:

— = 0 at n = 0

Подпись: (8.106)

= 1 at n = 1. V

Flat-Plate Solution with a Polynomial Velocity Profile Подпись: (8.107)

These lead to the requirements that d = 0 and a + b + c = 1. For a flate plate, the external pressure gradient is zero, so this provides no additional information. To complete the evaluation of the coefficients, we require that derivatives of the velo­city profile at the freestream condition go to zero. This is consistent with an asymp­totic approach to the freestream. Thus, we write:

leading to the requirement that a = 1, b = -3, and c = 3. Therefore, a physically consis­tent polynomial for the flat-plate boundary-layer profile is:

—=n3 -3n2+3n.

The displacement thickness and momentum thicknesses divided by the boundary – layer thickness now can be found from their definitions:

-;r =j|1 – — dn = j (1- n3 + 3n2- 3n) dn = 0.25

Подпись: 0

Flat-Plate Solution with a Polynomial Velocity Profile Flat-Plate Solution with a Polynomial Velocity Profile

0

Hence, the two shape factors become:

– * -*/-

H = — = ^-^ = 2.333 0 0/-

H ‘ = – = 9.334.

0

The skin-friction coefficient also is given by:

du

Подпись: bПодпись: _ _VT(0) = _6v_ 1 p—2 22 p—2 1 PV2- —- ‘ dz

f~ 1

5* = 1.8704

Flat-Plate Solution with a Polynomial Velocity Profile

To complete the calculation, the momentum-integral relationship, Eq. 8.103, is used to find the momentum thickness, 0. The momentum-integral relationship, with a zero pressure gradient, becomes: of the more popular of these in this subsection and leave a more thorough treat­ment for textbooks devoted more exclusively to the topic of boundary-layer theory.

5 *

Подпись: 0 Подпись: S = ■ Подпись: (8.108)

The momentum-integral relationship can be written in terms of both the shape factor, H, and a shear factor, S. These are defined as follows:

Flat-Plate Solution with a Polynomial Velocity Profile Подпись: (8.109)

When placed into the momentum-integral relationship we obtain:

Flat-Plate Solution with a Polynomial Velocity Profile

Unfortunately, the previous approach assumed that the shear and shape factors were constant, which eliminates many potentially interesting flows from consider­ation. Instead, it is found that the factors H and S very nearly depend only on the quantity:

By analyzing a large volume of experimental and analytical results for laminar boundary layers in terms of these parameters, Thwaites proposed a simple linear relationship for F(X) given by:

F (X) = 0.45-6.0 X. (8.112)

02(*)

v

0.45

Ue6(*)

92(*q) Ue6(x0) v Ue6(*)

Подпись: x J Ue(x')dx x0
Подпись: +
Подпись: (8.113)

This allows an immediate integration of the integral-momentum relationship as follows:

Note that once 02/v is found, the value of X can be computed. The shear and shape factors then can be computed from a table of H and S values as a function of X. Ana­lytic curve fits of these data are shown in (White, 1974), as follows:

H (X) = 2.0 + 4.14z – 83.5z2 + 854z3 + 3,337z4 + 4576z5 S(X) = (X + 0.09)0’62,

where the variable z in the H equation is defined as:

z = 0.25 – l.

These then can be used to determine the displacement thickness and the wall shear stress. A few examples demonstrate this simple but powerful method.

Constant-Speed Freestream over a Flat Plate

Here, Ue(x) = Uo, a constant, and the flow begins at the leading edge of the flat plate. In this case, the Thwaites integral becomes:

02 = 045x

v= U0 ,

which compares favorably with the exact (i. e., Blasius) value of 0.441x/Uo. We also note that here, X = 0 because the derivative of Ue is zero. Then, we find that:

H = 2.55 and 5 = 0.225.

These compare well with the exact values of H = 2.59 and S = 0.220. The skin friction on the plate is given by:

Подпись: Cf =2vS

Ue0 ,

Flat-Plate Solution with a Polynomial Velocity Profile Flat-Plate Solution with a Polynomial Velocity Profile Подпись: 0.671 VRXX'

which now becomes:

This is within 1 percent of the exact result of 0.664 /VRX.

Solving the Momentum-Integral Equation

A powerful method for solving the boundary-layer equations involves representing the velocity profile (i. e., the parallel part of the velocity in terms of the coordinate normal to the undisturbed flow direction) by an approximate analytical expression and integrating the equations in the direction normal to the flow. Integrating the equations removes the normal independent variable, leaving an ordinary differential equation in the streamwise direction, as demonstrated in the previous subsection.

Подпись: u V Solving the Momentum-Integral Equation Подпись: (8.98)

The expression for the velocity profile is represented by:

where f is any function of the dimensionless normal coordinate that satisfies the necessary boundary conditions. For example, it is likely that f must go to zero at the surface to satisfy the no-slip boundary condition.

Solving the Momentum-Integral Equation Подпись: 5 Подпись: f '(0), Подпись: (8.99)

We now rewrite Eq. 8.96 to put it in the form most convenient for calculations. The wall shear stress and boundary-layer thickness are related to the momentum thickness by:

where the primes denote derivatives relative to the dimensionless, normal boundary- layer variable (n = z/5). It also is useful to define a second shape factor based on the boundary-layer thickness, 5:

5

H ‘ = – (8.100)

0

Hence, the momentum-integral relationship, Eq. 8.96, can be written as:

Подпись: (8.101)H0 dU«2 + d („2 Vtf,

~ + dX (U0)=H0 f(0)-

Solving the Momentum-Integral Equation Solving the Momentum-Integral Equation Подпись: (8.102)

The second term on the left side can be expanded and recombined with the first term to give:

where the equation was multiplied through by 20.

For simple problems such as flow over a flat plate and flows with favorable or only weakly unfavorable pressure gradients, the shape factor, H, can be approxi­mated as a constant. In such cases, Eq. 8.101 has an integrating factor:

(tfe2)2+H.

Solving the Momentum-Integral Equation Подпись: 2vf 40) Ц i+H H e Подпись: (8.103)

The momentum integral then becomes:

Solving the Momentum-Integral Equation Подпись: (8.104)

Integration yields:

This simple expression can be evaluated for the momentum thickness, and the shape factor, H, then can be used to determine the displacement thickness.

Momentum Integral Method for Arbitrary Pressure Gradients

A powerful approximate method obtained by applying the momentum theorem to a boundary-layer flow is discussed next. This method of solution does not yield the boundary-layer-velocity profile directly, as did the Blasius and Falkner-Skan solu­tions. Rather, a velocity-profile function is assumed that contains a dimensionless parameter incorporating an arbitrary pressure gradient. Substituting this assumed profile into the momentum integral produces expressions for 8(x), 8*(x), 0(x), and Cf (x) in the presence of a specified but arbitrary pressure gradient, expressed in the form of the external flow, Ue(x). The resulting velocity profiles are no longer similar because the mathematical requirements that led to that special condition are no longer satisfied. Numerical methods for solving the momentum-integral equation are described after the equation is derived.

Momentum-Integral Equation

The momentum-integral relationship (attributed to von Karman) may be derived by either combining the continuity and momentum-differential equations for the
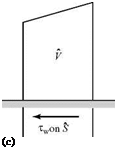
boundary layer and then integrating across the boundary layer, or applying the momentum theorem to a fixed control volume within the boundary layer. The latter approach is used here because it represents another application of the Con­servation of Momentum Principle discussed in Chapter 3. Steady flow is assumed, and the resulting equation is applicable to both laminar and turbulent boundary layers.

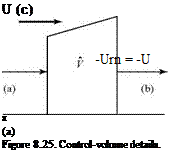
Consider a boundary layer growing on a flat plate in the presence of a stream – wise pressure gradient, Ue(x), as illustrated in Fig. 8.24.

A fixed-control volume, у, is chosen that extends from the wall to the edge of the boundary layer and is Ax in length. It is assumed that the boundary-layer approximations hold so that w/u << 1 (i. e., the boundary-layer flow is normal to the vertical sides of у) and dp/dz = 0. Also, the shear stress along the top surface of у is negligible compared to the pressure stress there, and the normal viscous stresses on the vertical sides of у are ignored compared to the pressure stress. Then, from Eq. 3.1, the momentum theorem in the x-direction applied to У may be written as follows:

JJри(v • n)dS – – Up(n • i)d. S + JJ (t. i)dS (8.93)

S S

[1] [2] [3]

Each term is detailed in turn, as follows:

[1] The net-momentum-flux expression consists of the following three terms, as shown in Fig. 8.25a: §

(a) Inflow through the left face, J pu(-u)dz.

0

Подпись: d_ dx Подпись:Momentum Integral Method for Arbitrary Pressure Gradients§

Подпись: (b)

Momentum Integral Method for Arbitrary Pressure Gradients

Outflow through the right face, J pu(+u)dz

0

(c) Momentum entering the slant upper surface of у, namely, (-Uem).

Recall that the edge of the boundary layer is not a streamline. The mass flux m entering through the upper surface is the difference between the mass flux out through the right face of у and the mass flux in through the left face of V, or:

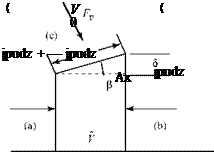
[2] The net pressure force on the control surface consists of the following three terms, as shown in Fig. 8.25b:

(a) The pressure force on the left face, (pS).

(b) Подпись: pS + — (pS)Ax dx

Momentum Integral Method for Arbitrary Pressure Gradients Momentum Integral Method for Arbitrary Pressure Gradients
Подпись: (c)

The pressure force on the right face,

(c)

Подпись: Fp = (normal pressure)(area) Подпись: p Подпись: (s)(1),

The horizontal component of Fp; namely, FH = Fp sinp = Fp(AS/As), where Fp is evaluated at the midpoint of the interval Ax as:

where the area is (s)(1) because the flow is two-dimensional. Thus,

Подпись: pFH =

[3] The net shear stress acting on the surface of the control volume is shown in Fig. 8.25c. The shear stress on the upper surface is negligible, whereas the shear stress on the two vertical faces of the control volume is at right angles to the x-direction. The only shear-stress term of interest is the shear force acting on the lower surface of the control volume. The fluid pulls the plate to the right (i. e., drag); hence, the force on the control surface due to the plate is directed to the left. Thus, the shear force is – Tw(x)(1).

Now, we substitute all of these seven terms into Eq. 8.93. Then, we divide through by (Ax) and take the limit as Ax ^ 5x, which, in [2](c) makes AS/Ax ^ dS/dx.

Подпись: d_ dx Momentum Integral Method for Arbitrary Pressure Gradients Momentum Integral Method for Arbitrary Pressure Gradients Momentum Integral Method for Arbitrary Pressure Gradients Подпись: ~dp = -0 — -T dx w Подпись: (8.94)

Expanding, simplifying, and neglecting one higher-order term in [2](c) results in the following equation:

This is the Karman momentum integral for steady flow. The student should fill in the details of the derivation of Eq. 8.94. The upper limit in this equation is 5 rather than ^ because an assumed velocity profile can be expressed in terms of z/5 so that at z = 5, u = Ue .

Подпись: d_ dx Подпись: J pu2dz Подпись: |_d_ I dx Подпись: Ue J pudz Momentum Integral Method for Arbitrary Pressure Gradients Подпись: Jpudz Подпись: dUe ■=5pU -U Подпись: (8.95)

Eq. 8.72 can be written in an equivalent form, as follows:

Подпись: d_ dx Подпись: J pu(Ue - u)dz Momentum Integral Method for Arbitrary Pressure Gradients Подпись: Jp(Ue“ u)dz Подпись: = T,,

Collecting and multiplying through by a minus sign, Eq. 8.95 becomes:

[pU’20]+Zb [pU’5 *]

Подпись: d dx Подпись: = T„ Подпись: (8.96)

or:

Finally, expanding the first term of Eq. 8.74 by the chain rule and then dividing by

Подпись: + (2 + H )± U dx Ue dx Подпись: Cf 2, Подпись: (8.97)

U2e:

where H = 5*/0, the shape factor defined previously. This is the most commonly used form of the Karman momentum integral for steady, incompressible, boundary-layer flow.

Viscous Flow on Wedges

The pressure gradients that allow the Falkner-Skan equation to be an ordinary dif­ferential equation, given by:

1 1

Ux= cxm or p! = Pq – —p U2 = Po~2 p(cxm )2 (8.92)

Подпись: 0 0.2 0.4 0.6 0.8 1
Viscous Flow on Wedges

correspond to the potential flow over wedges, as shown in Fig. 8.22.

u/U1 v/U i(Rex)1/2

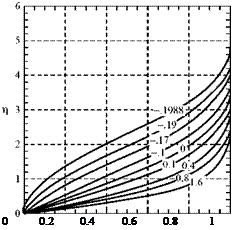
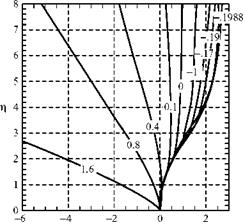
Figure 8.21. Solution of the Falkner-Skan equation for various values of the pressure-gradient parameter, p.

в

ЖР)

B(P)

f "(P,0)

П8(в)

-0.1988383

3.497798

0.868110

0.000000

5.0

-0.198800

2.332770

0.585389

0.005260

5.0

-0.190000

2.006747

0.576523

0.085702

4.7

-0.170000

1.778859

0.559664

0.162116

4.4

-0.140000

1.595897

0.538560

0.239737

4.2

-0.100000

1.442694

0.515044

0.319270

4.0

-0.050000

1.312361

0.490464

0.400323

3.9

0.000000

1.216779

0.469600

0.469600

3.7

0.100000

1.080320

0.435458

0.587035

3.5

0.200000

0.984159

0.408231

0.686708

3.4

0.300000

0.910995

0.385737

0.774755

3.2

0.400000

0.852636

0.366693

0.854422

3.1

0.500000

0.804550

0.350272

0.927681

3.0

0.600000

0.763974

0.335910

0.995837

2.9

0.800000

0.698683

0.311849

1.120269

2.8

1.000000

0.647904

0.292346

1.232589

2.6

1.200000

0.606902

0.276114

1.335723

2.5

1.400000

0.572872

0.262324

1.431587

2.4

1.600000

0.572872

0.262324

1.431587

2.3

Table 8.2. Properties of the numerical solutions for the Falkner-Skan equation

S(*) = hg (P),

, S * (x) = A(P)

Viscous Flow on Wedges

There are several interesting special cases for various choices of the в value. For example, if m = 0 and в = 0, the Falkner-Skan equation collapses to the Blasius flat-plate equation. The factors of 2 that appear to be different between the two equations result from definitions of some of the parameters but do not change the outcome of the calculation.

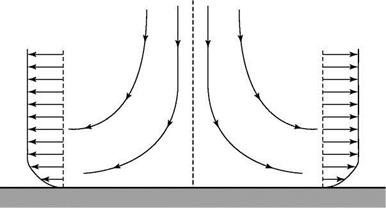
A useful special case is produced when m = 1 and в = 1. This yields the flow near a stagnation point, as illustrated in Fig. 8.23.

Подпись: 2m 0 = n m+1 Viscous Flow on WedgesFigure 8.22. Wedge flow for the Falkner – Skan equation.

Viscous Flow on Wedges

Figure 8.23. Flow near a stagnation point using the Falkner-Skan solution.

The external flow is expressed as:

U1 = u1x,

where for the case of the stagnation-point flow over a circular cylinder of radius R, the constant, Ui, is defined by:

9 U – щ = 2 -.

1 R

This is an important result because it can be helpful in starting numerical solutions in certain CFD applications, because the boundary-layer equations lose their validity near the stagnation point.

Pressure Gradients and Boundary-Layer Profiles: A Qualitative Assessment

Pressure Gradients and Boundary-Layer Profiles: A Qualitative Assessment Подпись: (8.84)

To discuss the effect of a streamwise pressure gradient on the behavior of a boundary layer, it is necessary to examine the x-momentum boundary-layer equation, Eq. 8.37, with the pressure-gradient term included; namely:

Recalling that dp/dz = 0, dp/dx previously could have been written as dp/dx (i. e., as the total derivative) because p only changes in the direction parallel to the surface.

For convenience, we consider a flat plate installed in a curved nozzle, shown in Fig. 8.15, as a simplified model of a flow along a curved airfoil surface that is experi­encing a pressure gradient.

Pressure Gradients and Boundary-Layer Profiles: A Qualitative Assessment

For an incompressible flow, continuity demands that as the nozzle area decreases, the freestream velocity must increase (see Fig. 8.14a). The Bernoulli Equation may be written for the freestream flow to relate velocity changes to static-pressure changes. Recalling that the freestream impresses a pressure distribution on the boundary

Подпись:I* »

(a) favorable pressure gradient (b) adverse pressure gradient

Figure 8.15. Flat-plate boundary layer with streamwise pressure gradient.

layer, the Bernoulli Equation may be thought of as written for a streamline only at the outer edge of the boundary layer, where the velocity is Ue. Thus,

Подпись: (8.85)Подпись:1 2

p + 2 pUe = constant.

Differentiating in the x-direction along a streamline:

dp dUe

dx+pU«d~=“■

Thus, in discussing a boundary layer, we may speak interchangeably about a stream- wise pressure gradient or an external-flow velocity gradient. In particular, the x-momentum equation, Eq. 8.83, may be written in an alternate form by replacing dp/dx with the expression from Eq. 8.86; namely:

Подпись:Подпись:dU d u

—r^+v~r. dx dz2

We continue the discussion in terms of a pressure gradient because it is more mean­ingful physically. The velocity-gradient substitution is used as a convenience because the pressure gradient is usually known in terms of the velocity distribution in the external flow field.

Considering Fig. 8.15a, the boundary layer on this plate is experiencing a decrease in static pressure in the streamwise direction (dp/dx < 0). This is called a favorable pressure gradient. Conversely, the boundary layer in Fig. 8.15b is experi­encing an increasing static-pressure field with downstream distance, or (dp/dx > 0). This is called an adverse pressure gradient.

Подпись: d2u d (du b—j = y dz2 dz У dz J Подпись: dp dx Подпись: (8.88)

Without solving anything, we determine which conclusions we can draw regarding the behavior of a boundary-layer velocity profile with a pressure gradient. First, we write Eq. 8.70 at the surface where, by virtue of the boundary conditions, u = w = 0. At the wall, then:

Consider three different streamwise pressure gradients, first making the right side of Eq. 8.84 zero, then less than zero, and, finally, greater than zero. Examine the qual­itative behavior of the variation in the slope of the velocity profile, du/dz, with dis­tance, z, from the surface, as shown in Fig. 8.16. Recognize that for large z, the slope of the velocity profile must go to zero as the boundary-layer profile merges with the constant freestream velocity, Ue, at the edge of the boundary layer. Be careful: The graphs in Fig. 8.16 present the variation of the slope of the velocity profile with z, not the velocity profile itself.

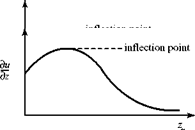
Figure 8.16a represents a flat plate with zero pressure gradient. Eq. 8.74 states that at z = 0, the derivative of du/dz is zero. The second derivative of u being zero implies that the velocity profile u(z) has an inflection point at z = 0. The slope of the profile then continually decreases and approaches zero for large z, that is, at large z, u ~ constant and, hence, du/dz ~ 0. This corresponds to the behavior of the Blasius boundary-layer (i. e., zero pressure gradient) profile, discussed previously.

Pressure Gradients and Boundary-Layer Profiles: A Qualitative Assessment
Подпись: (a) dP = 0 dx
Pressure Gradients and Boundary-Layer Profiles: A Qualitative Assessment

Figure 8.16. Variation of velocity-profile slope with pressure gradient.

Figure 8.16b corresponds to a favorable pressure gradient. Then, d2u/dz2 < 0 at the wall, from Eq. 8.74, the slope of the velocity profile continually decreases with increasing z, and there is no inflection point in the profile.

Figure 8.16c corresponds to an adverse-pressure gradient. Here, the second derivative of the profile, d2u/dz2, must be positive at the wall, Eq. 8.88 and also d2u/dz2 must approach zero far from the wall, as discussed previously. However, this says that there must be an inflection point in the profile somewhere in between (i. e., at some z, d2u/dz2 = 0) and there is a reversal of profile curvature there. The argu­ment is too elementary to be able to specify the value of z at which this happens, but a change in curvature in the profile must occur. The character of the pressure gradient thus has a profound effect on the boundary-layer velocity profile.

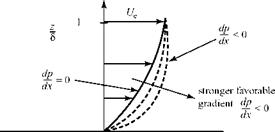
We examine the effect of a streamwise pressure gradient from another physical viewpoint. Consider a fluid particle moving streamwise in the boundary layer. By virtue of its movement, it possesses a certain momentum. If the pressure acting on the back of the particle is greater than that on the front (a favorable pressure gradient), then the unbalanced force accelerates the particle and increases its momentum. This increase in momentum has a more pronounced effect near the wall, where the particle momentum initially is small. A favorable pressure gradient thus makes the boundary-layer velocity profile more full near the wall, as illustrated in Fig. 8.17. This fullness increases for a stronger favorable pressure gradient. There is no inflec­tion point in the profile, as expected from the previous discussion. Be careful when thinking about the slope of a boundary-layer velocity profile, du/dz! The student is used to thinking about slope expressions where u is the ordinate and z the abscissa, whereas boundary-layer convention plots z as ordinate and u as abscissa.

Figure 8.17. Velocity profile change with favorable pressure gradient.

Pressure Gradients and Boundary-Layer Profiles: A Qualitative AssessmentNow, we consider the same fluid particle in an adverse-pressure gradient. Here, the particle is working against an unbalanced force directed upstream and the par­ticle loses momentum. Again, the effect is most noticeable near the wall, where the particle momentum is small, as shown in Fig. 8.18. Thus, the profile changes with an inflection point appearing, as previously discussed. If the adverse-pressure gradient becomes stronger, and as the adverse-pressure gradient persists, the velocity profile increasingly distorts and du/dz near the wall becomes increasingly smaller.
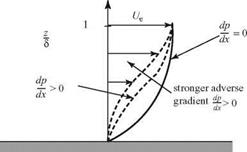
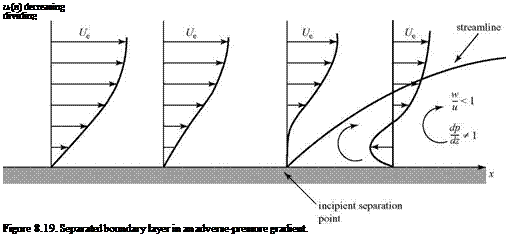
If the adverse-pressure gradient continues to a certain point, then ultimately the fluid particles very near the wall lose all of their momentum and a point is reached where, at the wall, both z = 0 and du/dz = 0. This is called the incipient separation point, as shown in Fig. 8.19. A separation streamline originates at the separation point and is a line of demarcation between the external flow and the “dead-air” flow in the separation region. Thus, if there is separation on a surface, the oncoming flow experiences a large apparent change in the geometry of the surface and it no longer proceeds in a direction parallel to the surface, as in an inviscid flow. Within the sepa­rated region, there is a flow reversal and vortices are formed. Notice that within the separated region, the point on the velocity profile where u = 0 must lie beneath the separation streamline so that the reversed flow can circulate within the region.

Within the separated region, the velocity-component ratio w/u is no longer small and the boundary-layer equations no longer hold. Likewise, dp/dz is no longer neg­ligibly small. Depending on the pressure field, the separation streamline may bend back and reattach to the wall farther downstream, forming a separation bubble, or it may trail downstream to form a wake. Recall the inviscid-pressure distribution on the surface of a right-circular cylinder from Chapter 4. At 90° from the oncoming stream, the local velocity is 2У^ and the pressure is a minimum. Beyond that point, the surface pressure increases to a second stagnation point at 180°. However, in a viscous flow, the boundary layer on a cylinder separates soon after 90° because

Pressure Gradients and Boundary-Layer Profiles: A Qualitative AssessmentFigure 8.18. Velocity-profile change with adverse-pressure gradient.
Подпись: Ue (л) decreasing dividing Figure 8.19. Separated boundary layer in an adverse-pressure gradient.

it experiences an adverse-pressure gradient and a wake forms downstream of the cylinder. The same general findings pertain to any bluff object.

It should be clear from this discussion that boundary-layer separation does not occur in the presence of a favorable pressure gradient. Separation is caused by an adverse pressure gradient. Furthermore, separation is to be avoided if possible because the dividing streamline greatly modifies the apparent shape of a carefully designed surface. That is, the intended pressure distribution is not achieved and the aerodynamic performance may be impaired. This usually means greatly increased drag and sometimes serious degradation of control and handling properties of a flight vehicle.

Подпись: We run Program AIRFOIL (in inviscid mode) and examine the chordwise pressure distributions on selected airfoil shapes at zero angle of attack. Typical shapes exhibit a suction peak near the leading edge and then the pressure coefficient decreases (i.e., surface static pressure increases) continuously toward the trailing edge, with a sharp increase in static pressure beginning a few percent chord ahead of the trailing edge as the pressure rises to atmospheric pressure. The separated flow observed near the trailing edge of a typical airfoil is a result of the presence of these adverse pressure gradients. Now, we select an airfoil and observe the inviscid-flow chordwise pressure distribution with increasing angle of attack. Notice how the magnitude of the adverse pressure gradient downstream of the suction peak increases as the angle of attack becomes larger. As a result of this increasing adverse pressure gradient, the boundary-layer separation point moves upstream and the lift-curve slope rapidly becomes nonlinear (see, for example, Fig. 5.3). Ultimately, the adverse pressure gradient becomes so large that the separation point on the airfoil moves rapidly upstream and the airfoil stalls.

This physical description of boundary-layer behavior in the presence of an adverse pressure gradient may be applied to the performance of an airfoil.

Pressure Gradients and Boundary-Layer Profiles: A Qualitative Assessment

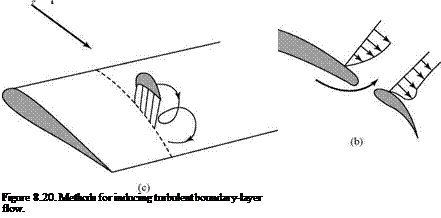
It is clearly advantageous to delay or avoid separation. Consideration of the physical cause of separation in an adverse pressure gradient suggests that it is useful to make the boundary-layer profile “fuller,” which allows more of a momentum loss near the surface before incipient separation occurs. There are several ways to accomplish this as follows:

1. Make the boundary layer turbulent. As mentioned previously and as shown later in this chapter, the turbulent boundary layer has a fuller profile than the lam­inar one, as shown in Fig. 8.20a. Thus, separation is less likely but at the cost of greater frictional drag. In low-speed applications (e. g., high-performance sail­plane design) it is common to use turbulators to purposely introduce transition to turbulence. This avoids the formation of “laminar separation bubbles” that represent a serious loss of aerodynamic efficiency. The turbulators often take the form of “zig-zag” tape, which is bonded to the surface in areas where it is desired to induce turbulent transition (e. g., near the aileron or flap hinge line). The mechanism by which the tape “trips” the boundary layer is not well under­stood, but it is clear that the irregular protrusion into the airflow creates vortices or eddies—vortical waves—that trigger the required transition to turbulent flow downstream of the tape.

2. Blow higher-energy air tangential to the surface prior to separation. This creates a distorted profile, shown in Fig. 8.20b, with much higher momentum near the surface. A blown flap is illustrated where air from the higher-pressure under­side of the flap flows through a slot and energizes the boundary layer on the upper, lower-pressure side. This is a form of boundary-layer control. Generally,

considerable design complexity and, hence, cost are introduced by using tangen­tial blowing because it implies a source for the high-energy flow along with the attendant ducting, injection surfaces, and control systems.

3. Use a vortex generator. This generator is a miniature wing or vane projecting vertically from the upper surface of a wing and at an angle of attack to the oncoming flow, as shown in Fig. 8.20c. The mechanism here is similar to that described in Method 1; that is, the formation of vortices to stimulate the creation of a fully turbulent unsteady boundary layer. A vortex is continuously shed at the tip of the vortex generator for precisely the same reason that it forms at the tip of a three-dimensional wing. This vortex sweeps higher-momentum air downward from the outer edge of the boundary layer to “energize” the low – momentum region of the boundary layer near the surface. Rows of such gener­ators are sometimes seen on the upper surfaces of wings. For example, they are a familiar feature of the wing surfaces on certain commercial jet aircraft, such as the Boeing 757. Their main purpose in such cases usually is to ensure that flow separation does not affect the behavior of the flaps or other aerodynamic controls. Any measure that aids in the prevention of large-scale separation is an advantage; however, as we will see, a turbulent boundary layer causes increased skin-friction drag.

The possibility of flow separation also is incorporated into the design of flow devices. For example, the diffuser of a subsonic wind tunnel, which slows the flow after it passes through the test section, usually has a slowly increasing cross section (making for a long length) that as small an adverse pressure gradient as possible is imposed on the diffuser flow.

It is obviously important to study in more detail the features of viscous-boundary – layer flows with pressure gradients. Qualitative discussions of a few experimental findings hardly can provide enough information. It is useful to first attempt to extend the analysis used for the flat plate (i. e., the zero-pressure-gradient problem) to situ­ations with a pressure gradient. In a famous paper, Falkner and Skan showed that the similarity method can be used for a restricted class of freestream velocities of the following form:

Ue(x) = U1xm,

where m can be 0, < 1, or >1 and U1 is a constant velocity-scaling parameter. This special case is discussed briefly in the next subsection. An approximate integral treatment for the case of a more general pressure gradient follows.

Similar Boundary-Layer Solutions with Arbitrary Pressure Gradients

Following the same general approach used for the Blasius problem, we introduce a dimensionless stream function, ¥, and similarity parameter, n, of the following form:

v(*. n) =

Подпись:m +1

Ul

vx’

where the notation follows closely that used previously. If these expressions are used to rewrite the boundary-layer equation (Eq. 8.84), we find (as in the flat-plate problem) that the motion is now governed by an ordinary differential equation for the function f (n). This is the Falkner-Skan equation:

Подпись: (8.90)f"’+ ff "+^m (i – f ‘2)=o,
m +1

where primes denote differentiation with respect to the boundary-layer coordi­nate, n, and solutions are possible only for certain ranges of values of m as already suggested. Note that Eq. 8.89 reduces to the Blasius equation for m = 0. Because the equation is nonlinear, it is clear that we might encounter problems of conver­gence or numerical instability. In particular, it is required that the pressure-gradient parameter:

Подпись: в2m m +1

must lie in a range for which there is no flow separation. It was found that flow separ­ation occurs if в < -0.1988388, and numerical difficulties (e. g., failure to converge) are encountered in that pressure-gradient range.

The finite-difference numerical method introduced for solution of the Blasius equation can be used for the Falkner-Skan problem. Reducing the order by using g = f, the equation can be rewritten as:

g" + fg’ + P(1 + g2) = 0. (8.91)

As before, the second-order central difference equations can be used to represent the derivatives, and the result is linear in the unknown value of g. The nonlinear term, g2, can be converted to linear form by using a Taylor-series expansion. Expanding in the kth iteration from the known (or initial) value of g to the unknown or (k + 1)st level, we write:

( gf*1 f= 2gk gf*1-(g, k )2

Подпись: k+1 k+1 і k+1 +1 _.k+1 /-% gi+1 ^gi + gi-1 + f k gi+1 gi-1 + 2m ДП2 i An m +1 Pressure Gradients and Boundary-Layer Profiles: A Qualitative Assessment Подпись: = 0.

Then, the finite-difference representation for the Falkner-Skan equation is:

Подпись: An2 2An Подпись: g k+1 + gi-1 + Подпись: An2 m+1 Подпись: J Подпись: An2 2An Подпись: gk++11 =■ Pressure Gradients and Boundary-Layer Profiles: A Qualitative Assessment

As before, this can be rearranged into a convenient tridiagonal system:

and the solution procedure closely follows that described for the Blasius problem. An initial guess for gi is inserted and the corresponding f; is found from trapezoidal – rule integration. The equation is solved as many times as required to reach a prescribed level of convergence.

Подпись: The Program FS provides the student experience in running such a solution method. The program determines the solution to the Falkner-Skan equation (Eq. 8.90) for any allowed value of p.

Numerical solutions for several values of the pressure-gradient parameter, p, are shown in Fig. 8.21. For negative values of p, an inflection point exists in the parallel velocity profile (u versus n), a point that was deduced previously using a qualitatitive argument. For the separation value (about P = -0.199), the inflection point is farthest away from the wall. Also, for the higher positive values of the pressure gradient, the boundary layer is thinner, as we might expect. The vertical-velocity profile (v versus n) also is shown in Fig. 8.21. Notice that the result is scaled to the parameter U1 and the square root of the Re number based on the distance x from the leading edge of the surface. Also note the remarkable feature that for favorable pressure gradients (P > 0.1, approximately), the normal velocity component is less than zero; that is, the flow is toward the surface and the boundary layer is thinner. It was demonstrated that boundary-layer thickness decreases for values of p greater than 1. Because increased p corresponds to an increasingly favorable pressure gradient, we see that the effect is to make the boundary-layer thickness increasingly smaller.

Table 8.2 lists the values of displacement thickness, momentum thickness, wall – shear stress, and skin-friction coefficient as a function of p.

Boundary Layer with a Streamwise Pressure Gradient

The presence of a streamwise pressure gradient has a significant effect on the boundary-layer profile and growth. Thus, a flat-plate solution should not be used (except as an approximation) to describe the boundary layer on an airfoil or wing surface, where the results of Chapters 5 and 6 show significant variations in chord – wise surface-pressure distribution, especially with increasing angle of attack.

The effect of a streamwise pressure gradient first is discussed from a qualitative physical viewpoint to fix ideas. Then, similar solutions are explained. These solutions are restricted to pressure gradients that have a particular dependence on streamwise distance; namely, xm. The topic of streamwise pressure gradients concludes with a dis­cussion of integral and numerical methods, both of which can be used for boundary – layer profiles in the presence of arbitrary streamwise pressure distributions.