Category Canonical impulse solutions

Compressible Potential Flows

Since shock waves in practical transonic flows are weak, such flows are nearly isentropic outside the viscous layers, so that their velocity field is nearly irrotational and hence can be represented by the full potential Ф.

V = УФ (8.21)

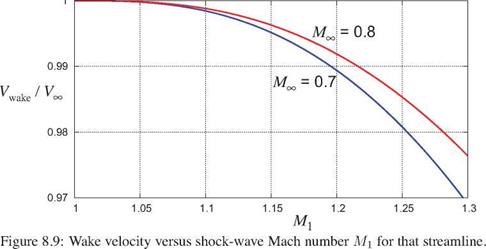
Since this V is irrotational it cannot exactly represent the slightly rotational flow in a shock wake. Specif­ically, defining V via the full potential will always result in exactly VWake/VL = 1 in the far-downstream shock wake. But as can be seen in Figure 8.9, in typical aerodynamic flows which have weak shock waves this error in the shock’s wake velocity is very small, and the effects on the surface pressures and hence on the lift are small as well. For this reason the slight error in the velocities will be neglected in most of the subsequent compressible potential flow analyses.

An exception is the wave drag, which by definition (8.19) is exactly zero when VWake/VL = 1. This short­coming will be resolved in Section 8.4.3 where the wave drag is defined in an alternative manner.

8.4.1 Full potential equation – problem formulation

A general compressible potential flow is described by the full potential (FP) equation which governs the full potential field Ф(r; Мж, а,в). The overall FP analysis problem is stated as follows.

(8.22)

Г along the span are additional unknowns, and are constrained with matching Kutta conditions along the span. Only one Г and one Kutta condition is present in 2D.

8.4.2 Full potential solution

Because the isentropic density as given by (8.23) has a complicated nonlinear dependence on УФ, analytic solutions to the FP analysis problem are not possible even for very simple geometries. Instead, solutions must be obtained numerically by using either a finite-volume or finite-element discretization method formu­lated on a space-filling grid. Such a method is commonly called a Full Potential Solver. If transonic flows are to be computed, some type of modification is also needed in order to capture shock waves. The most common approach is to modify the density in the FP equation (8.22) by an upwinding term proportional to the streamwise gradient of the density. One example of such a modification due to Hafez et al. [57] is

p ^ p – v a£ Vp – УФ/|УФ| (8.27)

where v is the upwinding parameter (comparable to unity in magnitude), and a£ is the local grid cell size. Note that in the limit of a very fine grid we have АІ ^ 0 and the density modification term disappears, so that the equation actually solved is consistent with the analytical FP equation.

Подпись: p{r; Moo,<x,f}) PL Compressible Potential Flows Compressible Potential Flows Подпись: Y/(Y-1)

Besides the body geometry, the required input parameters to the overall problem are the freestream Mach number ML and the freestream flow angles а, в. The resulting pressure field then has the same functional form as the potential,

so that the integrated force and moment coefficients will then also depend on MTO, а, в (or MTO, a in 2D).

Shock Waves and Wave Drag

Подпись: Po2 PO! Подпись: (7 + 1 )M2 V/(7 1} / 7 + 1 V/(7 1} ^ 7 (Afi — l)3 2 + (7—1)M2 /  1 — 7 + 27Af2 ) ~ I + 27 (Mi — 1) Подпись: (8.13)

The normal shock wave shown in Figure 8.6 will typically result in shock losses and associated wave drag which are important in transonic flows. From conservation of mass, momentum, and total enthalpy across a normal shock wave, the total pressure ratio across the shock is calculated to be

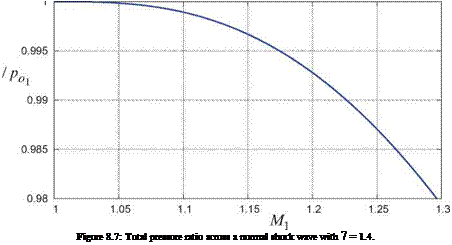
Подпись: Figure 8.7: Total pressure ratio across a normal shock wave with 7 = 1.4.

where M1 and po1 are just upstream of the shock, and p02 is just downstream. This ratio is plotted in Figure 8.7. The second approximate form in (8.13) is based on an asymptotic analysis of the exact form for M1 ^ 1. It shows that the total pressure loss is cubic in M1 — 1, with the “knee” roughly at M1 ~ 1.15 beyond which the loss increases rapidly.

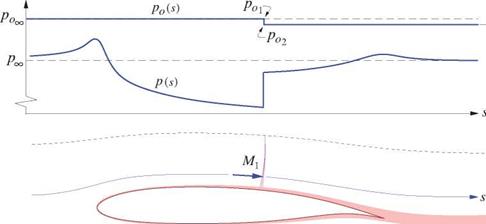
The streamlines passing through the shock suffer a reduction in total pressure, from p0l = p0ix down to p02 = P0wake which persists downstream, as shown in Figure 8.8. When they reach ambient pressure pTO downstream, they will therefore have a velocity below freestream VWake < VL>, and thus form a shock wake.

Подпись: owakeПодпись:Shock Waves and Wave Draghwake (A

shock defect (wave drag)

viscous defect (profile drag)

Подпись: Y_1 Y/(Y-1) / Y_1 т/(т-1) Po = p(l + ^-AT2J = pU + ^Ml Подпись: i + 2zlM2 (l-Yl ^ 2 001 V2 Shock Waves and Wave Drag

To quantify the magnitude of this shock wake defect we first write the total pressure in terms of the static pressure and the velocity.

Applying this to the shock wake we set p = and p0 = p0 k = p0ixi (p02 /p0l), which then gives the

Shock Waves and Wave Drag Shock Waves and Wave Drag Подпись: 2 wake VJ Подпись: ■т/(т-1) (8.15) (8.15) (8.17)

shock-wake velocity for any given streamline.

Shock Waves and Wave Drag

Here Mi is the shock-wave Mach number which that streamline had just before passing though the shock, as shown in Figure 8.8. The final simplified form (8.17) assumes і — VWake/VL ^ і which holds for any practical transonic flow. This wake velocity ratio is plotted in Figure 8.9 for two freestream Mach numbers.

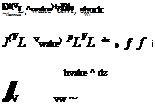
Подпись: Cdwave Shock Waves and Wave Drag Shock Waves and Wave Drag Shock Waves and Wave Drag

Total section drag/span is the total momentum defect of the wake shown in Figure 8.8. The wave drag is the part corresponding to the mass flow which passed through the shock, with the remainder being the usual viscous defect.

The approximations above assume that the wake defect is small compared to unity, which is quite reasonable.

Since typical transonic airfoils have cd ~ 0.0і or less, and the shock height and corresponding shock wake height is a significant fraction of the chord length, it is clear that the fractional defect і — VWake/VL must be kept well below roughly 0.01 to keep Cdwave from adding significantly to the total drag. Hence, a relatively weak shock of M1 < і.2 or less is required for acceptably low wave drag of transonic airfoils.

. Compressible Flow Quantities

The various thermodynamic definitions and relations derived in Chapter 1 will now be recast into forms suitable for compressible aerodynamic analysis.

8.2.1 Stagnation quantities

Подпись: o Подпись: o Подпись: V 2 a2 V2 = 7-1 + — 2 2 hOo = a2 V2 7-1 + 2 . Compressible Flow Quantities Подпись: (8.3) (8.4)

The stagnation enthalpy or equivalently the total enthalpy, which was defined and treated in Chapter 1, is constant in an adiabatic flow and is These must also be constant and equal to their freestream values, but only in isentropic regions of the flow.

. Compressible Flow Quantities . Compressible Flow Quantities Подпись: (8.7) (8.8)

The known freestream total enthalpy in (8.3) also gives convenient alternative expressions for the local speed of sound and Mach number in terms of their freestream values and the local normalized speed V/Vo.

8.2.2 Isentropic static density and pressure

1 + у Д/2

і+777 і + у л/-*

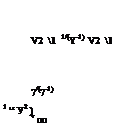
Подпись: _P_ po P_ Po . Compressible Flow Quantities . Compressible Flow Quantities Подпись: V2 1 1/(Y-1) V2 1 7/(7-1) 1 “ У2 ) v oo . Compressible Flow Quantities

Wherever po and Po are equal to the known freestream values, i. e. in isentropic regions of the flow, there we can express the static density and pressure only in terms of the Mach number or the velocity.

Since external aerodynamic analyses frequently employ the velocity potential, the velocity forms above will be the more useful ones here. Note that relation (8.10) is the same as the steady version of the compressible Bernoulli equation (1.112).

P – Poo

poV*

Подпись: Cp Подпись: 2 7 M2

The definition of the pressure coefficient remains unchanged from the incompressible case, but its depen­dence on the Mach number or velocity is now different.

Подпись: oПодпись: A-lПодпись: PПодпись: o. Compressible Flow Quantities(8.11)

(8.12)

Transonic flow and shock waves

In flows with a subsonic freestream, or M < 1, the maximum local Mach number can become supersonic, or M > 1. Such a flow with both subsonic and supersonic regions present is called a transonic flow. An example is shown in Figure 8.6. Transonic flows will be treated in more detail later in this chapter.

8.1.2 Flow-field representation

As mentioned above, the presence of field sources creates difficulties for a calculation method using the freestream+source+vorticity superposition to represent the flow. Consider a non-lifting case which can be represented by fictitious source sheets X(s, e) to represent the airfoil, and a source density a(r) as defined

Transonic flow and shock waves

x/c

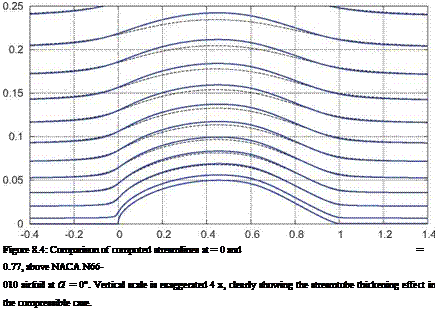
Подпись: Figure 8.4: Comparison of computed streamlines at = 0 and = 0.77, above NACA N66- 010 airfoil at а = 0°. Vertical scale is exaggerated 4 x, clearly showing the streamtube thickening effect in the compressible case.

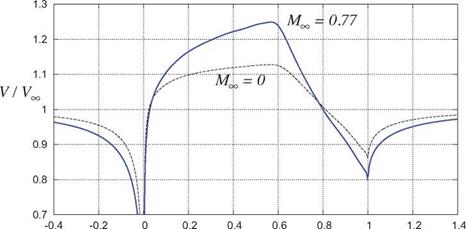
Figure 8.3: Comparison of surface speed distributions V(x) on NACA N66-010 airfoil at а = 0° at = 0 and = 0.77. Field sources and sinks increase the speed over most of the airfoil, and decrease the speed ahead and behind the airfoil.

Подпись: V(r) Transonic flow and shock waves Transonic flow and shock waves Подпись: 1 4n Transonic flow and shock waves Подпись: (8.2)

by (8.1) above to represent the field sources. The overall velocity field is then given as follows.

One difficulty is due to the integrand in the second superposition integral in (8.2) being nonlinear, since V2 and a2 both depend on the local V(r’). This is a relatively minor complication which could be handled with a suitable iterative solution method. The real difficulty arises from this being a volume integral, which requires a space-filling grid to enable its numerical evaluation. Such a method would then offer no advantage in the number of flow unknowns over a method which uses a grid-based flow-field representation approach. Furthermore, each unknown field source directly influences all field points, so the associated AIC matrix is large, dense, and would be dramatically expensive to solve. In contrast, in a grid-based method each flow unknown influences only its few grid neighbors, so the AIC matrices of grid methods are always very sparse and thus more economical to solve.

Flow-field changes

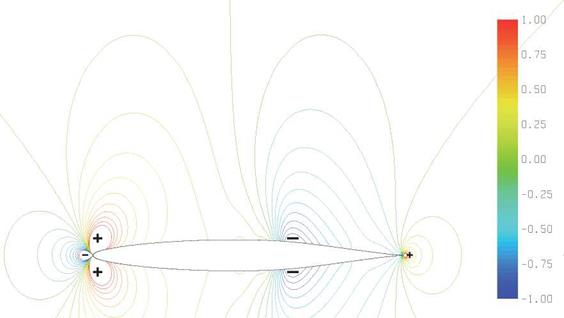
The field source distribution in a typical compressible flow-field over a 2D airfoil is shown in Figure 8.1. The acceleration over the front half of the airfoil produces a positive source area, while the deceleration over the rear half produces a negative source (sink) area. This has two major effects:

1. Increase in the overall velocity over the airfoil, as sketched on the left in Figure 8.2, and also quanti­tatively plotted in Figure 8.3.

3. Since the airfoil surface is fixed, the streamtubes can only thicken outward, which results in a lateral dilation of the overall velocity and pressure field isolines, which is quantitatively shown in Figure 8.5.

Flow-field changes

Figure 8.1: Contours of constant a(r) c/V» with increment 0.1, near NACA N66-010 airfoil at a = 0°, MTO = 0.77. Region over most of airfoil’s front half has a > 0 (sources), and region over rear half has a< 0 (sinks).

Flow-field changes

Figure 8.2: Comparison of velocity vectors and streamlines between incompressible (dashed) and compressible (solid) flows. Source and sink regions in the compressible case increase the velocity adjacent to the airfoil (left), and also cause streamtube thickening (right).

Compressible Aerodynamic Flows

This chapter will examine the aerodynamics of airfoils, wings, and bodies in compressible flow. Modeling techniques, approximations, and associated solution methods will also be examined, particularly for the important class of small-disturbance flows. Subsonic, transonic, and supersonic flows will be addressed.

8.1 Effects of Compressibility

8.1.1 Compressibility definition

1 V(V[6]) • V

2 a^~

Подпись: a(r) = V ■ V Подпись: -Vp-V p Подпись: 2 ds Подпись: = 0 Подпись: (8.1)

A compressible flow is defined as one with significant density p variations along particle pathlines. The resulting complications for flow-field representation were briefly discussed in Chapter 2. To summarize, a compressible flow has a nonzero field source distribution a(r), which can be related to the density-gradient and velocity fields via the continuity equation and the isentropic density-speed relation.

This field source must be accounted for if source+vorticity superposition is employed to represent the ve­locity field. However, because this a(r) is typically extensive, it cannot be effectively lumped into source sheets, lines, or points, so that actually performing the velocity superposition calculation numerically, or constructing its AIC matrices, becomes impractical for the general case, especially in 3D. Resorting to CFD methods which used grid-based flow-field representation then becomes necessary.

One exception is the case of small-disturbance flows, for which the field source distribution can be approx­imately accounted for via the Prandtl-Glauert coordinate transformation. The superposition approach then becomes effective again for such compressible flows. These will be treated later in this chapter.

Apparent mass

It is useful to note that the dimensional lift/span corresponding to ciA given by (7.56) is

L’a = pU2cctA = m’A(h + U0) (7.57)

mA = pn(c/2)2 (7.58)

where mA is the apparent mass (per unit span), which is the mass of a unit-span cylinder of fluid whose diameter is airfoil chord. Hence, subjecting an airfoil to a normal acceleration results in an additional reaction force as though this cylindrical mass of the air was attached to the airfoil and also accelerated. The effective normal acceleration, in addition to h, also includes a Coriolis-like term Uв due to airfoil rotation.

3.1.7 Sinusoidal motion solution

Theodorsen [56] derived solutions for the case of small-magnitude sinusoidal motion at some frequency w, specifically for use in predicting wing flutter. This situation is most conveniently treated by the introduction
of complex variables,

h(t)

= ho cos (ut + ф^

= Re{h elwt} ;

h = ho e1^

(7.59)

0(t)

= 0o cos (ut + фв)

= Re{0elwt} ;

9 = 0o e1^

(7.60)

where the convenient complex amplitudes h, 9 incorporate both the heave and pitch amplitudes ho,9o, and also the heave and pitch phase angles ph,^e. The notation Re{} denotes the real part of a complex quantity.

Apparent mass Подпись: k Apparent mass Подпись: (7.61) (7.62) (7.63) (7.64) (7.65) (7.66) (7.67)

Substitution of the sinusoidal h(t) and 9(t) expressions above into the general-motion Wagner solutions (7.55) and (7.56), gives the following solution for the lift coefficient, again as a sum of quasi-steady and apparent – mass contributions. The pitching moment coefficient can also be obtained.

The dimensionless parameter k which appears in this Theodorsen solution is the reduced frequency, which was previously mentioned in Section 1.5.3. It affects the strength of the shed vorticity, and also is a measure of the relative importance of the ф term in the unsteady Bernoulli equation (7.19). The other relevant parameters which appear are the maximum heave/chord ratio ho/c, the maximum pitch displacement 9o, and the relative phase фh — фв between the heave and pitch motions.

For finite values of k, the circulatory parts of the lift and moment in (7.61) and (7.64) are modified by the Theodorsen Lag Function C(k) factor. This is a complex quantity, and is explicitly defined in terms of standard and modified Bessel functions J0, J1 and Y0,Y, respectively.

Ho(k) = Jo(k) — i Y0(k) , Hi(k) = Ji(k) — i Yi(k)

Подпись: (7.68)Hi(k) + iHo(k)

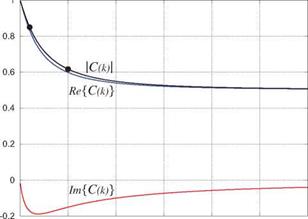
Its real and imaginary components and its magnitude and phase angle are plotted in Figure 7.10.

In the quasi-steady limit k ^ 0 the lag function becomes unity, C(o) = 1 + 0i, and also all the time-rate terms in the unsteady lift and moment expressions become negligible. The resulting lift and moment coefficients then reduce to cg = 2па, cmc/2 = cg/4, which matches thin airfoil theory.

For k>0 we have |C(k)| < 1 and ZC(k) < 0, so the lift contribution of cgQ will now be reduced in magnitude and will also have a phase lag. The main origin of these effects is the convection of shed vorticity into the wake. This contributes a vertical velocity w at the airfoil which tends to oppose the current angle of attack,
and thus reduces the lift magnitude. But this vertical velocity contribution is delayed by the vorticity’s convection time into the wake, which results in the phase lag.

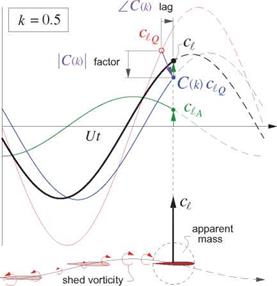
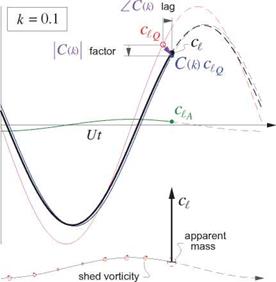
As in the general-motion result (7.56), the remaining aA and cmA “apparent-mass” parts act instantaneously. Because of their extra time derivatives these introduce phase leads into the lift and moment, but become significant only at larger k values. Figure 7.11 shows the relative magnitudes of these various contributions to the lift for sinusoidally-heaving airfoils at two different reduced frequencies.

0 0.5 1

1.5 k 2 2.5 3

Подпись: 0 0.5Подпись: L5 k 2Подпись: 2.5Apparent mass3

Apparent mass Apparent mass

Figure 7.10: Real and imaginary parts, and magnitude and phase of the Theodorsen lag function. Magnitude and phase lag values at k = 0.1 and k = 0.5 are used in the example in Figure 7.11.

Figure 7.11: Unsteady lift coefficient components of airfoils undergoing sinusoidal heaving at zero pitch angle. Only the physical (real) parts are shown. The two airfoils have the same heave amplitude and wavelength, but different chords and hence different reduced frequencies k = n x chord/wavelength. The quasi-steady lift ciQ = 2па3с/4 is lagged and reduced in magnitude by the C(k) Theodorsen function associated with shed vorticity. The impulsive lift contribution Qa is the inertial reaction of the fluid’s apparent mass subjected to vertical acceleration, and leads the quasi-steady lift by 90o.

Apparent mass

. General motion solution

. General motion solution . General motion solution Подпись: (7.55) (7.56)

The airfoil lift for a general motion can be obtained by Duhamel’s (convolution) integral, which is a super­position of the infinitesimal step solutions over the motion history.

The inputs are the airfoil motion given by h(t) and 0(t), and the atmospheric gust motion given by wgust(t). These quantities define a3c/4(t) and agust(t) which are then used in the convolution integrals for ciq above, and are also used directly for clA.

Canonical impulse solutions

A solution to equations (7.42) and (7.43) have been obtained by Wagner [54] based on a unit step in h,9,9 corresponding to a sudden change of airfoil motion in heave rate, pitch, and pitch rate. Kussner [55] obtained a solution for the case of a unit step of wgust, corresponding to the airfoil flying into a uniform vertical gust field with a sharp boundary.

In the Wagner case an important quantity is the angle of attack relative to the camber line at the |-chord location, or x = c/4.

Подпись: (7.47)h 9c

«ЗС/4 – JJ + 9 + —

Подпись: agust Подпись: Wgust U Подпись: (7.48)

In the Kussner case the relevant quantity is the apparent angle of attack resulting from the vertical gust velocity shown in Figure 7.8, which is assumed to act everywhere on the chord.

If these quantities have step jumps of Д«3с/4 and/or Aagust at t = 0, then the lift is

V

pU‘2c

where Ф(ї) is the Wagner function, Ф(ї) is the Kussner function, and 5(t) is the unit impulse function. Their argument t is a non-dimensionalized time, which can also be interpreted as the distance that the airfoil has moved, in units of half-chord.

The lift is seen to be the sum of two parts:

1) C£q is the “quasi-steady” or “circulatory” part associated with vorticity shedding and circulation, and evolves in time according to the Wagner and Kussner functions shown in Figure 7.9.

2) ciA is an “apparent-mass” or “impulsive” part associated with the instantaneous acceleration of the fluid immediately adjacent to the airfoil. A step change in velocity or angle produces an infinite acceleration, resulting in the impulsive lift.

Both the Wagner and Kussner functions asymptote to unity in the limit t ^ <x>. Therefore, the general solution (7.50) asymptotes to the value = 2n(Aa3c/4 + Aagust), as expected from steady thin airfoil theory.

The exact Wagner and Kussner functions cannot be expressed in terms of elementary functions, but are available in tabulated form. For calculations, the following curve-fit expressions are fairly accurate and convenient.

Подпись: (7.53) (7.54) Ф(t) = 1 – 0.165 exp(—0.045t) – 0.335 exp(—0.3t) Ф(ї) = 1 — 0.5exp(-0.137) — 0.5exp(—1.0f)