Category Dynamics of Flight

Effect of Structural Flexibility

Many vehicles when flying near their maximum speed are subject to important aero – elastic phenomena. Broadly speaking, we may define these as the feedback effects upop the aerodynamic forces of changes in the shape of the airframe caused by the aerodynamic forces. No real structure is ideally rigid, and aircraft are no exception. Indeed the structures of flight vehicles are very flexible when compared with bridges, buildings, and earthbound machines. This flexibility is an inevitable characteristic of structures designed to be as light as possible. The aeroelastic phenomena which result may be subdivided under the headings static and dynamic. The static cases are those in which we have steady-state distortions associated with steady loads. Examples are aileron reversal, wing divergence, and the reduction of longitudinal stability. Dy­namic cases include buffeting and flutter. In these the time dependence is an essential element. From the practical design point of view, the elastic behavior of the airplane affects all three of its basic characteristics: namely performance, stability, and struc-

Effect of Structural Flexibility

tural integrity. This subject occupies a well-established position as a separate branch of aeronautical engineering. For further information the reader is referred to one of the books devoted to it (Bisplinghoff, 1962; Dowell, 1994).

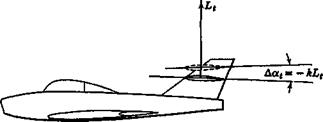
In this section we take up by way of example a relatively simple aeroelastic ef­fect; namely, the influence of fuselage flexibility on longitudinal stiffness and con­trol. Assume that the tail load L, bends the fuselage so that the tail rotates through the angle Да, = – kL, (Fig. 3.9) while the wing angle of attack remains unaltered. The net angle of attack of the tail will then be

a, = awb – e – i, ~ kL, and the tail lift coefficient at 8(, = 0 will be

C/„ = а, a, = a,(aKh – є – і, – kL,)

But L, = CLihpV2S„ from which

CL, = a,(awb -€~i,- kClJzpV2Sl)

(3.5,1)

Solving for CLi, we get

Cl,

CL, p wb ^ if)

(3.5,2)

1 + ka, S,~V2 2

Comparison of (3.5,2) with (2.3,13) shows that the tail effectiveness has been re­duced by the factor 1/[1 + ka,(p/2)V2S,]. The main variable in this expression is V, and it is seen that the reduction is greatest at high speeds. From (2.3,23) we find that the reduction in tail effectiveness causes the neutral point to move forward. The shift is given by

Да, _ / де

д h„ =—- VH 1 – — (3.5,3)

a da

Подпись: Да, = а, Подпись: 1 1 + ka,lpV2S, Подпись: (3.5,4)

where

The elevator effectiveness is also reduced by the bending of the fuselage. For, if we consider the case when 8e is different from zero, then (3.5,1) becomes

Effect of Structural Flexibility

Cu = a,(awb – є-i, – kC[ppV2Sl) + ae8e

and (3.5,2) becomes

c = at(<xWb – e – it) + ae8e L’ 1 + ka, hpV2St

Thus the same factor 1/(1 + ka, p/2V2S,) that operates on the tail lift slope a, also mul­tiplies the elevator effectiveness ae.

THE INFLUENCE OF JET ENGINES

The direct thrust moment of jet engines is treated as shown at the beginning of this section, the constant-thrust idealization given in (3.4,6) often being adequate. In addi­tion, however, there is a normal force on jet engines as well as on propellers.

Jet Normal Force

The air that passes through a propulsive duct experiences, in general, changes in both the direction and magnitude of its velocity. The change in magnitude is the prin­cipal source of the thrust, and the direction change entails a force normal to the thrust

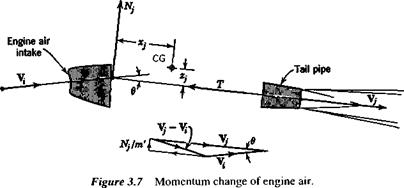
line. The magnitude and line of action of this force can be found from momentum considerations. Let the mass flow through the duct be m’ and the velocity vectors at the inlet and outlet be V, and Vr Application of the momentum principle then shows that the reaction on the airplane of the air flowing through the duct is

F = – V,-) + F’

where F’ is the resultant of the pressure forces acting across the inlet and outlet areas. For the present purpose, F’ may be neglected, since it is approximately in the direc­tion of the thrust T. The component of F normal to the thrust line is then found as in Fig. 3.7. It acts through the intersection of V, and V,, The magnitude is given by

Nj = m’Vj sin в

or, for small angles,

Nj = m’Vie (3.4,11)

In order to use this relation, both Vi and в are required. It is assumed that F, has that direction which the flow would take in the absence of the engine; that is, в equals the angle of attack of the thrust line a, plus the upwash angle due to wing induction e;.

6=ctj+ €j (3.4,12)

THE INFLUENCE OF JET ENGINES Подпись: (3.4,13)

It is further assumed that the magnitude V, is determined by the mass flow and inlet area; thus

THE INFLUENCE OF JET ENGINES

where A, is the inlet area, and p, the air density in the inlet. We then get for Nj the ex­pression

The corresponding pitching-moment coefficient is

Подпись: (3.4,14)Пі’2 X: ■

Подпись: AjPi lpV2Sc

THE INFLUENCE OF JET ENGINES

Дcm = -— 7 (a.- + €/)

Since the pitching moment given by (3.4,14) varies with a at constant thrust, then there is a change in Cma given by

THE INFLUENCE OF JET ENGINES

THE INFLUENCE OF JET ENGINES

(3.4,15)

The quantities m’ and p, can be determined from the engine performance data, and for subsonic flow, dcj/da is the same as the value дєр/да used for propellers, dxfda can be calculated from the geometry.

Jet Induced Inflow

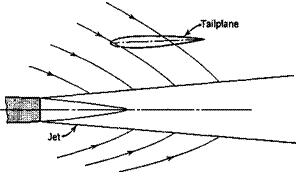
A spreading jet entrains the air that surrounds it, as illustrated in Fig. 3.8, thereby inducing a flow toward the jet axis. If a tailplane is placed in the induced flow field, the angle of attack will be modified by this inflow. A theory of this phenomenon which allows for the curvature of the jet due to angle of attack has been formulated by Ribner (1946). This inflow at the tail may vary with a sufficiently to reduce the stability by a significant amount.

THE INFLUENCE OF RUNNING PROPELLERS

The forces on a single propeller are illustrated in Fig. 3.5, where ap is the angle of at­tack of the local flow at the propeller. It is most convenient to resolve the resultant into the two components T along the axis, and Np in the plane of the propeller. The moment associated with T has already been treated above, and does not affect Cma. That due to Np is

Подпись: (3.4,7)AC = C — — – c 5

where CN = Np/hpV2Sp and Sp is the propeller disk area. To get the total ACm for sev­eral propellers, increments such as (3.4,7) must be calculated for each and summed. Theory shows (Ribner, 1945) that for small angles CNp is proportional to ap. Hence Np contributes to both C and dCmJda. The latter is

Подпись: (3.4,8)dCmp = Sp_ dCNp dap Эс* Sc дар da

If the propeller were situated far from the flow field of the wing, then dap/da would be unity. However, for the common case of wing-mounted tractor propellers with the
propeller plane close to the wing, there is a strong upwash ep at the propeller. Thus

Подпись:Подпись: (3.4,9)and

THE INFLUENCE OF RUNNING PROPELLERS Подпись: (3.4,10)

where the constant in (3.4,9a) is the angle of attack of the propeller axis relative to the airplane zero-lift line. Finally,

Increase of Wing Lift

When a propeller is located ahead of a wing, the high-velocity slipstream causes a distortion of the lift distribution, and an increase in the total lift. This is a principal mechanism in obtaining high lift on so-called deflected slipstream STOL airplanes. For accurate results that allow for the details of wing and flap geometry powered – model testing is needed. However, for some cases there are available theoretical re­sults (Ellis, 1971; Kuhn, 1959; Priestly, 1953) suitable for estimates. Both theory and experiment show that the lift increment tends to be linear in a for constant CT, and hence has the effect of increasing awb, the lift-curve slope for the wing-body combi­nation. From (2.3,23) this is seen to reduce the effect of the tail on the NP location, and can result in a decrease of pitch stiffness.

Effects on the Tail

The propeller slipstream can affect the tail principally in two ways. (1) Depend­ing on how much if any of the tail lies in it, the effective values of a, and ae will expe­rience some increase. (2) The downwash values e0 and de/da may be appreciably al­tered in any case. Methods of estimating these effects are at best uncertain, and powered-model testing is needed to get results with engineering precision for most new configurations. However, some empirical methods (Smelt and Davies, 1937; Millikan, 1940; Weil and Sleeman, 1949) are available that are suitable for some cases.

. Influence of the Propulsive System on Trim and Pitch Stiffness

The influences of the propulsive system upon trim and stability may be both impor­tant and complex. The range of conditions to be considered in this connection is ex­tremely wide. There are several types of propulsive units in common use—recipro­
cating-engine-driven propellers, turbojets, turboprops, and rockets, and the variations in engine-plus-vehicle geometry are very great. The analyst may have to deal with such widely divergent cases as a high-aspect-ratio straight-winged airplane with six wing-mounted counterrotating propellers or a low-aspect-ratio delta with buried jet engines. Owing to its complexity, a comprehensive treatment of propulsive system influences on stability is not feasible. There does not exist sufficient theoretical or empirical information to enable reliable predictions to be made under all the above – mentioned conditions. However, certain of the major effects of propellers and propul­sive jets are sufficiently well understood to make it worth while to discuss them, and this is done in the following.

In a purely formal sense, of course, it is only necessary to add the appropriate di­rect effects, Cmo and dCmp/da in (2.3,21 and 22), together with the indirect effects on the various wing-body and tail coefficients in order to calculate all the results with power on.

Подпись: Cj- (-■£) -F Сцг sin у Cw cos у = CL + CTaT Подпись: (a) Cb) Подпись: (3.4,1)

When calculating the trim curves (i. e., elevator angle, tab angle, and control force to trim) the thrust must be that required to maintain equilibrium at the condition of speed and angle of climb being investigated (see Sec. 2.4). For example (see Fig. 2.1), assuming that aT < 1

Solving for CT, we get

Подпись: (3.4,2)CD + CL tan у 1 — aT tan у

Except for very steep climb angles, artan у <§ 1, and we may write approximately,

CT= CD + CL tan у (3.4,3)

Подпись: C„ Подпись: T - c

Let the thrust line be offset by a distance zP from the CG (as in Fig. 3.5) and neglect­ing for the moment all other thrust contributions to the pitching moment except Tzp, we have

Now let CD be given by the parabolic polar (2.1,2), so that

cm„ = (C0min + KCL2 + C, tan y) — (3.4,5)

c

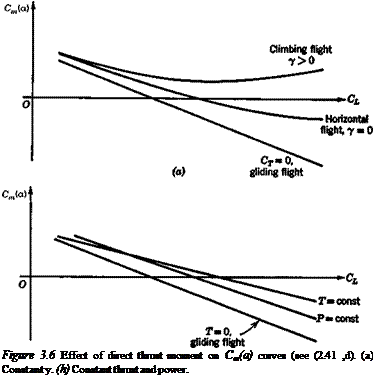
Strictly speaking, the values of CD and CL in (3.4,4 and 5) are those for trimmed flight, i. e. with Se = <5Cinm. For the purposes of this discussion of propulsion effects we shall neglect the effects of 8e on CD and CL, and assume that the values in (3.4,5) are those corresponding to 8e = 0. The addition of this propulsive effect to the Cm curve for rectilinear gliding flight in the absence of aeroelastic and compressibility effects might then appear as in Fig. 3.6a. We note that the gradient ~dCJdCL for any value of у > 0 is less than for unpowered flight. If dCJdCL is used uncritically as a criterion for stability an entirely erroneous conclusion may be drawn from such curves.

1. Within the assumptions made above, the thrust moment Tzp is independent of a, hence ЭCmJda = 0 and there is no change in the NP from that for unpow­ered flight.

2. A true analysis of stability when both speed and a are changing requires that the propulsive system controls (e. g., the throttle) be kept fixed, whereas each point on the curves of Fig. 3.6a corresponds to a different throttle setting. This parallels exactly the argument of Sec. 2.4 concerning the elevator trim slope.

Подпись:
(b)

For in fact, under the stated conditions, the Cm — CL curve is transformed into a curve of Setnm vs. V by using the relations дЄиіт = – Ст(а)ІС„щ and CL = W!pV2S. The slopes of Cm vs. CL and 8emm vs. V will vanish together.

If a graph of Cm vs. C, be prepared for fixed throttle, then у will be a variable along it, and its gradient dCJdCL is an index of stability, as shown in Sec. 6.4. The two idealized cases of constant thrust and constant power are of interest. If the thrust at fixed throttle does not change with speed, then we easily find

Подпись: (a)T zr Cm = — CL — m” W c

Подпись: and

Подпись: Tzp Wc Подпись: dC,ri dC, Подпись: ib)

(3.4,6)

Подпись: whence . Influence of the Propulsive System on Trim and Pitch Stiffness Подпись: (c) (d) Подпись: (3.4,6)

If the power P is invariant, instead of the thrust, then T = P/V and we find

Thus in the constant thrust case, the power-off Cm — Cf graph simply has its slope changed by the addition of thrust, and in the constant power case the shape is changed as well. The form of these changes is illustrated in Fig. 3.6b and it is evident by comparison with 3.6a that the behavior of dCJdCL is quite different in these two situations.

Influence of High-Lift Devices on Trim and Pitch Stiffness

Conventional airplanes utilize a wide range of aerodynamic devices for increasing Cimax. These include various forms of trailing edge elements (plain flaps, split flaps,

slotted flaps, etc.), leading edge elements (drooped nose, slats, slots, etc.) and purely fluid mechanical solutions such as boundary layer control by blowing. Each of these has its own characteristic effects on the lift and pitching moment curves, and it is not feasible to go into them in depth here. The specific changes that result from the “con­figuration-type” devices, i. e. flaps, slots, etc., can always be incorporated by making the appropriate changes to hnwb, Cmm. wb and CLwh in (2.2,4) and following through the consequences. Consider for example the common case of part-span trailing edge flaps on a conventional tailed airplane. The main aerodynamic effects of such flaps are illustrated in Fig. 3.4.[8]

1. Their deflection distorts the shape of the spanwise distribution of lift on the wing, increasing the vorticity behind the flap tips, as in (a).

2. They have the same effect locally as an increase in the wing-section camber, that is, a negative increment in Cmac and a positive increment in CLwh.

3. The downwash at the tail is increased; both e0 and Эе/Эa will in general change.

The change in wing-body Cm is obtained from (2.2,4) as

д= ACmacwh + ACLJh – hnJ (3.3,1)

The change in airplane CL is

ACl = A CLwh – а, у Де (3.3,2)

and the change in tail pitching moment is

ACmt = a, VH Де (3.3,3)

When the increments ДСШа< л and ACUh are constant with a and Ah, hh is negligible, then the only effect on CLa and Cma is that of Эе/Э a, and from (2.3,18) and (2.3,21a) these are

<i

и

<i

S, де

= ~a‘ J A Э^

(3.3,4)

_ Эе

= (h – KJAa + a, VHA —

(3.3,5)

The net result on the CL and Cm curves is obviously very much configuration depen­dent. If the Cm — a relation were as in Fig. 3.4c, then the trim change would be very large, from a, at Sf = 0 to a2 after flap deflection. The C, at a2 is much larger than at a, and hence if the flap operation is to take place without change of trim speed, a down-elevator deflection would be needed to reduce atrim to a, (Fig. 3.4c). This would result in a nose-down rotation of the aircraft.

Control Force per g

From (2.8,4) we get the incremental control force

AP = GSecehpV2 AChe (3.2,1)

Che is given for rectilinear flight by (2.5,2). Since it too will in general be influenced by q, we write for the incremental value (AS, = 0)

A Che = Clu, nAa + Cheqq + b2ASe (3.2,2)

AC*.

Подпись: 2/AQ Control Force per g Подпись: ^-'Ls/-'hea c,_ Подпись: (3.2,3)

The derivative Ch is discussed in Sec. 5.4. Using (3.1,4) and (3.1,6b), (3.2,2) is readily expanded to give

Подпись: where Control Force per g Control Force per g

From (2.6,46) we note that the last parenthetical factor is b2C’LJCLa or b2a’la. For ASe we use the approximation (3.1,9) in the interest of simplicity and the result for A Che after some algebraic reduction is

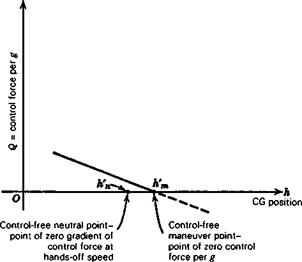
In keeping with earlier nomenclature, h’m is the control-free maneuver point and (h’m — h) is the corresponding margin. On noting that CwpV2 is the wing loading w, we find the control force per g is given by

AP a’b2

Q = —— Г = ~GSecew —— (2ц – CL)(h – h’J (3.2,6)

n — 1 Ipudet

Note that this result applies to both tailed and tailless aircraft provided that the appro­priate derivatives are used. The following conclusions may be drawn from (3.2,6).

1. The control force per g increases linearly from zero as the CG is moved for­ward from the control-free maneuver point, and reverses sign for h > h’m.

2. It is directly proportional to the wing loading. High wing loading produces “heavier” controls.

3. For similar aircraft of different size but equal wing loading, Q Sece i. e. to the cube of the linear size.

4. Neither CL nor V enters the expression for Q explicitly. Thus, apart from M and Reynolds number effects, Q is independent of speed.

5. The factor ц which appears in (3.2,5) causes the separation of the control-free neutral and maneuver points to vary with altitude, size, and wing loading, in the same manner as the interval (hm — hn).

Figure 3.3 shows a typical variation of Q with CG position. The statement made above that the control force per g is “reversed” when h> h’m must be interpreted cor-

Control Force per g

Figure 3.3 Control force per g.

rectly. In the first place this does not necessarily mean a reversal of control move­ment per g, for this is governed by the elevator angle per g. If h’m < h < hm, then there would be reversal of Q without reversal of control movement. In the second place, the analysis given applies only to the steady state at load factor n, and throws no light whatsoever on the transition between unaccelerated flight and the pull-up condition. No matter what the value of h, the initial control force and movement re­quired to start the maneuver will be in the normal direction (backward for a pull-up), although one or both of them may have to be reversed before the final steady state is reached.

CONTROL-FORCE GADGETS

The control forces on a manually controlled airplane can be made to deviate from the “natural” pattern that flows from the size of the airplane, the aerodynamic design, and the speed and altitude of flight without necessarily using either powered controls or aerodynamic tabs (see Sec. 2.7). Some “gadgets” that can be used to this end are springs, weights, and variable-ratio sprockets and linkages. These can have the effect of modifying the control-force to trim and the control-force per g, giving the pilot the same feel as if the control-free neutral and maneuver points were moved. Some de­tails of these effects are given in Sec. 7.1 of Etkin (1972).

Static Stability and Control

3.1 Maneuverability—Elevator Angle per g

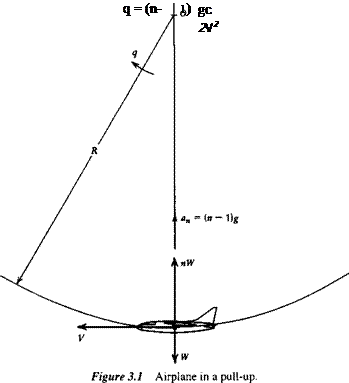
In this and the following sections, we investigate the elevator angle and control force required to hold the airplane in a steady pull-up with load factor1 n (Fig. 3.1). The concepts discussed here were introduced by S. B. Gates (1942). The flight-path tan­gent is horizontal at the point under analysis, and hence the net normal force is L — W = (n — 1)W vertically upward. The normal acceleration is therefore (n — 1 )g.

When the airplane is in straight horizontal flight at the same speed and altitude, the elevator angle and control force to trim are 8e and P, respectively. When in the pull-up, these are changed to 8e + A8e and P + ДP. The ratios Д8J(n – 1) and AP/(n — 1) are known, respectively, as the elevator angle per g, and the control force per g. These two quantities provide a measure of the maneuverability of the airplane; the smaller they are, the more maneuverable it is.

The angular velocity of the airplane is fixed by the speed and normal accelera­tion (Fig. 3.1).

Подпись:(n ~ l)g
V

As a consequence of this angular velocity, the field of the relative air flow past the airplane is curved. It is as though the aircraft were attached to the end of a whirling arm pivoted at О (Fig. 3.1). This curvature of the flow field alters the pressure distri­bution and the aerodynamic forces from their values in translational flight. The change is large enough that it must be taken into account in the equations describing the motion.

We assume that q and the increments Да, A8e etc. between the rectilinear and curved flight conditions are small, so that the increments in lift and moment may be written

Д CL = CLa Да + CLqq + CLsA8e (3.1,2)

ДСт = CmAa + Cmqq + CmsA8e (3.1,3)

where, in order to maintain a nondimensional form of equations, we have introduced the dimensionless pitch rate q = qc/2V, and CLq = dCJdq, Cmq = dCJdq. The q de-

‘The load factor is the ratio of lift to weight, n = LAV. It is unity in straight horizontal flight.

Static Stability and Control

rivatives are discussed in Sec. 5.4. In this form, these equations apply to any configu­ration. From (3.1,1) we get

which is more conveniently expressed in terms of the weight coefficient Cw and the mass ratio /jl (see Sec. 3.15), that is,

q = in – 1) —’- (3.1,4)

2/x

Since the curved flight condition is also assumed to be steady, that is, without angular acceleration, then ACm = 0. Finally, we can relate AC, to n thus:

Подпись: (3.1,5)nW-W

ACl = pVzs ={n~ 1)Cw Equations (3.1,2 and 3) therefore become

which are readily solved for Да and Д8e to yield the elevator angle per g

and

where det is the same expression previously given in (2.4,13d). As has been shown in Sec. 2.4 det does not depend on CG position, hence the variation of Д8J(n — 1) with h is provided by the terms in the numerator. Writing Cma = CL(h — hn) (3.1,6a) be­comes

Подпись: (3.1,7)A8e CWCL (2fx – CL) ( Cm

—- «_ =—— w L«y P— V h_h + ———- Hi—

n — 1 2 fidet 2/i — CLq

Подпись: hm = h„ Подпись: Cmq(hJ 2д - CLq(hJ Подпись: (3.1,8)

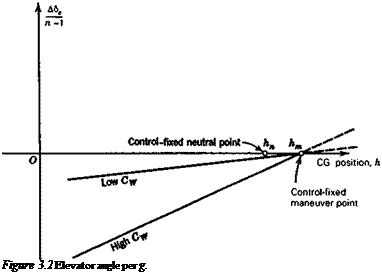
The derivatives CLq and Cm both in general vary with h, the former linearly, the latter quadratically, (see Sec. 5.4). Thus (3.1,7), although it appears to be linear in h, is not exactly so. For airplanes with tails, CLq can usually be neglected altogether when compared with 2fi, and the variation of Cmq with h is slight. The equation is then very nearly linear with h, as illustrated in Fig. 3.2. For tailless airplanes, the variation may show more curvature. The point where Д8J(n — 1) is zero is called the control-fixed maneuver point, and is denoted by hm, as shown. From (3.1,7) we see that

Подпись: A5e n — 1 Static Stability and Control Подпись: (3.1,9)

where Cmq(hm) and CLq(hm) are the values of these two derivatives evaluated for h = hm. When Cmq and CLq can be assumed to be independent of h, (3.1,7) reduces to

Подпись: Figure 3.2 Elevator angle per g.

The difference (hm — h) is known as the control-fixed maneuver margin.

Exercises

2.1 A subsonic transport aircraft has a tapered, untwisted sweptback wing with straight leading and trailing edges. The wing tips are straight and parallel to the root chord. In the following, use the data of Appendix C and assume that the airfoil section local aerodynamic center is at the |-chord point.

(a) Make an accurate three-view drawing of the wing chord plane.

(b) Calculate wing area S, aspect ratio A, taper ratio A = c, lcr and the mean aerody­namic chord c.

(c) Calculate the location of the wing’s mean aerodynamic center, and locate it and c on the side view of the wing (with dimensions). (Assume a uniform additional lift coefficient Cla = CL.)

(d) The aircraft is to be operated with its most rearward CG position limited to 25 ft (7.62 m) aft of the apex of the wing. The distance between the wing and tail mean aerodynamic centers is Ї, = 55 ft (16.76 m). Estimate the tail area required to provide a control-fixed static margin of at least 0.05 at all times. Assume that a, = awh and h„w = hnnb. Ignore power plant effects and use дє/да = 0.25.

Подпись: 150 ft (45.72 m) 25 ft (7.62 m) 12 ft (3.66 m) Geometric Data Wing Span, b Root Chord, cr Tip Chord, c,

Leading edge sweep, A0 26°

Dihedral angle, у 4°

2.2 Evaluate the validity of the approximation made in going from (2.2,2) to (2.2,3) by using the data for the airplane of Exercise (2.1) and calculating C,„ r from both equa­tions. Assume CDw = CD + KC ju and L = Lw. The following additional data are provided.

Geometric Data

Weight, W 207,750 lb (924,488 N)

zlc 0.15

Aerodynamic Data

a„ 0.080/deg

Cmacw -0.05

CD 0.013

К 0.054

V 350 kts (180 m/s)

p 2.377 X 10³ slugs/ft3 (1.225 kg/m3)

2.3 Show that if Cmwh is a linear function of CLwb then Cm is a constant.

2.4 Beginning with (2.3,1) perform the reductions to derive (2.3,20) to (2.3,23).

2.5 The following data apply to a is scale wind tunnel model of a transport airplane. The full-scale mass of the aircraft is 1,552.80 slugs (22,680 kg). Assume that the aerody­namic data can be applied at full-scale. For level unaccelerated flight at V = 239 knots (123 m/s) of the full-scale aircraft, under the assumption that propulsion effects can be ignored,

(a) Find the limits on tail angle і, and CG position h imposed by the conditions Cmo > 0 and Cma < 0.

(b) For trimmed flight with 8e = 0, plot i, vs. h for the aircraft and indicate where this line meets the boundaries of part (a).

Подпись: 1.50 ft2 (0.139 m2) 6.145 in (15.61 cm) 15.29 in (38.84 cm) 0.368 ft2 (0.0342 m2)Geometric Data Wing area, S

Wing mean aerodynamic chord, c

I

Tail area, S,

Aerodynamic Data

awb 0.077/deg

a, 0.064/deg

e„ 0.72°

Эе

— 0.30

да

Подпись: -0.018^™«ч,*

Exercises

Kwh 0.25

p 2.377 X 1(T3 slugs/ft3 (1.225 kg/m3)

2.6* The McDonnell Douglas C-17 is a four-engined jet STOL transport airplane.

(a) Find A and c for the wing using the geometrical data and Appendix C.

(b) Use Appendix В to estimate aw, the wing lift curve slope, assuming that /3 = 1 and к = 1.

(c) If a, = 0.068/deg and awb = aw, find the lift curve slope, a, of the aircraft. As-

дє 2 aw

sume — = —- (with aw expressed in rad da 7tA

(d) Find Cma for the case where l, = 1, = 92 ft (28.04 m). Ignore propulsion effects.

* Problem courtesy of Professor E. K. Parks, University of Arizona.
Exercises

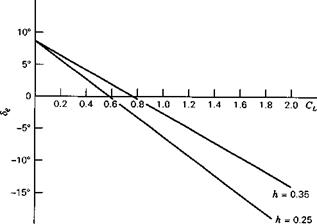
Figure 2.30 Trim data for Exercise 2.6.

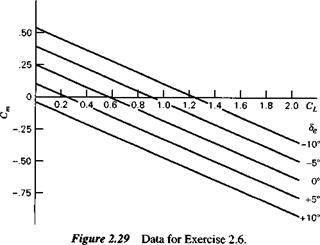
(e) From the experimental curves of Figs. 2.29 and 2.30 and the given geometry, find Cms and h„. Find Cma for h = 0.30.
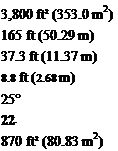
Подпись: 3,800 ft2 (353.0 m2) 165 ft (50.29 m) 37.3 ft (11.37 m) 8.8 ft (2.68 m) 25° 22° 870 ft2 (80.83 m2) Geometric Data Wing area, S Wing span, b Root chord, cr Tip chord, ct chord line sweep, A chord line sweep, АсП Tail area, St

2.7 Consider an aircraft with its tail identical to its wing (i. e., the same span, area, chord, etc.). Neglect body and wing-body interaction effects [i. e., in general ( )wh = ( )J, neglect propulsion effects and assume zero elevator and tab deflections. As­

sume (2.2,7) in this instance is approximated by M, = ~l, L, + Macr

(a) What changes should be made in the expressions for a (2.3,18), C„a (2.3,21a), and Cm<> (2.3,22a)?

’ де

(b) What would — have to be numerically in order that the neutral point hn lies

da

midway between the mean aerodynamic centers of the wing and tail?

(c) For trimmed level flight, derive an expression for the ratio of the lift generated by the wing to the lift generated by the tail as a function of the tail angle i,. Assume

де,

e„ = 0, — = 0.2, a = 5 (rad’1), Cm = 0.2 and (h – hn) = -0.3. da "

2.8* The following data were taken from a flight test of a PA-32R-300 Cherokee-6 air­plane.

Altitude (ft) (km)

(mph)

(m/s)

Mass

(slugs)

(kg)

i,

(deg)

XCG

(in)

(cm)

4540

1.384

91.0

40.7

113.4

1656

1.5

93.89

238.5

4560

1.390

109

48.7

113.0

1650

0

93.89

238.5

4700

1.433

126

56.3

112.9

1649

-1.0

93.89

238.5

4580

1.396

155

69.3

112.7

1646

-2.0

93.89

238.5

5320

1.622

89.0

39.8

100.4

1466

4.5

86.82

220.5

4620

1.408

105

46.9

100.2

1463

2.0

86.82

220.5

4740

1.445

123

55.0

100.0

1461

0.3

86.82

220.5

4900

1.494

151

67.5

99.84

1458

-1.0

86.82

220.5

4880

1.487

87.0

38.9

88.51

1293

7.2

80.43

204.3

4820

1.469

103

46.0

88.35

1290

3.5

80.43

204.3

4880

1.487

122

54.5

88.20

1288

1.5

80.43

204.3

4740

1.445

152

68.0

88.04

1286

0

80.43

204.3

Problem courtesy of Professor E. K. Parks, University of Arizona.

The data were taken in trimmed level flight. xCG is the distance of the CG aft of the nose of the aircraft. The aircraft has an all-moving tail and thus i, is used instead of Se to trim the aircraft. The wing area is S = 174.5 ft2 (16.21 m2).

(a) Plot tail-setting angle, i„ versus the lift coefficient of the aircraft for each of the three CG locations.

(b) Curve fit the data points in (a) with three straight lines having a common inter­cept (refer to Fig. 2.18).

(c) Use a graphical technique to find the location of the neutral point (controls fixed) relative to the nose of the aircraft (refer to Fig. 2.21).

2.9 Starting with (2.6,11 b), derive (2.6,13).

2.10 The elevator control force to trim a particular airplane at a speed of 300 kts (154 m/s) is zero. Using the following data estimate the force required to change the trim speed to 310 kts (159 m/s). Assume that is sufficiently small that = 0 can be used in the expression for control force.

Geometric Data
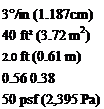
Подпись: 3°/in (1.187cm) 40 ft2 (3.72 m2) 2.0 ft (0.61 m) 0.56 0.38 50 psf (2,395 Pa) Elevator gearing, G Elevator area aft of hinge line, Se Mean elevator chord, ce VH

CG location, h Wing loading, w

Aerodynamic Data

Elevator hinge moment coefficient,

Э Ch

-jf – —0.005/deg

ae 0.025/deg

Neutral point, elevator free, h’n 0.45

Control Force Gradient

It was pointed out in Sec. 2.7 how the trim tabs can be used to reduce the control force to zero. A significant handling characteristic is the gradient of P with V at P = 0. The manner in which this changes as the CG is moved aft is illustrated in Fig. 2.28. The trim tab is assumed to be set so as to keep Vtrim the same. The gradient dP/dV is seen to decrease in magnitude as the CG moves backward. When it is at the control-free neutral point, A = 0 for aircraft with or without tails, and, under the stated conditions, the P/V graph becomes a straight line lying on the V axis. This is an important characteristic of the control-free NP; that is, when the CG is at that point, no force is required to change the trim speed.

A quantitative analysis of the control-force gradient follows.

Control Force Gradient

Figure 2.28 Effect of CG location on control-force gradient at fixed trim speed.

The force is given by (2.8,9). From it we obtain the derivative

dP

w-w

At the speed Vtrim, P = 0, and В = —A/|pV2trim, whence

Подпись: (2.9,1)Подпись:Э P _ 2A

av “ _

A is given following (2.8,9). Substituting the value into (2.9,1) we get

dP a’b2 w

— = 2GSece — — (ft – K) dV det Vlrim

From (2.9,2) we deduce the following:

1. The control-force gradient is proportional to Sece; that is, to the cube of air­plane size.

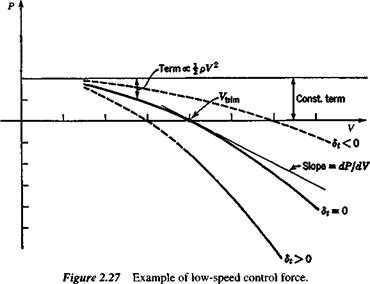
2. It is inversely proportional to the trim speed; i. e. it increases with decreasing speed. This effect is also evident in Fig. 2.27.

3. It is directly proportional to wing loading.

4. It is independent of height for a given true airspeed, but decreases with height for a fixed VE.

5. It is directly proportional to the control-free static margin.

Thus, in the absence of Mach number effects, the elevator control will be “heaviest” at sea-level, low-speed, forward CG, and maximum weight.

Control Force to Trim

The importance of control forces in relation to handling qualities has already been emphasized in previous sections, and the many options available to designers of pow­ered control systems has been noted. Cockpit devices can of course be designed to produce more or less any desired synthetic feel on the primary flight controls. It is nevertheless both instructive and necessary to be able to calculate the control forces that will be present in the case of natural feel, or when a simple power assist is pres­ent. A case in point is the elevator force required to trim the airplane, and how it varies with flight speed.

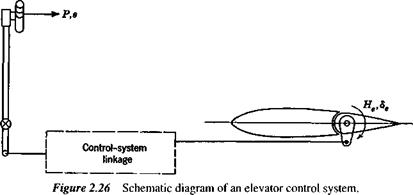
Figure 2.26 is a schematic representation of a reversible control system. The box denoted “control system linkage” represents any assemblage of levers, rods, pulleys,

Control Force to Trim

cables, and power-boost elements that comprise a general control system. We assume that the elements of the linkage and the structure to which it is attached are ideally rigid, so that no strain energy is stored in them, and we neglect friction. The system then has one degree of freedom. P is the force applied by the pilot, (positive to the rear) s is the displacement of the hand grip, and the work done by the power boost system is Wb. Considering a small quasistatic displacement from equilibrium (i. e., no kinetic energy appears in the control system), conservation of energy gives

Pds + dWb + HedSe = 0 (2.8,1)

dWh d8e

Now the nature of ratio or power boost controls is such that dWJds is proportional to P or He. Hence we can write

P = (Gl – G2)He (2.8,2)

d8e

where G, =————— >0, the elevator gearing ( rad/ft or rad/m)

ds

dWJds

and G2 = ——— , the boost gearing (ft orm )

He

(2.8,2) is now rewritten as

P = GHe (2.8,3)

where G = G, — G2. For fixed Gu i. e., for a given movement of the control surface to result from a given displacement of the pilot’s control, then the introduction of power boost is seen to reduce G and hence P. G may be designed to be constant over the whole range of 8e, or it may, by the use of special linkages and power systems, be made variable in almost any desired manner.

Introduction of the hinge-moment coefficient gives the expression for P as

P = GCheSecepV2 (2.8,4)

and the variation of P with flight speed depends on both V2 and on how Che varies with speed.

The value of Che at trim for arbitrary tab angle is given by

Che = Cheo + Che<alnm + h28ernrn + b3S, (2.8,5)

(2.8,5) in combination with (2.7,1) yields

= b3(8, – 8taJ (2.8,6)

i.

Control Force to Trim

e., the hinge moment is zero when 5, = 5,tnm as expected, and linearly proportional to the difference. From (2.7,2) then the hinge moment is

w

Ipv1

Подпись: C, Подпись: (2.8,8)

Lift equals the weight in horizontal flight, so that

where w = W/S is the wing loading. When (2.8,7 and 8) are substituted into (2.8,4) the result obtained is

P = A + BpV2 (2.8,9)

where

a’b2

A = – GSecew ~(h~ K) det

Подпись: В — GSx,,M, + Cheo + (CheCLSe – b2CLa)

Control Force to Trim

The typical parabolic variation of P with V when the aerodynamic coefficients are all constant, is shown in Fig. 2.27. The following conclusions may be drawn.

1. Other things remaining equal, P Sece, i. e., to the cube of the airplane size. This indicates a very rapid increase in control force with size.

2. P is directly proportional to the gearing G.

3. The CG position only affects the constant term (apart from a second-order in­fluence on Cms). A forward movement of the CG produces an upward transla­tion of the curve.

4. The weight of the airplane enters only through the wing loading, a quantity that tends to be constant for airplanes serving a given function, regardless of weight. An increase in wing loading has the same effect as a forward shift of the CG.

5. The part of P that varies with pV2 decreases with height, and increases as the speed squared.

6. Of the terms contained in B, none can be said in general to be negligible. All of them are “built-in” constants except for Sr

7. The effect of the trim tab is to change the coefficient of pV2, and hence the curvature of the parabola in Fig. 2.27. Thus it controls the intercept of the curve with the V axis. This intercept is denoted Vtrim; it is the speed for zero control force.