Category Fundamentals of Aerodynamics

Typical Orthogonal Coordinate Systems

To describe mathematically the flow of fluid through three-dimensional space, we have to prescribe a three-dimensional coordinate system. The geometry of some aerody­namic problems best fits a rectangular space, whereas others are mainly cylindrical in nature, and yet others may have spherical properties. Therefore, we have interest in the three most common orthogonal coordinate systems: cartesian, cylindrical, and spherical. These systems are described below. (An orthogonal coordinate system is one where all three coordinate directions are mutually perpendicular. It is interesting to note that some modem numerical solutions of fluid flows utilize nonorthogonal coordinate spaces; moreover, for some numerical problems the coordinate system is allowed to evolve and change during the course of the solution. These so-called adaptive grid techniques are beyond the scope of this book. See Reference 7 for details.)

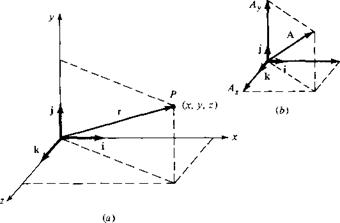
A cartesian coordinate system is shown in Figure 23a. The x, y, and z axes are mutually perpendicular, and i, j, and к are unit vectors in the x, y, and z direc­tions, respectively. An arbitrary point P in space is located by specifying the three coordinates (x, y, z). The point can also be located by the position vector r, where

г = XI + yj + zk

If A is a given vector in cartesian space, it can be expressed as

A = Axi + Ay j + Az к

where Ax, Ay, and Az are the scalar components of A along the x, y, and z directions, respectively, as shown in Figure 23b.

image88

Figure 2.3 Cartesian coordinates.

A cylindrical coordinate system is shown in Figure 2.4a. A “phantom” cartesian system is also shown with dashed lines to help visualize the figure. The location of point P in space is given by three coordinates (г, в, z), where r and в are measured in the xy plane shown in Figure 2.4a. The r coordinate direction is the direction of increasing r, holding в and z constant; er is the unit vector in the r direction. The в coordinate direction is the direction of increasing 0, holding r and z constant; eg is the unit vector in the 0 direction. The г coordinate direction is the direction of increasing z, holding r and 0 constant; e: is the unit vector in the z direction. If A is a given vector in cylindrical space, then

A = Arer + AgCt9 + Аге.

where Ar, Ag, and Az are the scalar components of A along the r, 0, and z directions, respectively, as shown in Figure 2Ab. The relationship, or transformation, between cartesian and cylindrical coordinates can be obtained from inspection of Figure 2.4a, namely,

x = r cos 0

у = r sin 0 [2.5]

г = z

or inversely,

r = y/x2 + y2

0 = arctan — [2.6]

JC

z = z

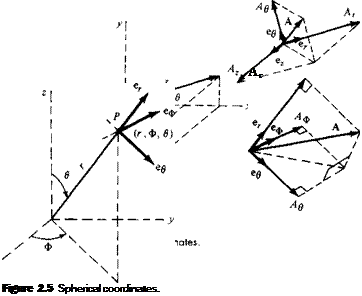
A spherical coordinate system is shown in Figure 2.5a. Once again, a phantom cartesian system is shown with dashed lines. (However, for clarity in the picture, the

image89

ia)

z axis is drawn vertically, in contrast to Figures 2.3 and 2.4.) The location of point P in space is given by the three coordinates (r, 0, Ф), where r is the distance of P from the origin, в is the angle measured from the z axis and is in the rz plane, and Ф is the angle measured from the x axis and is in the xy plane. The r coordinate direction is the direction of increasing r, holding в and Ф constant; e, is the unit vector in the r
direction. The в coordinate direction is the direction of increasing в, holding r and Ф constant; eg is the unit vector in the в direction. The Ф coordinate direction is the direction of increasing Ф, holding r and в constant; e<j> is the unit vector in the Ф direction. The unit vectors er, eg, and Єф are mutually perpendicular, if A is a given vector in spherical space, then

A = Are, + Agfig + АфЄф

where Ar, Ag, and Аф are the scalar components of A along the r,6, and Ф directions, respectively, as shown in Figure 2.5b. The transformation between cartesian and spherical coordinates is obtained from inspection of Figure 2.5a, namely,

x — r sin в cos Ф

у = r sin 9 sin Ф [2.7]

z = r cos в

or inversely,

r = /ї2 + y2 + z2

n z z r ,

0 = arccos – = arccos, [2.81

r 3/x2 + y2 + z2

X

Ф = arccos, :

2.2.2 Scalar and Vector Fields

A scalar quantity given as a function of coordinate space and time t is called a scalar field. For example, pressure, density, and temperature are scalar quantities, and

P – Pi(x, y, z, t) = p2(r, в, z, t) = p3(r, в, Ф, t) p = P(x, y, z, t) = p2(r, в, Z, t) = рз(r, в, Ф, t)

T = Ti(x, y, z, t) = T2(r, в, z, t) = Тз(г, в, Ф, t)

are scalar fields for pressure, density, and temperature, respectively. Similarly, a vector quantity given as a function of coordinate space and time is called a vector field. For example, velocity is a vector quantity, and

V = V, i + Vvj + V, k

where Vx = Vx(x, y, z, t)

V, = Vy(x, y,z, t)

Vz = Vz(x, y, z, t)

is the vector field for V in cartesian space. Analogous expressions can be written for vector fields in cylindrical and spherical space. In many theoretical aerodynamic problems, the above scalar and vector fields are the unknowns to be obtained in a solution for a flow with prescribed initial and boundary conditions.

2.2.3 Scalar and Vector Products

The scalar and vector products defined by Equations (2.3) and (2.4), respectively, can be written in terms of the components of each vector as follows.

Cartesian Coordinates Let

A = АдТ + Ay j + Azk

and

В — Bxi + By j + Bz к

Then

A

• В — AXBX Ay By AZBZ

[2.9]

and

,

j

к "

A x В =

A*

A,

A,

= і (AyBz — AzBy) +j(AzBx — AXBZ) + к (AxBy

– Ay Bx)

_ Bx

By

Bz

[2.10]

Cylindrical Coordinates Let

A = Arer + AgCg + Azez and В = Brtr + ВвЄд + B, ez

Then A • В = ArBr + AgBg + AZBZ [2.11]

er ee

ег

and

A x В =

Ar Ад

[2.12]

В, Вд

Bz

Spherical Coordinates Let

A = Arer

+ Адед + АфЄф

and

В = Brer

+ Bgtg + ВфЄф

Then

A • В = ArBr + AqBq

+ АфВф

[2.13]

Є, Єв

Сф

and

A x В =

Аг Ад

Аф

[2.14]

Вг Вд

Вф

2.2.4 Gradient of a Scalar Field

We now begin a review of some elements of vector calculus. Consider a scalar field
P = Pi(x, y, z) = рг(г, в, z) = рз(г, в, Ф)

The gradient of p, Vp, at a given point in space is defined as a vector such that:

0. Its magnitude is the maximum rate of change of p per unit length of the coordinate space at the given point.

1. Its direction is that of the maximum rate of change of p at the given point.

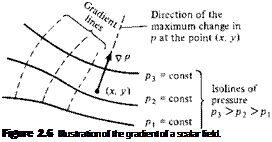
For example, consider a two-dimensional pressure field in cartesian space as sketched in Figure 2.6. The solid curves are lines of constant pressure; i. e., they connect points in the pressure field which have the same value of p. Such lines are called isolines. Consider an arbitrary point (jc, y) in Figure 2.6. If we move away from this point in an arbitrary direction, p will, in general, change because we are moving to another location in space. Moreover, there will be some direction from this point along which p changes the most over a unit length in that direction. This defines the direction of the gradient of p and is identified in Figure 2.6. The magnitude of Vp is the rate of change of p per unit length in that direction. Both the magnitude and direction of Vp will change from one point to another in the coordinate space. A line drawn in this space along which V/? is tangent at every point is defined as a gradient line, as sketched in Figure 2.6. The gradient line and isoline through any given point in the coordinate space are perpendicular.

Consider V/j at a given point (x, y) as shown in Figure 2.7. Choose some arbitrary direction s away from the point, as also shown in Figure 2.7. Let n be a unit vector in the s direction. The rate of change of p per unit length in the s direction is

image92"Подпись: Figure 2.6 Illustration of the gradient of a scalar field. [2.15]

у

image94

У

S

Figure 2.7 Sketch for the

directional derivative.

Pressure Coefficient

Подпись: P - Рос QOQ Подпись: [3.36]

Pressure, by itself, is a dimensional quantity (e. g., pounds per square foot, newtons per square meter). However, in Sections 1.7 and 1.8, we established the usefulness of certain dimensionless parameters such as M, Re, Cl – It makes sense, therefore, that a dimensionless pressure would also find use in aerodynamics. Such a quantity is the pressure coefficient Cp, first introduced in Section 1.5 and defined as

where qoo = pooVl-t

The definition given in Equation (3.36) is just that—a definition. It is used throughout aerodynamics, from incompressible to hypersonic flow. In the aerodynamic literature, it is very common to find pressures given in terms of Cp rather than the pressure itself. Indeed, the pressure coefficient is another similarity parameter that can be added to the list started in Sections 1.7 and 1.8.

For incompressible flow, Cp can be expressed in terms of velocity only. Consider the flow over an aerodynamic body immersed in a freestream with pressure Poo and velocity Toe. Pick an arbitrary point in the flow where the pressure and velocity are p and V, respectively. From Bernoulli’s equation,

Poo + ‘oPV^ = P + {pV2

or p – Poo = У (Vi – V2) [3.37]

Substituting Equation (3.37) into (3.36), we have

Подпись: or Подпись: [3.38]
image223

„ P – Poo p{V2oo – V2) p – „ ~ і „1/2

Equation (3.38) is a useful expression for the pressure coefficient; however, note that the form of Equation (3.38) holds for incompressible flow only.

Note from Equation (3.38) that the pressure coefficient at a stagnation point (where V = 0) in an incompressible flow is always equal to 1.0. This is the highest allowable value of Cp anywhere in the flow field. (For compressible flows, Cp at a stagnation point is greater than 1.0, as shown in Chapter 14.) Also, keep in mind that in regions of the flow where V > Vx or p < Poo, Cp will be a negative value.

Another interesting property of the pressure coefficient can be seen by rearranging the definition given by Equation (3.36), as follows:

P = Рос + ЧосСр


Clearly, the value of Cp tells us how much p differs from p^ in multiples of the dynamic pressure. That is, if Cp = 1 (the value at a stagnation point in an incom­pressible flow), then p = рос + q<oc, or the local pressure is “one times” the dynamic pressure above freestream static pressure. If Cp — —3, then p = p0Q — 3qoo, or the local pressure is three times the dynamic pressure below freestream static pressure.

Example 3. 7 I Consider an airfoil in a flow with a freestream velocity of 150 ft/s. The velocity at a given point
on the airfoil is 225 ft/s. Calculate the pressure coefficient at this point.

225 V[7] [8] [9] І50 /

Подпись: Cp = 1 — Подпись: -1.25
image224

Solution

speed of sound at standard sea level is 1117 ft/s; hence, the freestream Mach number is 300/1117 = 0.269. A flow where the local Mach number is less than 0.3 can be assumed to be essentially incompressible. Hence, the freestream Mach number satisfies this criterion. On the other hand, the flow rapidly expands over the top surface of the airfoil and accelerates to a velocity of 753 ft/s at the point of minimum pressure (the point of peak negative Cp). In the expansion, the speed of sound decreases. (We will find out why in Part 3.) Hence, at the point of minimum pressure, the local Mach number is greater than = 0.674. That is, the flow has expanded to such a high local Mach number that it is no longer incompressible. Therefore, the answer given in part (b) of Example 3.8 is not correct. (We will learn how to calculate the correct value in Part 3.) There is an interesting point to be made here. Just because a model is being tested in a low-speed, subsonic wind tunnel, it does not mean that the assumption of incompressible flow will hold for all aspects of the flow field. As we see here, in some regions of the flow field around a body, the flow can achieve such high local Mach numbers that it must be considered as compressible.

Historical Note: Kutta, Joukowski, and the Circulation Theory of Lift

Frederick W. Lanchester (1868-1946), an English engineer, automobile manufacturer, and self-styled aerodynamicist, was the first to connect the idea of circulation with lift. His thoughts were originally set forth in a presentation given before the Birmingham Natural History and Philosophical Society in 1894 and later contained in a paper

submitted to the Physical Society, which turned it down. Finally, in 1907 and 1908, he published two books, entitled Aerodynamics and Aerodonetics, where his thoughts on circulation and lift were described in detail. His books were later translated into German in 1909 and French in 1914. Unfortunately, Lanchester’s style of writing was difficult to read and understand; this is partly responsible for the general lack of interest shown by British scientists in Lanchester’s work. Consequently, little positive benefit was derived from Lanchester’s writings. (See Section 5.7 for a more detailed portrait of Lanchester and his work.)

Quite independently, and with total lack of knowledge of Lanchester’s thinking, M. Wilhelm Kutta (1867-1944) developed the idea that lift and circulation are related. Kutta was bom in Pitschen, Germany, in 1867 and obtained a Ph. D. in mathematics from the University of Munich in 1902. After serving as professor of mathematics at several German technical schools and universities, he finally settled at the Tech – nische Hochschule in Stuttgart in 1911 until his retirement in 1935. Kutta’s interest in aerodynamics was initiated by the successful glider flights of Otto Lilienthal in Berlin during the period 1890-1896 (see chapter 1 of Reference 2). Kutta attempted theoretically to calculate the lift on the curved wing surfaces used by Lilienthal. In the process, he surmised from experimental data that the flow left the trailing edge of a sharp-edged body smoothly and that this condition fixed the circulation around the body (the Kutta condition, described in Section 4.5). At the same time, he was con­vinced that circulation and lift were connected. Kutta was reluctant to publish these ideas, but after the strong insistence of his teacher, S. Finsterwalder, he wrote a paper entitled “Auftriebskrafte in Stromenden Flussigkecten” (Lift in Flowing Fluids). This was actually a short note abstracted from his longer graduation paper in 1902, but it represents the first time in history where the concepts of the Kutta condition as well as the connection of circulation with lift were officially published. Finsterwalder clearly repeated the ideas of his student in a lecture given on September 6, 1909, in which he stated:

On the upper surface the circulatory motion increases the translatory one, therefore

there is high velocity and consequently low pressure, while on the lower surface the

two movements are opposite, therefore there is low velocity with high pressure, with

the result of a thrust upward.

However, in his 1902 note, Kutta did not give the precise quantitative relation between circulation and lift. This was left to Nikolai Y. Joukowski (Zhukouski). Joukowski was bom in Orekhovo in central Russia on January 5, 1847. The son of an engineer, he became an excellent student of mathematics and physics, grad­uating with a Ph. D. in applied mathematics from Moscow University in 1882. He subsequently held a joint appointment as a professor of mechanics at Moscow Uni­versity and the Moscow Higher Technical School. It was at this latter institution that Joukowski built in 1902 the first wind tunnel in Russia. Joukowski was deeply interested in aeronautics, and he combined a rare gift for both experimental and theoretical work in the field. He expanded his wind tunnel into a major aerodynam­ics laboratory in Moscow. Indeed, during World War I, his laboratory was used as a school to train military pilots in the principles of aerodynamics and flight. When he died in 1921, Joukowski was by far the most noted aerodynamicist in Russia.

Much of Joukowski’s fame was derived from a paper published in 1906, wherein he gives, for the first time in history, the relation L’ = Vx Г—the Kutta-Joukowski

theorem. In Joukowski’s own words:

If an irrotational two-dimensional fluid current, having at infinity the velocity Vx surrounds any closed contour on which the circulation of velocity is Г, the force of the aerodynamic pressure acts on this contour in a direction perpendicular to the velocity and has the value

L’^p^V^Y

The direction of this force is found by causing to rotate through a right angle the vector Voc around its origin in an inverse direction to that of the circulation.

Joukowski was unaware of Kutta’s 1902 note and developed his ideas on circu­lation and lift independently. However, in recognition of Kutta’s contribution, the equation given above has propagated through the twentieth century as the “Kutta – Joukowski theorem.”

Hence, by 1906—just 3 years after the first successful flight of the Wright brothers—the circulation theory of lift was in place, ready to aid aerodynamics in the design and understanding of lifting surfaces. In particular, this principle formed the cornerstone of the thin airfoil theory described in Sections 4.7 and 4.8. Thin airfoil theory was developed by Max Munk, a colleague of Prandtl in Germany, during the first few years after World War I. However, the very existence of thin airfoil theory, as well as its amazingly good results, rests upon the foundation laid by Lanchester, Kutta, and Joukowski a decade earlier.

4.15 Summary

Return to the road map given in Figure 4.2. Make certain that you feel comfortable with the material represented by each box on the road map and that you understand the flow of ideas from one box to another. If you are uncertain about one or more aspects, review the pertinent sections before progressing further.

Some important results from this chapter are itemized below:

A vortex sheet can be used to synthesize the inviscid, incompressible flow over an airfoil. If the distance along the sheet is given by. v and the strength of the sheet per unit length is y(s), then the velocity potential induced at point (x, y) by a vortex sheet that extends from point a to point h is

ф(х, y) = j 9y(s) ds

[4.3]

The circulation associated with this vortex sheet is

r=f y(s)ds

[4.4]

Across the vortex sheet, there is a tangential velocity discontinuity, where

у = u, ~ ІІ2

[4.8]

The Kutta condition is an observation that for a lifting airfoil of given shape at a given angle of attack, nature adopts that particular value of circulation around the airfoil which results in the flow leaving smoothly at the trailing edge. If the trailing-edge angle is finite, then the trailing edge is a stagnation point. If the trailing edge is cusped, then the velocities leaving the top and bottom surfaces at the trailing edge are finite and equal in magnitude and direction. In either case,

у (ТЕ) = 0 [4.10]


Thin airfoil theory is predicated on the replacement of the airfoil by the mean camber line. A vortex sheet is placed along the chord line, and its strength adjusted such that, in conjunction with the uniform freestream, the camber line becomes a streamline of the flow while at the same time satisfying the Kutta condition. The strength of such a vortex sheet is obtained from the fundamental equation of thin airfoil theory:


1 fc Y(S)dS „ / dz

2л J0 x – f °° v dx


[4.18]


Results of thin airfoil theory:

Symmetric airfoil

1.

Сі = 2л a.

2.

Lift slope = dci/da = 2л.

3.

The center of pressure and the aerodynamic center are both at the quarter-chord point.

4.

Cm, с/4 — C/n, ac —

Cambered airfoil

1.

сі = 2л

1 г dz

a—– —— (cos вд – l)d90

[4.57]

_ л Jo dx _

2.

Lift slope = dci/da = 2л.

3.

The aerodynamic center is at the quarter-chord point.

4.

The center of pressure varies with the lift coefficient.


The vortex panel method is an important numerical technique for the solution of the inviscid, incompressible flow over bodies of arbitrary shape, thickness, and angle of attack. For panels of constant strength, the governing equations are


(i = 1, 2, …, n)


Lee cos Pi


and


Yi = ~Yi-1


which is one way of expressing the Kutta condition for the panels immediately above and below the trailing edge.


image395

Problems

Подпись: І.Подпись: 2. 3. 4. 5. 6. Consider the data for the NACA 2412 airfoil given in Figure 4.5. Calculate the lift and moment about the quarter chord (per unit span) for this airfoil when the angle of attack is 4° and the freestream is at standard sea level conditions with a velocity of 50 ft/s. The chord of the airfoil is 2 ft.

Consider an NACA 2412 airfoil with a 2-m chord in an airstream with a velocity of 50 m/s at standard sea level conditions. If the lift per unit span is 1353 N, what is the angle of attack?

Starting with the definition of circulation, derive Kelvin’s circulation theorem, Equation (4.11).

Starting with Equation (4.35), derive Equation (4.36).

Consider a thin, symmetric airfoil at 1.5° angle of attack. From the results of thin airfoil theory, calculate the lift coefficient and the moment coefficient about the leading edge.

Подпись: c image396,image397 Historical Note: Kutta, Joukowski, and the Circulation Theory of Lift
image398

The NACA 4412 airfoil has a mean camber line given by

Using thin airfoil theory, calculate (a) aL=o (b) ci when a = 3°

Подпись: 7. 8. 9. 10. For the airfoil given in Problem 4.6, calculate стхц and лср/г when a = 3°.

Compare the results of Problems 4.6 and 4.7 with experimental data for the NACA 4412 airfoil, and note the percentage difference between theory and experiment. (Hint: A good source of experimental airfoil data is Reference 11.)

Starting with Equations (4.35) and (4.43), derive Equation (4.62).

For the NACA 2412 airfoil, the lift coefficient and moment coefficient about the quarter-chord at —6° angle of attack are —0.39 and —0.045, respectively. At 4° angle of attack, these coefficients are 0.65 and —0.037, respectively. Calculate the location of the aerodynamic center.

Fundamentals of Aerodynamics

John D. Anderson, Jr., was born in Lancaster, Pennsylvania, on October 1, 1937. He attended the University of Florida, graduating in 1959 with high honors and a bachelor of aeronautical engineering degree. From 1959 to 1962, he was a lieutenant and task scientist at the Aerospace Research Laboratory at Wright-Patterson Air Force Base. From 1962 to 1966, he attended the Ohio State University under the National Science Foundation and NASA Fellowships, graduating with a Ph. D. in aeronautical and as – tronautical engineering. In 1966, he joined the U. S. Naval Ordnance Laboratory as Chief of the Hypersonics Group. In 1973, he became Chairman of the Department of Aerospace Engineering at the University of Maryland, and since 1980 has been professor of Aerospace Engineering at the University of Maryland. In 1982, he was designated a Distinguished Scholar/Teacher by the University. During 1986-1987, while on sabbatical from the University, Dr. Anderson occupied the Charles Lind­bergh Chair at the National Air and Space Museum of the Smithsonian Institution. He continued with the Air and Space Museum one day each week as their Special Assis­tant for Aerodynamics, doing research and writing on the history of aerodynamics. In addition to his position as professor of aerospace engineering, in 1993, he was made a full faculty member of the Committee for the History and Philosophy of Science and in 1996 an affiliate member of the History Department at the University of Maryland. In 1996, he became the Glenn L. Martin Distinguished Professor for Education in Aerospace Engineering. In 1999, he retired from the University of Maryland and was appointed Professor Emeritus. He is currently the Curator for Aerodynamics at the National Air and Space Museum, Smithsonian Institution.

Dr. Anderson has published eight books: Gasdynamic Lasers: An Introduc­tion, Academic Press (1976), and under McGraw-Hill, Introduction to Flight (1978, 1984, 1989, 2000), Modern Compressible Flow (1982, 1990), Fundamentals of Aero­dynamics (1984, 1991), Hypersonic and High Temperature Gas Dynamics (1989), Computational Fluid Dynamics: The Basics with Applications (1995), Aircraft Per­formance and Design (1999), and A History of Aerodynamics and Its Impact on Flying Machines, Cambridge University Press (1997 hardback, 1998 paperback). He is the author of over 120 papers on radiative gasdynamics, reentry aerothermodynamics, gasdynamic and chemical lasers, computational fluid dynamics, applied aerodynam­ics, hypersonic flow, and the history of aeronautics. Dr. Anderson is in Who’s Who in America. He is a Fellow of the American Institute of Aeronautics and Astronautics (AIAA). He is also a fellow of the Royal Aeronautical Society, London. He is a member of Tau Beta Pi, Sigma Tau, Phi Kappa Phi, Phi Eta Sigma, The American Society for Engineering Education, the History of Science Society, and the Society for the History of Technology. In 1988, he was elected as Vice President of the AIAA for Education. In 1989, he was awarded the John Leland Atwood Award jointly by the American Society for Engineering Education and the American Institute of

Aeronautics and Astronautics “for the lasting influence of his recent contributions to aerospace engineering education.” In 1995, he was awarded the AIAA Pendray Aerospace Literature Award “for writing undergraduate and graduate textbooks in aerospace engineering which have received worldwide acclaim for their readability and clarity of presentation, including historical content.” In 1996, he was elected Vice President of the AIAA for Publications. He has recently been honored by the AIAA with its 2000 von Karman Lectureship in Astronautics.

From 1987 to the present, Dr. Anderson has been the senior consulting editor on the McGraw-Hill Series in Aeronautical and Astronautical Engineering.

Dedicated to My Family
Sarah-Alien, Katherine, and Elizabeth


An Application of the Momentum Equation: Drag of a Two-Dimensional Body

We briefly interrupt our orderly development of the fundamental equations of fluid dynamics in order to examine an important application of the integral form of the momentum equation. During the 1930s and 1940s, the National Advisory Commit­tee for Aeronautics (NACA) measured the lift and drag characteristics of a series of systematically designed airfoil shapes (discussed in detail in Chapter 4). These

measurements were carried out in a specially designed wind tunnel where the wing models spanned the entire test section; i. e., the wing tips were butted against both sidewalls of the wind tunnel. This was done in order to establish two-dimensional (rather than three-dimensional) flow over the wing, thus allowing the properties of an airfoil (rather than a finite wing) to be measured. The distinction between the aerodynamics of airfoils and that of finite wings is made in Chapters 4 and 5. The important point here is that because the wings were mounted against both sidewalls of the wind tunnel, the NACA did not use a conventional force balance to measure the lift and drag. Rather, the lift was obtained from the pressure distributions on the ceiling and floor of the tunnel (above and below the wing), and the drag was obtained from measurements of the flow velocity downstream of the wing. These measurements may appear to be a strange way to measure the aerodynamic force on a wing. Indeed, how are these measurements related to lift and drag? What is going on here? The answers to these questions are addressed in this section; they involve an application of the fundamental momentum equation in integral form, and they illustrate a basic technique that is frequently used in aerodynamics.

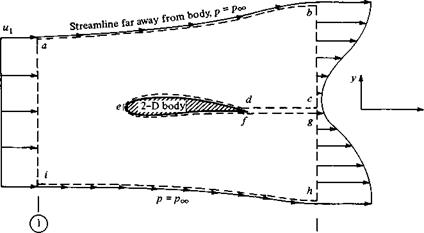
Consider a two-dimensional body in a flow, as sketched in Figure 2.18a. A control volume is drawn around this body, as given by the dashed lines in Figure 2.18a. The control volume is bounded by:

1. The upper and lower streamlines far above and below the body (ab and hi, respectively).

2. Lines perpendicular to the flow velocity far ahead of and behind the body (aі and bh, respectively).

3. A cut that surrounds and wraps the surface of the body (cdefg).

The entire control volume is abcdefghia. The width of the control volume in the z direction (perpendicular to the page) is unity. Stations 1 and 2 are inflow and outflow stations, respectively.

Assume that the contour abhi is far enough from the body such that the pressure is everywhere the same on abhi and equal to the freestream pressure p — px. Also, assume that the inflow velocity и is uniform across ai (as it would be in a freestream, or a test section of a wind tunnel). The outflow velocity u2 is not uniform across bh, because the presence of the body has created a wake at the outflow station. However, assume that both ni and n 2 are in the a direction; hence, ni = constantandn2 = /(y).

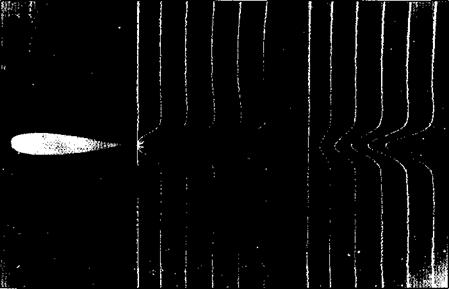
An actual photograph of the velocity profiles in a wake downstream of an airfoil is shown in Figure 2.18b.

Consider the surface forces on the control volume shown in Figure 2.18a. They stem from two contributions:

1. The pressure distribution over the surface abhi,

image125

abhi

2. The surface force on def created by the presence of the body

Подпись: Uniform velocity

x


©


(a)


image127

(b)

Figure 8.18 (o) Control volume for obtaining drag on a two-dimensional body.

(b) Photograph of the velocity profiles downstream of an airfoil. The profiles are made visible in water flow by pulsing a voltage through a straight wire perpendicular to the flow, thus creating small bubbles of hydrogen that subsequently move downstream with the flow. (Courtesy of Yasuki Nakayama, Tokai University, Japan.)


image126

Подпись: Surface force = Подпись: [2.73]

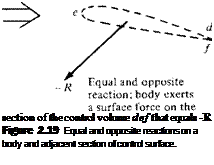
In the list on page 117, the surface shear stress on ab and hi has been neglected. Also, note that in Figure 2.18a the cuts cd and fg are taken adjacent to each other; hence, any shear stress or pressure distribution on one is equal and opposite to that on the other; i. e., the surface forces on cd and fg cancel each other. Also, note that the surface force on def is the equal and opposite reaction to the shear stress and pressure distribution created by the flow over the surface of the body. To see this more clearly, examine Figure 2.19. On the left is shown the flow over the body. As explained in Section 1.5, the moving fluid exerts pressure and shear stress distributions over the body surface which create a resultant aerodynamic force per unit span R’ on the body. In turn, by Newton’s third law, the body exerts equal and opposite pressure and shear stress distributions on the flow, i. e., on the part of the control surface bounded by def. Hence, the body exerts a force —R’ on the control surface, as shown on the right of Figure 2.19. With the above in mind, the total surface force on the entire control volume is

Moreover, this is the total force on the control volume shown in Figure 2.18a because the volumetric body force is negligible.

Consider the integral form of the momentum equation as given by Equation

(2.64)

image128 Подпись: pdV + Подпись: //„“S-R' abhi Подпись: [2.74]

. The right-hand side of this equation is physically the force on the fluid moving through the control volume. For the control volume in Figure 2.18a, this force is simply the expression given by Equation (2.73). Hence, using Equation (2.64), with the right-hand side given by Equation (2.73), we have

image129

Подпись: section of the control volume def that equals -R Figure 2.19 Equal and opposite reactions on a body and adjacent section of control surface. Flow exerts p and r on the surface of the body, giving a resultant aerodynamic force R

image131 Подпись: //'dS abhi Подпись: [2.75]

Assuming steady flow, Equation (2.74) becomes

image132 Подпись: [2.76]

Equation (2.75) is a vector equation. Consider again the control volume in Fig­ure 2.18a. Take the x component of Equation (2.75), noting that the inflow and outflow velocities u and «2 are in the x direction and the x component of R’ is the aerodynamic drag per unit span D

In Equation (2.76), the last term is the component of the pressure force in the x direction. [The expression (p dS)x is the x component of the pressure force exerted on the elemental area dS of the control surface.] Recall that the boundaries of the control volume abhi are chosen far enough from the body such that p is constant along these boundaries. For a constant pressure.

Подпись:JJ(pdS)x= 0

abhi

because, looking along the x direction in Figure 2.18a, the pressure force on abhi pushing toward the right exactly balances the pressure force pushing toward the left. This is true no matter what the shape of abhi is, as long as p is constant along the surface (for proof of this statement, see Problem 2.3). Therefore, substituting Equation (2.77) into (2.76), we obtain

[2.78]

s

Evaluating the surface integral in Equation (2.78), we note from Figure 2.18a that:

1. The sections ab, hi, and def are streamlines of the flow. Since by definition V is parallel to the streamlines and dS is perpendicular to the control surface, along these sections V and dS are perpendicular vectors, and hence V • dS = 0. Asa result, the contributions of ab, hi, and def to the integral in Equation (2.78) are zero.

2. The cuts cd and fg are adjacent to each other. The mass flux out of one is identically the mass flux into the other. Hence, the contributions of cd and fg to the integral in Equation (2.78) cancel each other.

As a result, the only contributions to the integral in Equation (2.78) come from sections ai and bh. These sections are oriented in the у direction. Also, the control volume has unit depth in the z direction (perpendicular to the page). Hence, for these sections,
dS — dy( 1). The integral in Equation (2.78) becomes

Подпись: [2.79]^ (pV • dS)n = – pjii] dy + p2udy

Note that the minus sign in front of the first term on the right-hand side of Equation (2.79) is due to V and dS being in opposite directions along ai (station 1 is an inflow boundary); in contrast, V and dS are in the same direction over hb (station 2 is an outflow boundary), and hence the second term has a positive sign.

terms of the known freestream velocity и and the flow-field properties p2 and u2, across a vertical station downstream of the body. These downstream properties can be measured in a wind tunnel, and the drag per unit span of the body D’ can be obtained by evaluating the integral in Equation (2.83) numerically, using the measured data for p2 and «2 as a function of y.

Examine Equation (2.83) more closely. The quantity u — u2 is the velocity decrement at a given у location. That is, because of the drag on the body, there is a wake that trails downstream of the body. In this wake, there is a loss in flow velocity и і — и 2. The quantity p2u2 is simply the mass flux; when multiplied by u — u2,

it gives the decrement in momentum. Therefore, the integral in Equation (2.83) is physically the decrement in momentum flow that exists across the wake, and from Equation (2.83), this wake momentum decrement is equal to the drag on the body.

For incompressible flow, p = constant and is known. For this case, Equation (2.83) becomes

/ Ґ

D’ = p І иг(и — u2)dy [2.84]

Jh

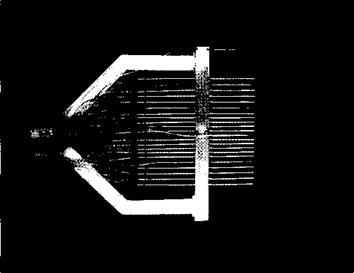
Equation (2.84) is the answer to the questions posed at the beginning of this section. It shows how a measurement of the velocity distribution across the wake of a body can yield the drag. These velocity distributions are conventionally measured with a Pitot rake, such as shown in Figure 2.20. This is nothing more than a series of Pitot tubes attached to a common stem, which allows the simultaneous measurement of velocity across the wake. (The principle of the Pitot tube as a velocity-measuring instrument is discussed in Chapter 3. See also pages 147-161 of Reference 2 for an introductory discussion on Pitot tubes.)

The result embodied in Equation (2.84) illustrates the power of the integral form of the momentum equation; it relates drag on a body located at some position in the flow to the flow-field variables at a completely different location.

At the beginning of this section, it was mentioned that lift on a two-dimensional body can be obtained by measuring the pressures on the ceiling and floor of a wind

image133

Figure 2.20 A Pitot rake for wake surveys. (Courtesy of the

University of Maryland Aerodynamic Laboratory.)

tunnel, above and below the body. This relation can be established from the integral form of the momentum equation in a manner analogous to that used to establish the drag relation; the derivation is left as a homework problem.

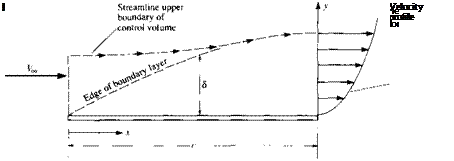
Consider an incompressible flow, laminar boundary layer growing along the surface of a flat plate, with chord length c, as sketched in Figure 2.21. The definition of a boundary layer was discussed in Section 1.10 and illustrated in Figure 1.35. The significance of a laminar flow is discussed in Chapter 15; it is not relevant for this example. For an incompressible, laminar, flat plate boundary layer, the boundary-layer thickness 6 at the trailing edge of the plate is

S _ 5

C 4/Rc,

and the skin friction drag coefficient for the plate is

D’ 1.328

Cf = ———- = -=

<7ooC(l) VRe7

where the Reynolds number is based on chord length

Подпись:Подпись: Example 2.2Рос Foe ( Poe

image134

[Note: Both S/c and C/ are functions of the Reynolds number—just another demonstration of the power of the similarity parameters. Since we are dealing with a low-speed, incompressible flow, the Mach number is not a relevant parameter here.] Let us assume that the velocity profile through the boundary layer is given by a power-law variation

image135

Calculate the value of n, consistent with the information given above.

Solution

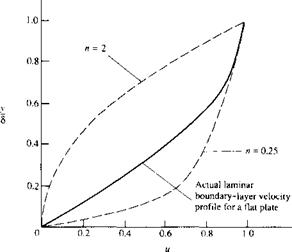
By assuming a power-law velocity profile in the form of и/V^, = (y/S)n, we have found two different velocity profiles that satisfy the momentum principle applied to a finite control volume. Both of these profiles are shown in Figure 2.22 and are compared with an exact velocity profile obtained by means of a solution of the incompressible, laminar boundary-layer equations for a flat plate. (This boundary-layer solution is discussed in Chapter 18.) Note that the result n = 2 gives a concave velocity profile which is essentially nonphysical when compared to the convex profiles always observed in boundary layers. The result n = 0.25 gives a convex velocity profile which is qualitatively physically correct. However, this profile is quantitatively inaccurate, as can be seen in comparison to the exact profile. Hence, our original assumption of a power-law velocity profile for the laminar boundary layer in the form of и/= (y/S)n is not very good, in spite of the fact that when n = 2 or 0.25, this assumed velocity profile does satisfy the momentum principle, applied over a large, finite control volume.

image136

L=o

Figure 2.22 Comparison of the actual laminar boundary-layer profile with those calculated from Example 2.2.

Lifting Flow Over a Cylinder

In Section 3.13, we superimposed a uniform flow and a doublet to synthesize the flow over a circular cylinder, as shown in Figure 3.26. In addition, we proved that both the lift and drag were zero for such a flow. However, the streamline pattern shown at the right of Figure 3.26 is not the only flow that is theoretically possible around a circular cylinder. It is the only flow that is consistent with zero lift. However, there are other possible flow patterns around a circular cylinder—different flow patterns

which result in a nonzero lift on the cylinder. Such lifting flows are discussed in this section.

Now you might be hesitant at this moment, perplexed by the question as to how a lift could possibly be exerted on a circular cylinder. Is not the body perfectly symmetric, and would not this geometry always result in a symmetric flow field with a consequent zero lift, as we have already discussed? You might be so perplexed that you run down to the laboratory, place a stationary cylinder in a low-speed tunnel, and measure the lift. To your satisfaction, you measure no lift, and you walk away muttering that the subject of this section is ridiculous—there is no lift on the cylinder. However, go back to the wind tunnel, and this time run a test with the cylinder spinning about its axis at relatively high revolutions per minute. This time you measure a finite lift. Also, by this time you might be thinking of other situations: spin on a baseball causes it to curve, and spin on a golfball causes it to hook or slice. Clearly, in real life there are nonsymmetric aerodynamic forces acting on these symmetric, spinning bodies. So, maybe the subject matter of this section is not so ridiculous after all. Indeed, as you will soon appreciate, the concept of lifting flow over a cylinder will start us on a journey which leads directly to the theory of the lift generated by airfoils, as discussed in Chapter 4.

Consider the flow synthesized by the addition of the nonlifting flow over a cylinder and a vortex of strength Г, as shown in Figure 3.32. The stream function for nonlifting flow over a circular cylinder of radius R is given by Equation (3.92):

image259[3.92]

The stream function for a vortex of strength Г is given by Equation (3.114). Recall that the stream function is determined within an arbitrary constant; hence, Equation

(3.114) can be written as

Подпись: [3.115]Г

xj/2 = – In r + const

Nonlifting flow over a cylinder


Lifting flow over a cylinder


strength Г


Figure 3.32 The synthesis of lifting flow over a circular cylinder.


image260

Since the value of the constant is arbitrary, let

Г

Const =——– Inf? [3.116]

Combining Equations (3.115) and (3.116), we obtain

іД2 = ^-1п^ [3.117]

І7Ї К

Equation (3.117) is the stream function for a vortex of strength Г and is just as valid as Equation (3.114) obtained earlier; the only difference between these two equations is a constant of the value given by Equation (3.116).

The resulting stream function for the flow shown at the right of Figure 3.32 is

Подпись: or Подпись: f = (Ужг sin6>) Подпись: [3.118]
image261 image262

jr = fx+f2

From Equation (3.118), if r = R, then jr = 0 for all values of в. Since i/f = constant is the equation of a streamline, r = R is therefore a streamline of the flow, but r = R is the equation of a circle of radius R. Hence, Equation (3.118) is a valid stream function for the inviscid, incompressible flow over a circular cylinder of radius R, as shown at the right of Figure 3.32. Indeed, our previous result given by Equation (3.92) is simply a special case of Equation (3.118) with Г = 0.

The resulting streamline pattern given by Equation (3.118) is sketched at the right of Figure 3.32. Note that the streamlines are no longer symmetrical about the hori­zontal axis through point O, and you might suspect (correctly) that the cylinder will experience a resulting finite normal force. However, the streamlines are symmetrical about the vertical axis through O, and as a result the drag will be zero, as we prove shortly. Note also that because a vortex of strength Г has been added to the flow, the circulation about the cylinder is now finite and equal to Г.

Lifting Flow Over a Cylinder Подпись: R2 T2 J Voo cos в R2 I Voo sin + ~T Г2 Подпись: г 2л r Подпись: [3.119] [3.120]

The velocity field can be obtained by differentiating Equation (3.118). An equally direct method of obtaining the velocities is to add the velocity field of a vortex to the velocity field of the nonlifting cylinder. (Recall that because of the linearity of the flow, the velocity components of the superimposed elementary flows add directly.) Hence, from Equations (3.93) and (3.94) for nonlifting flow over a cylinder of radius R, and Equations (3.111a and b) for vortex flow, we have, for the lifting flow over a cylinder of radius R,

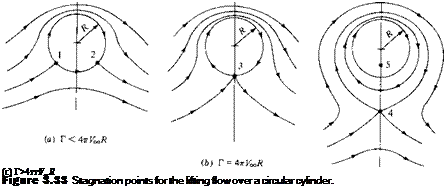
To locate the stagnation points in the flow, set Vr = Vq = 0 in Equations (3.119) and (3.120) and solve for the resulting coordinates (г, в):

Подпись: VQO COS в — 0image263

image264 Подпись: [3.122]

[3.121]

image265

From Equation (3.121), r = R. Substituting this result into Equation (3.122) and solving for в, we obtain

Since Г is a positive number, from Equation (3.123) в must be in the third and fourth quadrants. That is, there can be two stagnation points on the bottom half of the circular cylinder, as shown by points 1 and 2 in Figure 3.33a. These points are located at (R, в), where в is given by Equation (3.123). However, this result is valid only when Г/4л V^R < 1. If Г/4л R > 1, then Equation (3.123) has no

meaning. If Г/4л V^R = 1, there is only one stagnation point on the surface of the cylinder, namely, point (R, —л/2) labeled as point 3 in Figure 3.33b. For the case of Г/4л V^R > 1, return to Equation (3.121). We saw earlier that it is satisfied by r = R; however, it is also satisfied by 9 = л/2 or —л/2. Substituting в = —л/2 into Equation (3.122), and solving for r, we have

image266[3.124]

Подпись: (с) Г>4TTV„R Figure 3.33 Stagnation points for the lifting flow over a circular cylinder.
Hence, for Г|4лУ00R > 1, there are two stagnation points, one inside and the other outside the cylinder, and both on the vertical axis, as shown by points 4 and 5 in Figure 3.33c. [How does one stagnation point fall inside the cylinder? Recall that r = R, or t/r = 0, is just one of the allowed streamlines of the flow. There is a theoretical flow

inside the cylinder—flow that is issuing from the doublet at the origin superimposed with the vortex flow for r < R. The circular streamline r = R is the dividing streamline between this flow and the flow from the freestream. Therefore, as before, we can replace the dividing streamline by a solid body—our circular cylinder—and the external flow will not know the difference. Hence, although one stagnation point falls inside the body (point 5), we are not realistically concerned about it. Instead, from the point of view of flow over a solid cylinder of radius R, point 4 is the only meaningful stagnation point for the case Г/Ап V^R > 1.]

The results shown in Figure 3.33 can be visualized as follows. Consider the inviscid incompressible flow of given freestream velocity VTO over a cylinder of given radius R. If there is no circulation (i. e., if Г = 0), the flow is given by the sketch at the right of Figure 3.26, with horizontally opposed stagnation points A and B. Now assume that a circulation is imposed on the flow, such that Г < An V^R. The flow sketched in Figure 3.33a will result; the two stagnation points will move to the lower surface of the cylinder as shown by points 1 and 2. Assume that Г is further increased until Г = AnV^R. The flow sketched in Figure 3.33b will result, with only one stagnation point at the bottom of the cylinder, as shown by point 3. When Г is increased still further such that Г > AnV^R, the flow sketched in Figure 3.33c will result. The stagnation point will lift from the cylinder’s surface and will appear in the flow directly below the cylinder, as shown by point 4.

From the above discussion, Г is clearly a parameter that can be chosen freely. There is no single value of Г that “solves” the flow over a circular cylinder; rather, the circulation can be any value. Therefore, for the incompressible flow over a circular cylinder, there are an infinite number of possible potential flow solutions, corresponding to the infinite choices for values of Г. This statement is not limited to flow over circular cylinders, but rather, it is a general statement that holds for the incompressible potential flow over all smooth two-dimensional bodies. We return to these ideas in subsequent sections.

From the symmetry, or lack of it, in the flows sketched in Figures 3.32 and 3.33, we intuitively concluded earlier that a finite normal force (lift) must exist on the body but that the drag is zero; that is, d’Alembert’s paradox still prevails. Let us quantify these statements by calculating expressions for lift and drag, as follows.

Подпись: V = V0 Подпись: —2 VQO sin 0 Подпись: Г 2nR Подпись: [3.125]

The velocity on the surface of the cylinder is given by Equation (3.120) with r — R:

Подпись: or Подпись: Cp= 1- Cp = 1 - image268 Подпись: [3.126]

In turn, the pressure coefficient is obtained by substituting Equation (3.125) into Equation (3.38):

In Section 1.5, we discussed in detail how the aerodynamic force coefficients can be obtained by integrating the pressure coefficient and skin friction coefficient over the surface. For inviscid flow, Cf =0. Hence, the drag coefficient c, i is given by Equation (1.16) as

1 fTE

Cd — — — / {Cp, u Cp i) dy

c J LE

1 fTE 1 fTE

or cd = – CptUdy————– Cpjdy [3.127]

c J LE C J LE

Converting Equation (3.127) to polar coordinates, we note that

у = R sin 9 dy = R cos 9 d9 [3.128]

Substituting Equation (3.128) into (3.127), and noting that c = 2R, we have

1 1 Г2л

cd — — I Cp. u cos 9 d6 — – / Cpj cos Odd [3.129]

2 Jjz 2 Jji

The limits of integration in Equation (3.129) are explained as follows. In the first integral, we are integrating from the leading edge (the front point of the cylinder), moving over the top surface of the cylinder. Hence, в is equal to л at the leading edge and, moving over the top surface, decreases to 0 at the trailing edge. In the second integral, we are integrating from the leading edge to the trailing edge while moving over the bottom surface of the cylinder. Hence, в is equal to л at the leading edge and, moving over the bottom surface, increases to 2л at the trailing edge. In Equation (3.129), both Cp u and Cpd are given by the same analytic expression for Cp, namely, Equation (3.126). Hence,

we have

Equation (3.140) gives the lift per unit span for a circular cylinder with circulation Г. It is a remarkably simple result, and it states that the lift per unit span is directly proportional to circulation. Equation (3.140) is a powerful relation in theoretical

aerodynamics. It is called the Kutta-Joukowski theorem, named after the German mathematician M. Wilheim Kutta (1867-1944) and the Russian physicist Nikolai E. Joukowski (1847-1921), who independently obtained it during the first decade of this century. We will have more to say about the Kutta-Joukowski theorem in Section 3.16.

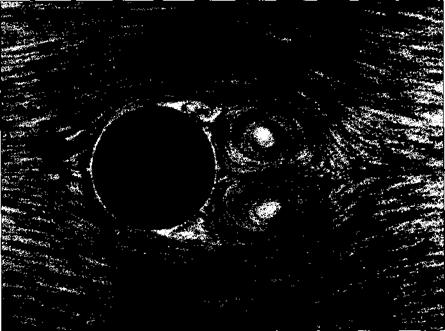
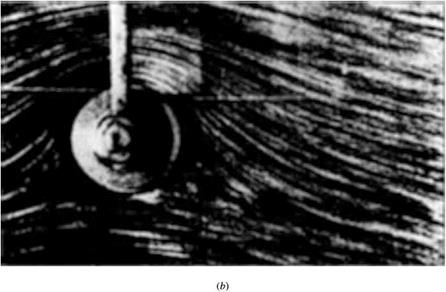
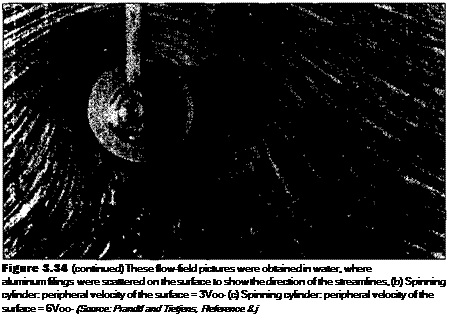
What are the connections between the above theoretical results and real life? As stated earlier, the prediction of zero drag is totally erroneous—viscous effects cause skin friction and flow separation which always produce a finite drag, as will be dis­cussed in Chapters 15 to 20. The inviscid flow treated in this chapter simply does not model the proper physics for drag calculations. On the other hand, the predic­tion of lift via Equation (3.140) is quite realistic. Let us return to the wind-tunnel experiments mentioned at the beginning of this chapter. If a stationary, nonspinning cylinder is placed in a low-speed wind tunnel, the flow field will appear as shown in Figure 3.34a. The streamlines over the front of the cylinder are similar to theoretical predictions, as sketched at the right of Figure 3.26. However, because of viscous effects, the flow separates over the rear of the cylinder, creating a recirculating flow in the wake downstream of the body. This separated flow greatly contributes to the finite drag measured for the cylinder. On the other hand, Figure 3.34a shows a reasonably

image269

(«)

Figure 3.34 These flow-field pictures were obtained in water, where aluminum filings were scattered on the surface to show the direction of the streamlines.

(a) Shown above is the case for the nonspinning cylinder. (Source: Prandtl and Tietjens, Reference 8.)

(c)

image270
Подпись: Figure 3.34 (continued) These flow-field pictures were obtained in water, where aluminum filings were scattered on the surface to show the direction of the streamlines, (b) Spinning cylinder: peripheral velocity of the surface = 3Voo- (c) Spinning cylinder: peripheral velocity of the surface = 6Voo- (Source: Prandtl and Tietjens, Reference 8.j

symmetric flow about the horizontal axis, and the measurement of lift is essentially zero. Now let us spin the cylinder in a clockwise direction about its axis. The resulting flow fields are shown in Figure 3.34b and c. For a moderate amount of spin (Figure

3.34b), the stagnation points move to the lower part of the cylinder, similar to the theoretical flow sketched in Figure 3.33a. If the spin is sufficiently increased (Figure 3.34c), the stagnation point lifts off the surface, similar to the theoretical flow sketched in Figure 3.33c. And what is most important, a finite lift is measured for the spinning cylinder in the wind tunnel. What is happening here? Why does spinning the cylinder produce lift? In actuality, the friction between the fluid and the surface of the cylinder tends to drag the fluid near the surface in the same direction as the rotational motion. Superimposed on top of the usual nonspinning flow, this “extra” velocity contribution creates a higher-than-usual velocity at the top of the cylinder and a lower-than-usual velocity at the bottom, as sketched in Figure 3.35. These velocities are assumed to be just outside the viscous boundary layer on the surface. Recall from Bernoulli’s equation that as the velocity increases, the pressure decreases. Hence, from Figure 3.35, the pressure on the top of the cylinder is lower than on the bottom. This pressure imbalance creates a net upward force, that is, a finite lift. Therefore, the theoretical prediction embodied in Equation (3.140) that the flow over a circular cylinder can produce a finite lift is verified by experimental observation.

The general ideas discussed above concerning the generation of lift on a spinning circular cylinder in a wind tunnel also apply to a spinning sphere. This explains why a baseball pitcher can throw a curve and how a golfer can hit a hook or slice—all of which are due to nonsymmetric flows about the spinning bodies, and hence the generation of an aerodynamic force perpendicular to the body’s angular velocity vector. This phenomenon is called the Magnus effect, named after the German engineer who first observed and explained it in Berlin in 1852.

It is interesting to note that a rapidly spinning cylinder can produce a much higher lift than an airplane wing of the same planform area; however, the drag on the cylinder is also much higher than a well-designed wing. As a result, the Magnus effect is not employed for powered flight. On the other hand, in the 1920s, the German engineer Anton Flettner replaced the sail on a boat with a rotating circular cylinder with its axis vertical to the deck. In combination with the wind, this spinning cylinder provided propulsion for the boat. Moreover, by the action of two cylinders in tandem and rotating in opposite directions, Flettner was able to turn the boat around. Flettner’s device was a technical success, but an economic failure because the maintenance on the machinery to spin the cylinders at the necessary high rotational speeds was too costly. Today, the Magnus effect has an important influence on the performance of spinning missiles; indeed, a certain amount of modem high-speed aerodynamic research has focused on the Magnus forces on spinning bodies for missile applications.

Low pressure
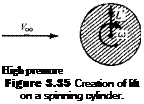
Подпись: High pressure Figure 3.35 Creation of lift on a spinning cylinder. V

V

image273

image274

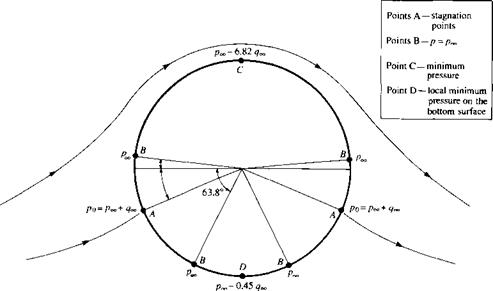
Figure 3.36 Values of pressure at various locations on the surface of a circular cylinder; lifting case with finite circulation. The values of pressure correspond to the case discussed in Example 3.10.


Lifting Flow Over a Cylinder

There are four points on the circular cylinder where p = Poo – These are sketched in Figure 3.36, along with the stagnation point locations. As shown in Example 3.10, the minimum pressure occurs at the top of the cylinder and is equal to рх — 6.82qx. A local minimum pressure occurs at the bottom of the cylinder, where в = Зл/2. This local minimum is given by

Hence, at the bottom of the cylinder, p = px — 0.45^.
Historical Note: Prandtl—The Man

The modern science of aerodynamics rests on a strong fundamental foundation, a large percentage of which was established in one place by one man—at the Univer­sity of Gottingen by Ludwig Prandtl. Prandtl never received a Noble Prize, although his contributions to aerodynamics and fluid mechanics are felt by many to be of that caliber. Throughout this book, you will encounter his name in conjunction with ma­jor advances in aerodynamics: thin airfoil theory in Chapter 4, finite-wing theory in Chapter 5, supersonic shock – and expansion-wave theory in Chapter 9, compress­ibility corrections in Chapter 11, and what may be his most important contribution, namely, the boundary-layer concept in Chapter 17. Who was this man who has had such a major impact on fluid dynamics? Let us take a closer look.

Ludwig Prandtl was bom on February 4, 1874, in Freising, Bavaria. His father was Alexander Prandtl, a professor of surveying and engineering at the agricultural college at Weihenstephan, near Freising. Although three children were born into the Prandtl family, two died at birth, and Ludwig grew up as an only child. His mother, the former Magdalene Ostermann, had a protracted illness, and partly as a result of this, Prandtl became very close to his father. At an early age, Prandtl became interested in his father’s books on physics, machinery, and instmments. Much of Prandtl’s remarkable ability to go intuitively to the heart of a physical problem can be traced to his environment at home as a child, where his father, a great lover of nature, induced Ludwig to observe natural phenomena and to reflect on them.

In 1894, Prandtl began his formal scientific studies at the Technische Hochschule in Munich, where his principal teacher was the well-known mechanics professor, August Foppl. Six years later, he graduated from the University of Munich with a Ph. D., with Foppl as his advisor. However, by this time Prandtl was alone, his father having died in 1896 and his mother in 1898.

By 1900, Prandtl had not done any work or shown any interest in fluid mechanics. Indeed, his Ph. D. thesis at Munich was in solid mechanics, dealing with unstable elastic equilibrium in which bending and distortion acted together. (It is not generally recognized by people in fluid dynamics that Prandtl continued his interest and research in solid mechanics through most of his life—this work is eclipsed, however, by his major contributions to the study of fluid flow.) However, soon after graduation from

Munich, Prandtl had his first major encounter with fluid mechanics. Joining the Nuremburg works of the Maschinenfabrick Augsburg as an engineer, Prandtl worked in an office designing mechanical equipment for the new factory. He was made responsible for redesigning an apparatus for removing machine shavings by suction. Finding no reliable information in the scientific literature about the fluid mechanics of suction, Prandtl arranged his own experiments to answer a few fundamental questions about the flow. The result of this work was bis new design for shavings’ cleaners. The apparatus was modified with pipes of improved shape and size, and carried out satisfactory operation at one-third its original power consumption. Prandtl’s contributions in fluid mechanics had begun.

One year later, in 1901, he became Professor of Mechanics in the Mathematical Engineering Department at the Technische Hochschule in Hanover. (Please note that in Germany a “technical high school” is equivalent to a technical university in the United States.) It was at Hanover that Prandtl enhanced and continued his new-found interest in fluid mechanics. He also developed his boundary-layer theory and became interested in supersonic flow through nozzles at Hanover. In 1904, Prandtl delivered his famous paper on the concept of the boundary layer to the Third Congress on Mathematicians at Heidelberg. Entitled “Uber Flussigkeitsbewegung bei sehr kleiner Reibung,” Prandtl’s Heidelberg paper established the basis for most modem calculations of skin friction, heat transfer, and flow separation (see Chapters 15 to 20). From that time on, the star of Prandtl was to rise meteorically. Later that year, he moved to the prestigious University of Gottingen to become Director of the Institute for Technical Physics, later to be renamed Applied Mechanics. Prandtl spent the remainder of his life at Gottingen, building his laboratory into the world’s greatest aerodynamic research center of the 1904-1930 time period.

At Gottingen, during 1905-1908 Prandtl carried out numerous experiments on supersonic flow through nozzles and developed oblique shock – and expansion-wave theory (see Chapter 9). He took the first photographs of the supersonic flow through nozzles, using a special schlieren optical system (see chapter 4 of Reference 21). From 1910 to 1920, he devoted most of his efforts to low-speed aerodynamics, principally airfoil and wing theory, developing the famous lifting-line theory for finite wings (see Section 5.3). Prandtl returned to high-speed flows in the 1920s, during which he contributed to the evolution of the famous Prandtl-Glauert compressibility correction (see Sections 11.4 and 11.11).

By the 1930s, Prandtl was recognized worldwide as the “elder statesman” of fluid dynamics. Although he continued to do research in various areas, including structural mechanics and meteorology, his “Nobel Prize-level” contributions to fluid dynamics had all been made. Prandtl remained at Gottingen throughout the turmoil of World War II, engrossed in his work and seemingly insulated from the intense political and physical disruptions brought about by Nazi Germany. In fact, the German Air Ministry provided Prandtl’s laboratory with new equipment and financial support. Prandtl’s attitude at the end of the war is reflected in his comments to a U. S. Army interrogation team which swept through Gottingen in 1945; he complained about bomb damage to the roof of his house, and he asked how the Americans planned to support his current and future research. Prandtl was 70 at the time and was still going strong. However, the fate of Prandtl’s laboratory at this time is summed up in the words of Irmgard Flugge-Lotz and Wilhelm Flugge, colleagues of Prandtl, who wrote 28 years later in the Annual Review of Fluid Mechanics (Vol. 5, 1973):

World War II swept over all of us. At its end some of the research equipment was dismantled, and most of the research staff was scattered with the winds. Many are now in this country (the United States) and in England, some have returned. The seeds sown by Prandtl have sprouted in many places, and there are now many “second growth” Gottingers who do not even know that they are.

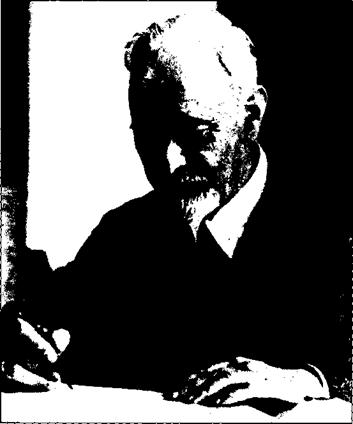
What type of person was Prandtl? By all accounts he was a gracious man, studious, likable, friendly, and totally focused on those things that interested him. He enjoyed music and was an accomplished pianist. Figure 5.47 shows a rather introspective man busily at work. One of Prandtl’s most famous students, Theodore von Karman, wrote in his autobiography The Wind and Beyond (Little, Brown and Company, Boston, 1967) that Prandtl bordered on being naive. A favorite story along these lines is that, in 1909, Prandtl decided that he should be married, but he did not

image466

Figure 5.47 Ludwig Prandtl (1875-1953).

know quite what to do. He finally wrote to Mrs. Foppl, the wife of his respected teacher, asking permission to marry one of her two daughters. Prandtl and Foppl’s daughters were acquainted, but nothing more than that. Moreover, Prandtl did not stipulate which daughter. The Foppl’s made a family decision that Prandtl should marry the elder daughter, Gertrude. The marriage took place, leading to a happy relationship. The Prandtl’s had two daughters, bom in 1914 and 1917.

Prandtl was considered a tedious lecturer because he could hardly make a state­ment without qualifying it. However, he attracted excellent students who later went on to distinguish themselves in fluid mechanics—such as Jakob Ackeret in Zurich, Switzerland, Adolf Busemann in Germany, and Theodore von Karman at Aachen, Germany, and later at Cal Tech in the United States.

Prandtl died in 1953. He was clearly the father of modern aerodynamics—a monumental figure in fluid dynamics. His impact will be felt for centuries to come.

5.9 Summary

Return to the chapter road map in Figure 5.5, and review the straightforward path we have taken during the development of finite-wing theory. Make certain that you feel comfortable with the flow of ideas before proceeding further.

A brief summary of the important results of this chapter follows:

The wing-tip vortices from a finite wing induce a downwash which reduces the angle of attack effectively seen by a local airfoil section:

acff = a — o’, [5.1]

In turn, the presence of downwash results in a component of drag defined as induced drag D,.


Vortex sheets and vortex filaments are useful in modeling the aerodynamics of finite wings. The velocity induced by a directed segment dl of a vortex filament is given by the Biot-Savart law:


Historical Note: Prandtl—The Man

[5.2]


In Prandtl’s classical lifting-line theory, the finite wing is replaced by a single spanwise lifting line along which the circulation F(y) varies. A system of vortices trails downstream from the lifting line, which induces a downwash at the lifting line. The circulation distribution is determined from the fundamental equation


Historical Note: Prandtl—The Man

(dF jdy) dy >’0 – V


[5.23]


image467

Types of Flow

An understanding of aerodynamics, like that of any other physical science, is obtained through a “building-block” approach—we dissect the discipline, form the parts into nice polished blocks of knowledge, and then later attempt to reassemble the blocks to form an understanding of the whole. An example of this process is the way that different types of aerodynamic flows are categorized and visualized. Although nature has no trouble setting up the most detailed and complex flow with a whole spectrum of interacting physical phenomena, we must attempt to understand such flows by modeling them with less detail, and neglecting some of the (hopefully) less significant phenomena. As a result, a study of aerodynamics has evolved into a study of numerous and distinct types of flow. The purpose of this section is to itemize and contrast these types of flow, and to briefly describe their most important physical phenomena.

1.10.1 Continuum Versus Free Molecule Flow

Consider the flow over a body, say, e. g., a circular cylinder of diameter d. Also, consider the fluid to consist of individual molecules, which are moving about in random motion. The mean distance that a molecule travels between collisions with neighboring molecules is defined as the mean-free path X. If X is orders of magnitude smaller than the scale of the body measured by d, then the flow appears to the body as a continuous substance. The molecules impact the body surface so frequently that the body cannot distinguish the individual molecular collisions, and the surface feels the fluid as a continuous medium. Such flow is called continuum flow. The other extreme is where X is on the same order as the body scale; here the gas molecules are spaced so far apart (relative to d) that collisions with the body surface occur only infrequently, and the body surface can feel distinctly each molecular impact. Such flow is calledfree molecular flow. For manned flight, vehicles such as the space shuttle encounter free molecular flow at the extreme outer edge of the atmosphere, where the air density is so low that X becomes on the order of the shuttle size. There are intermediate cases, where flows can exhibit some characteristics of both continuum and free molecule flows; such flows are generally labeled “low-density flows” in contrast to continuum flow. By far, the vast majority of practical aerodynamic applications involve continuum flows. Low-density and free molecule flows are just a small part of the total spectrum of aerodynamics. Therefore, in this book we will always deal with continuum flow;

i. e., we will always treat the fluid as a continuous medium.

Velocity Potential

Recall from Section 2.12 that an irrotational flow is defined as a flow where the vorticity is zero at every point. From Equation (2.129), for an irrotational flow,

§ = V x V = 0 [2.152]

Consider the following vector identity: if ф is a scalar function, then

V x (V0) = 0 [2.153]

i. e., the curl of the gradient of a scalar function is identically zero. Comparing Equations (2.152) and (2.153), we see that

Подпись: Y = V0[2.154]

Equation (2.154) states that for an irrotational flow, there exists a scalar function ф such that the velocity is given by the gradient of ф. We denote ф as the velocity poten­tial. ф is a function of the spatial coordinates; i. e., ф = ф(х, у, z), or ф = ф(г, в, z), or ф = ф(г, в, Ф). From the definition of the gradient in cartesian coordinates given by Equation (2.16), we have, from Equation (2.154),

дф дф дф

мі + uj + шк = -^-i + тр-j + тг“к [2.155]

dx dy dz

The coefficients of like unit vectors must be the same on both sides of Equation

(2.155) . Thus, in cartesian coordinates,

Подпись: dф _ dф dx V dyimage179[2.156]

Velocity Potential Подпись: dф
image180

In a similar fashion, from the definition of the gradient in cylindrical and spherical coordinates given by Equations (2.17) and (2.18), we have, in cylindrical coordinates,

and in spherical coordinates,

Подпись:dф _ 1 dф _ 1 dф

dr 6 г дв Ф r sin# ЗФ

The velocity potential is analogous to the stream function in the sense that deriva­tives of ф yield the flow-field velocities. However, there are distinct differences between ф and ф (or ф):

1. The flow-field velocities are obtained by differentiating ф in the same direction as the velocities [see Equations (2.156) to (2.158)], whereas ф (or ф) is differ­entiated normal to the velocity direction [see Equations (2.147) and (2.148), or Equations (2.150) and (2.151)].

2. The velocity potential is defined for irrotational flow only. In contrast, the stream function can be used in either rotational or irrotational flows.

3. The velocity potential applies to three-dimensional flows, whereas the stream function is defined for two-dimensional flows only.2

When a flow field is irrotational, hence allowing a velocity potential to be defined, there is a tremendous simplification. Instead of dealing with the velocity components (say, u, v, and w) as unknowns, hence requiring three equations for these three unknowns, we can deal with the velocity potential as one unknown, therefore requiring the solution of only one equation for the flow field. Once іjr is known for a given problem, the velocities are obtained directly from Equations (2.156) to (2.158). This is why, in theoretical aerodynamics, we make a distinction between irrotational and rotational flows and why the analysis of irrotational flows is simpler than that of rotational flows.

Because irrotational flows can be described by the velocity potential ф, such flows are called potential flows.

In this section, we have not yet discussed how ф can be obtained in the first place; we are assuming that it is known. The actual determination of ф for various problems is discussed in Chapters 3, 6, 11, and 12.

Without Friction Could We Have Lift?

In Section 1.5 we emphasized that the resultant aerodynamic force on a body immersed in a flow is due to the net integrated effect of the pressure and shear stress distributions over the body surface. Moreover, in Section 4.1 we noted that lift on an airfoil is primarily due to the surface pressure distribution, and that shear stress has virtually no effect on lift. It is easy to see why. Look at the airfoil shapes in Figures 4.12 and 4.13, for example. Recall that pressure acts normal to the surface, and for these airfoils the direction of this normal pressure is essentially in the vertical direction, that is, the lift direction. In contrast the shear stress acts tangential to the surface, and for these airfoils the direction of this tangential shear stress is mainly in the horizontal direction, that is, the drag direction. Hence, pressure is the dominant player in the generation of lift, and shear stress has a negligible effect on lift. It is for this reason that the lift on an airfoil below the stall can be accurately predicted by inviscid theories such as that discussed in this chapter.

However, if we lived in a perfectly inviscid world, an airfoil could not produce lift. Indeed, the presence of friction is the very reason why we have lift. These sound like strange, even contradictory statements to our discussion in the preceding
paragraph. What is going on here? The answer is that in real life, the way that nature insures that the flow will leave smoothly at the trailing edge, that is, the mechanism that nature uses to choose the flow shown in Figure 4.13c, is that the viscous boundary layer remains attached to the surface all the way to the trailing edge. Nature enforces the Kutta condition by means of friction. If there were no boundary layer (i. e., no friction), there would be no physical mechanism in the real world to achieve the Kutta condition.

So we are led to the most ironic situation that lift, which is created by the surface pressure distribution—an inviscid phenomenon, would not exist in a frictionless (in­viscid) world. In this regard, we can say that without friction we could not have lift. However, we say this in the informed manner as discussed above.