Category HELICOPTER FLIGHT DYNAMICS

The derivatives Xq, Yp

These derivatives are dominated by the main rotor contributions. For teetering rotors and low flap hinge-offset rotors, the changes in rotor hub X and Y forces are the primary contribution to the pitch and roll moments about the aircraft centre of mass. Hence the derivatives Xq and Yp can contribute significantly to aircraft pitch and roll damping. The basic physical effects for the two derivatives are the same and can be understood from an analysis of a teetering rotor in hovering flight. If we assume that the thrust acts normal to the disc in manoeuvres, and ignoring the small drag forces, then the rotor X force can be written as the tilt of the thrust vector:

X = TPic (4.73)

The pitch rate derivative is then simply related to the derivative of flapping with respect to pitch rate. As the aircraft pitches, the rotor disc lags behind the shaft by an amount proportional to the pitch rate. This effect was modelled in Chapter 3 and the relation­ships were set down ineqns 3.71 and 3.72. For a centrally hinged rotor with zero spring
stiffness, the disc lags behind the shaft by an amount given by the expression

Подпись:двіс 26

д q yil

Подпись: (2CX (07 Подпись: (4.75)

The Lock number у is the ratio of aerodynamic to inertia forces acting on the rotor blade; hence the disc will flap more with heavy blades of low aspect ratio. Equation 4.74 implies that the force during pitching produces a pitch damping moment about the centre of mass that opposes the pitch rate. However, the assumption that the thrust remains normal to the disc has ignored the effect of the in-plane lift forces due to the inclination of the lift vectors on individual blade sections. To examine this effect in more detail we need to recall the expressions for the rotor hub forces from Chapter 3, eqns 3.88-3.99. Considering longitudinal motion only, thus dropping the hub/wind dressings, the normalized X rotor force can be written as

The first term in eqn. 4.75 represents the contribution from the fore and aft blades to the X force when the disc is tilted and is related to the rotor thrust coefficient by the expression

F01) = -(—) (4.76)

0 aos )

This effect accounts for only half of the approximation given by eqn 4.73. Additional effects come from the rotor blades in the lateral positions and here the contributions are from the in-plane tilt of the lift force, i. e.,

Fi(2) = (у – у) віс – у9is (4.77)

During a pitch manoeuvre from the hover, the cyclic pitch can be written as (see eqn 3.72)

Подпись: (4.78)16

01s — ~в1с + ггq

yil

Hence, substituting eqn 4.78 into eqn 4.77 and then into eqn 4.75, the force derivative can be written in the form

Подпись: 16 yii Подпись: (4.79)^ = Ct (1.5________________ ^ = Ct (1.5_________________________ 0L-

дq 12Ct /aos) дq 12Ct /aos

Подпись: 0o 12CT /aos Подпись: hover Подпись: 1 _ aos 8V(2CT) Подпись: (4.8o)

We can see that the thrust is inclined relative to the disc during pitching manoeuvres due to the in-plane loads when the blades are in the lateral position. The scaling coefficient given in eqn 4.79 reduces in the hover to

and has been described as the ‘Amer effect’ (Ref. 4.13). Further discussion can be found in Bramwell (Ref. 4.14) and in the early paper by Sissingh (Ref. 4.15). Although our analysis has been confined to hover, the approximation in eqn 4.79 is reasonably good up to moderate forward speeds. The effect is most pronounced in conditions of high collective pitch setting and low thrust, e. g., high-power climb, where the rotor damping can reduce by as much as 50%. In autorotation, the Amer effect almost disappears.

The derivatives Nu, Nw, Lu, Lw

These four derivatives play an important role in coupling the low-frequency longitudi­nal and lateral motions of the helicopter. The yawing moment derivatives stem largely from the changes in main rotor torque with velocity perturbations, although there is also an effect from the fin (Nu), similar to the contribution of the horizontal stabilizer to Mu. The Nw effect can be quite significant since torque changes to vertical velocity are similar to the direct control coupling-torque changes from collective inputs. The Lu effect reflects the changes in lateral cyclic to trim with forward speed, being domi­nated by the main rotor effect at low speed. Forward velocity perturbations increase the incidence on the forward part of the (coned) disc and reduce the incidence at the rear. The disc will therefore tilt to starboard for anticlockwise rotors (port for clockwise rotors). As forward speed increases, the four derivatives show similar trends and the dominating main rotor components are closely related through the shaft tilt and product of inertia.

The angular velocity derivatives

Our discussion on derivatives with respect to roll, pitch and yaw rate covers three distinct groups – the force derivatives, the roll/pitch moment derivatives due to roll and pitch and the roll/yaw derivatives due to yaw and pitch. Derivatives in the first group largely share their positions in the system matrix (eqn 4.44) with the trim inertial velocity components. In some cases the inertial velocities are so dominant that the aerodynamic effects are negligible (e. g., Zq, Yr). In other cases the aerodynamic effects are important to primary response characteristics. Two such examples are Xq and Yp.

The derivatives Mw, Mv and Mv

Подпись: atp = af ■ Подпись: "Xtp д Подпись: (4.62)

Before leaving the pitching moment derivatives with speed, it should be noted that the incidence at the empennage is a combination of the fuselage incidence and the effect of the rotor downwash at the tail. This effect will normally be taken into account when perturbing the forces and moments with the w perturbation; the rotor thrust and the downwash will change, resulting in an incidence perturbation at the tail. The magnitude of the downwash at the tail depends on the distance between the tail and rotor. Let a f be the fuselage incidence, д the advance ratio and Xtp the downwash at the tail. We can write the incidence at the tail in the form

Подпись: Xtp(t) Подпись: ktpX (t — Up Подпись: ktp (X(t) Подпись: dXltp dt Ue Подпись: (4.63)

The downwash at the tail at time t was generated at the rotor disc at time t — ltp/Ue earlier. If we assume that this time increment is small compared with the response time, we can write

Подпись: dX dt Подпись: dX . dX Oo + w + • dO0 d w Подпись: (4.64)

where ktp is the amplification factor on the downwash. The incidence at the tail therefore depends explicitly on the rate of change of rotor inflow with time. Applying the theory of small perturbations, we can write this downwash acceleration as a linear combination of the rates of change of aircraft states and controls, i. e.,

Thus, we find the appearance of acceleration derivatives like Mw in the longitudinal motion, for which analytic expressions are relatively straightforward to derive from the thrust coefficient and uniform inflow equations. The presence of non-uniform inflow and wake contraction complicates the overall effect, reducing the validity of the above simple approximation. Nevertheless, the physical mechanism is very similar to that found on fixed-wing aircraft where the downwash lag at the tail, attributed entirely to incidence changes on the main wing, leads to an effective acceleration derivative.

Any lateral variation in rotor downwash at the tail will also lead to changes in pitching moments during yaw manoeuvres. This effect is discussed in Refs 4.8, 4.9 and 4.10 where relatively simple flat wake models are shown to be effective in modelling the pitching moment due to sideslip (see Chapter 3), leading to the derivatives Mv and Mv, in a similar fashion to the effect from w perturbations.

Подпись: (4.69)

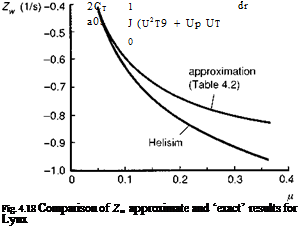
and in forward flight. The derivative Zw represents the initial acceleration following an abrupt vertical gust and is inversely proportional to blade loading (see Chapter 2, eqn 2.63). The much higher typical blade loadings on rotorcraft, compared with fixed-wing aircraft of similar weight, partly account for the smaller values of Zw, and hence lower gust sensitivity, for helicopters in forward flight. A second major factor is disguised in the variation of the heave damping with speed. The forward flight approximation in Table 4.2 is shown plotted against the Lynx value from the Helisim simulation model in Fig. 4.18; the 10% difference at the higher values of advance ratio is attributed to the fuselage and tail. The variation is seen to level off at higher speeds, while the gust sensitivity of fixed-wing aircraft continues to increase linearly with speed (see Fig. 2.28). As discussed in Chapter 2, the reason for the asymptotic behaviour of the helicopter damping stems from the increased harmonic distribution of the airloads as the speed increases. The thrust coefficient can be written as

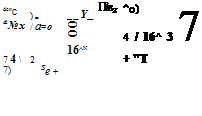
and the in-plane and normal velocity components can be approximated by the expressions

U t ~ r + p sin ф, Up = nz — ki — cos ф — r в’ (4.70)

The harmonic components of thrust in the expanded form of eqn 4.69 therefore define the level of quasi-steady and vibratory loads that reach the fuselage. Perturbations in w show up in the second term in parenthesis in eqn 4.69. The component that increases linearly with forward speed is also a one-per-rev loading. Hence, while the zero-per – rev or quasi-steady term levels off at higher speeds, the vibratory response to a gust at. Nb-per-rev, where Nb is the number of blades, continues to increase. While these loads do not result in significant flight path or attitude changes, and therefore are unlikely to cause handling problems, they do affect the overall ride quality. Further discussion on the general topic of ride quality is contained in Chapter 5.

The derivatives Lv, Nv

Подпись: (fs) V д/ay ) /л=0 Подпись: + Подпись: Oo Подпись: (4.71)

The remaining velocity derivatives belong to the lateral/directional DoFs and the most significant are the sideslip derivatives – the dihedral effect Lv and the weathercock stability Nv. The magnitude of these two moments as sideslip increases determines the lateral/directional static stability characteristics. A positive value of Nv is stabilizing, while a negative value of Lv is stabilizing. Both have the same kind of effects on rotary­wing as on fixed-wing aircraft but with rotary-wing aircraft the new component is the tail rotor which can contribute strongly to both. The magnitude of the tail rotor contribution to the dihedral effect depends on the height of the tail rotor above the aircraft centre of mass. The fuselage can also contribute to Lv if the aerodynamic centre is offset vertically from the centre of mass, as in the case of deep fuselage hulls, which typically leads to a negative Lv component. But once again, the main rotor is usually the dominant effect, especially for helicopters with hingeless rotors, where all the main rotor moments are magnified roughly proportionally with the rotor stiffness. In hover, the derivative Lv is generated by similar aerodynamics to those of the pitch derivative Mu, and as forward flight increases some of the basic similarities remain. As the blades are exposed to the velocity perturbation, the advancing blade experiences an increase in lift, the retreating blade a decrease, and the one-per-rev flapping response occurs approximately 90° around the azimuth, giving a rolling moment to port (starboard for clockwise rotors) for a lateral velocity perturbation and a pitch-up moment in response to a longitudinal velocity perturbation. The extent of the flap response depends on the rotor stiffness, the Lock number and also the trim lift on the rotor blades. To examine the flap derivatives we can refer back to eqns 3.70, 3.71 and 3.72 from Chapter 3. At hover, we can write

Подпись: / dPls_  d^y Подпись: (4.72)

or, for the special case of a rotor hinged at the hub centre, the flap response depends only on the trim lift on the rotor blades, i. e.,

The dihedral effect can therefore potentially change sign for teetering rotors at low and negative rotor thrust conditions that are outside the operational flight envelope for such aircraft, because of such reversals of flap response and the associated hub moments.

The directional stability derivative Nv is critically important for both static and dynamic stability of helicopters. The main contributors are the tail rotor, the vertical fin and the fuselage. The latter is usually destabilizing with the fuselage centre of pressure behind the centre of mass; both the tail rotor and vertical fin are stabilizing (i. e., positive). All are approximately linear with speed up to moderate forward speeds. However, the contribution from the tail rotor is similar to the heave damping on the main rotor, arising from a change in tail rotor thrust due to a change in velocity normal to the disc, and levels off at high speed; the contributions from the fin and fuselage continue to increase in the positive and negative senses respectively. The weathercock

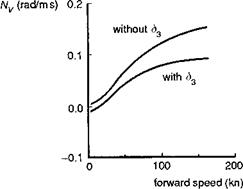
Fig. 4.19 Effect of tail rotor S3 angle on weathercock stability derivative Nv

stability is strongly influenced by the tail rotor S3 angle (see Chapter 3, Section 3.2.2) which reduces blade pitch as a function of blade flapping. On the four-bladed Lynx tail rotor, changes in tail rotor thrust lead to changes in rotor coning and hence changes in tail rotor collective. Figure 4.19 illustrates the comparison of Nv for the Lynx, with and without S3, showing that S3 produces a reduction of about 40% at high speed.

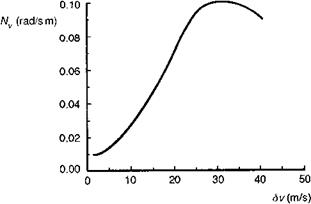
For the Lynx, the low-speed values of Nv tend to be dominated by the inertia coupling with roll (and hence the much stronger dihedral effect Lv) through the product of inertia Ixz (see eqn 4.48). The reduced effectiveness of the tail rotor to directional stability makes the contribution of the vertical fin all the more important. For helicopters with high set tail rotors, these vertical surfaces also carry the tail rotor drive shaft and can have high ratios of thickness to chord. Aerofoil sections having this property can exhibit a flattening or even reversal of the lift curve slope at small incidence values (Ref. 4.11). In such cases it can be expected that the yawing moment due to sideslip will exhibit a strong nonlinearity with sideslip velocity. The Puma features this characteristic and the associated effects on stability have been discussed in Ref. 4.12; the fin aerodynamics are summarized in the Appendix, Section 4B.1. Figure 4.20 shows how the value of

Nv for the Puma varies with the magnitude of the velocity perturbation at a trim speed of 120 knots. At small amplitude, up to about 5 m/s perturbation (corresponding to about 5° of sideslip), the fin contributes nothing to the weathercock stability. As the perturbation is increased up to 30 m/s (corresponding to nearly 30° of sideslip) there is a tenfold increase in Nv. The effects of this nonlinearity on stability and response will be discussed later, but are obviously significant and need to be taken into account in the linearization process.

The derivatives Xu, Yv, Xv and Yu (Mv and Lu)

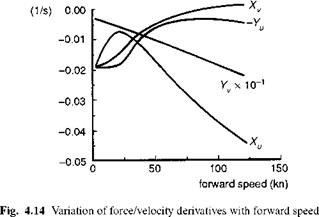
The four derivatives Xu, Yv, Xv and Yu are closely associated with each other at low speed. They are shown as a function of speed for the Lynx in straight and level flight in Fig. 4.14. In high-speed flight the coupling derivatives are fairly insignificant and the direct force dampings Xu and Yv are practically linear with speed and reflect the drag and sideforce on the rotor-fuselage combination respectively. At hover and at low speed, all four derivatives are the same order of magnitude. The direct derivatives are principally due to the disc tilts to aft and port following perturbations in u and v
(see eqn 4.53). The coupling derivatives are less obvious, and we have to look into the theory of non-uniform inflow, described in Chapter 3, for an explanation to the surprisingly large values of Xv and Yu extending to about 40 knots forward flight. At the hover condition, a perturbation in forward velocity u leads to a strong variation in wake angle x (eqn 3.145) and hence non-uniform inflow A. xc. An approximation to the increase in inflow at the rear of the disc can be derived from eqn 3.144:

Подпись: (4.58)SOxc ^ 1 dp, 2

For every 1 m/s increase in forward velocity, the downwash increases by 0.5 m/s at the rear of the disc. The linear variation of inflow along the blade radius results in a uniform incidence change; hence the effect is identical to cyclic pitch in the hover. The direct rotor response to a longitudinal incidence distribution is therefore a lateral disc tilt j1s. The derivative of lateral flapping with inflow can be derived from eqn 3.71, as

Подпись: (4.59)

эв1* _________ L_ S = 8 (хв-0

3^1c 1 + Sj ’ p Y

where the Stiffness number is given in terms of the flap frequency ratio and Lock number.

The Stiffness number ranges up to values of about 0.3 for current helicopters; hence the lateral flapping derivative in eqn 4.58 is close to unity and a perturbation of 1 m/s in forward velocity leads to about 0.2°-0.3° lateral disc tilt to starboard, de­pending on the rotorspeed. Similar arguments can be made to explain the low speed variation of Xv and the same effect will be reflected in the moment derivatives Mv and L u. These variations in non-uniform inflow can be expected to impact the coupling of lateral and longitudinal motions at low speed. We shall return to this topic later when discussing the natural modes of motion.

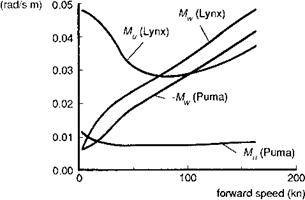
Fig. 4.15 Variation of longitudinal static stability derivatives with forward speed The derivatives Mu and Mw

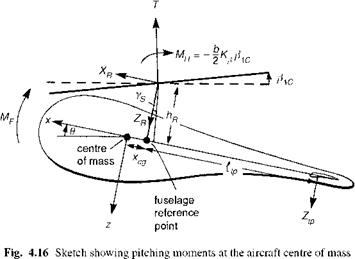
The derivatives Mu and Mw, the so-called speed and incidence static stability derivatives, have a major effect on longitudinal stability and hence handling qualities. For fixed-wing aircraft flying at low subsonic speeds, the speed stability derivative is practically zero – all the aerodynamic moments are proportional to dynamic pressure and the derivative works out to be proportional to the trim value of aerodynamic pitching moment, i. e., zero. With a helicopter, the main rotor moments due to speed changes are roughly constant across the speed range, but the aerodynamic loads on the fuselage and empennage are strong functions of forward velocity. In particular, the normal load on the horizontal stabilizer gives a strong pitching moment at the centre of mass and this component provides a contribution to Mu proportional to the trim load on the tail. Figure 4.15 compares the variation of the two static stability derivatives with speed for Lynx and Puma. The fourfold increase in magnitude of Mu for the Lynx relative to the Puma is a result of the much higher rotor moments generated by the hingeless rotor for the same velocity perturbation. Both aircraft exhibit static speed stability; an increase in forward speed causes the disc to flap back, together with an increase in the download on the tailplane, resulting in a nose-up pitching moment and a tendency to reduce speed. This positive (apparent) speed stability is important for good handling qualities in forward flight (see Chapter 6), but can degrade dynamic stability in both hover and forward flight (see the later section on stability of the natural modes). Comparing the incidence stability derivative Mw for the two aircraft, we can see similar orders of magnitude, but the Lynx exhibits instability while the Puma is stable. This derivative was discussed at some length in Chapter 2 (see Figs 2.25 and 2.26). In forward flight, a positive perturbation in normal velocity, w, causes a greater increase in lift on the advancing than on the retreating side of the disc. The disc flaps back giving rise to a positive, nose-up, destabilizing, pitching moment. This effect does not change in character between an articulated rotor (Puma) and a hingeless rotor (Lynx), but the magnitude is scaled by the hub stiffness. The pitching moments arise from three major sources – the main rotor, the tailplane and the fuselage (Fig. 4.16), written as shown in eqn 4.60.

In very approximate form, the rotor moment can be written as a combination of a moment proportional to the disc tilt and one proportional to the rotor thrust, i. e.,

M ~ — ^ — Kp + hRT^ Ac — (xcg + hRYs)T + (ltp + xcg)Ztp + Mf (4.61)

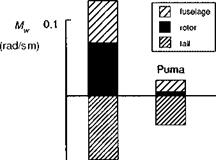
The pitching moments from the rotor, tailplane and fuselage are shown in Fig. 4.16. The contribution of the tail to Mw is always stabilizing – with a positive incidence change, the tail lift increases (Ztp reduces) resulting in a nose-down pitch moment. The importance of the horizontal tail to the derivative Mw and helicopter pitch stability is outlined in Ref. 4.7, where the sizing of the tail for the YUH-61A is discussed. The contribution from the fuselage is nearly always destabilizing; typically the aerodynamic centre of the fuselage is forward of the centre of mass. The overall contribution from the main rotor depends on the balance between the first two terms in eqn 4.61. We have already stated that the disc always flaps back with a positive (upward) perturbation in w, but the thrust also increases; hence the second term, due to the offset of the thrust from the centre of mass, is actually stabilizing for configurations with forward centre of mass and shaft tilt. This is the major effect for fixed-wing aircraft, where the distance between the centre of mass and the aerodynamic centre of the whole aircraft is referred to as the static margin. For small offset articulated rotors, with a centre of mass well forward of the shaft, the thrust offset effect can be as large as the hub moment term in eqn 4.61, resulting in a fairly small overall rotor moment. This is the case for the Puma, with our baseline configuration having a forward centre of mass location; also, the flap hinge offset is only 3.8% of the rotor radius. For hingeless rotors with aft centre of mass, both thrust offset and hub moment effects are destabilizing, with the hub moment due to flapping dominating. All three contributions to the incidence stability vary approximately linearly with speed above about 40 knots. Figure 4.17 illustrates the contributions from the different components to Mw at the 120-knot high-speed condition. The overall magnitude of all three components is greater for the Lynx, reflecting the much smaller pitch moment of inertia (which normalizes the derivative) for that aircraft compared with the Puma.

Lynx

-0.1

Fig. 4.17 Contributions to the static stability derivative Mw at 120 knots for Lynx and Puma


The derivatives

There are 36 stability derivatives and 24 control derivatives in the standard 6 DoF set. In this section we shall discuss a limited number of the more important derivatives and their variation with configuration and flight condition parameters. The complete set of numerical derivatives for all three reference aircraft are contained as charts in the Appendix, Section 4B.2, and the reader may find it useful to refer to these as the discussion unfolds. It should be noted that the derivatives plotted in Appendix 4B include the inertial and gravitational effects from eqn 4.44. For example, the elements Zq and Yr tend to be dominated by the forward velocity term Ue. Each derivative is made up of a contribution from the different aircraft components – the main rotor, fuselage, etc. In view of the dominant nature of the rotor in helicopter flight dynamics, we shall give particular, but certainly not exclusive, attention to main rotor derivatives in the following discussion. The three most significant rotor disc variables are the rotor thrust T and the two multi-blade coordinate disc tilts fiic and fBs. During disturbed motion these rotor states will vary according to the algebraic relationships derived in Chapter 3 (eqns 3.90, 3.65). Considering the simple approximation that the rotor thrust is normal to the disc, for small flapping angles, the rotor X and Y forces take the form

Xr = TPic, Yr = – TPis (4.52)

The derivatives with respect to any motion or control variable can then be written as, for example,

Подпись: (4.53)d Xr d T BBc

—R = —p1c + T — d u d u d u

Rotor force and moment derivatives are therefore closely related to individual thrust and flapping derivatives. Many of the derivatives are strongly nonlinear functions of velocity, particularly the velocity derivatives themselves. The derivatives are also nonlinear functions of the changes in downwash during perturbed motion, and can be written as a linear combination of the individual effects, as in the thrust coefficient change with advance ratio, given by

dCt / dCt dCt dko ЭCt 3kis dCt 3kic

Bp, Bp. Jx=const dko dp. 3kis Bp Bkc Bp

where Ct is the thrust coefficient and д the advance ratio defined by

T V

CT =———- »—г, д =—— (4.55)

T p(V R)2nR2 V R

Подпись: (4.56)

and the Xs are the components of the rotor induced inflow in the harmonic, trapezoidal form

Подпись: dCr дд ) X=const Подпись: a0s ~ Подпись: д Подпись: < + Т) + 2 Подпись: (4.57)

The thrust coefficient partial derivative with respect to д can be written as

The rotor force, moment and flapping equations as derived in Chapter 3 are expressed in terms of the advance ratio in hub/wind axes. The relationships between the velocity components at the aircraft centre of mass and the rotor in-plane and out-of-plane velocities are given in Chapter 3, Section 3A.4. It is not the intention here to derive general analytic expressions for the derivatives; hence, we shall not be concerned with the full details of the transformation from rotor to fuselage axes except where this is important for enhancing our understanding.

The translational velocity derivatives

Velocity perturbations give rise to rotor flapping, changes in rotor lift and drag and the incidence and sideslip angles of the flow around the fuselage and empennage. Although we can see from the equations in the 3.70 series of Chapter 3 that the flapping appears to be a strongly nonlinear function of forward velocity, the longitudinal cyclic required to trim, as shown in Fig. 4.10(a), is actually fairly linear up to moderate forward speeds. This gives evidence that the moment required to trim the flapping at various speeds is fairly constant and hence the primary longitudinal flapping derivative with forward speed is also relatively constant. The orientation between the fuselage axes and rotor hub/wind axes depends on the shaft tilt, rotor flapping and sideslip angle; hence a u velocity perturbation in the fuselage system, say, will transform to give дх, Ду and дг disturbances in the rotor axes. This complicates interpretation. For example, the rotor force response to дг perturbations is much stronger than the response to the in-plane velocities, and the resolution of this force through only small angles can be the same order of magnitude as the in-plane loads. This is demonstrated in the derivatives Xu and Zu at low speed where the initial tendency is to vary in the opposite direction to the general trend in forward flight.

Control angles to support the forces and moments

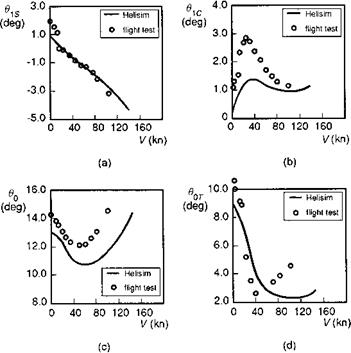
At this point in the trim algorithm, the various forces and moments on the compo­nents are, practically speaking, balanced, and now we have to look at the internal rotor equations to compute the controls required to hold these forces. The main rotor control angles are derived from the inverse of the flapping angle calculations given in the 3.60 series of equations (see Chapter 3), coupled with the thrust coefficient equation for the collective pitch. Figures 4.10(a)-(d) show a comparison between flight and theory of the main and tail rotor controls for the Bo105 as a function of forward speed. The errors give an indication of the level of fidelity achievable with the Level 1 modelling of Chapter 3. The nonlinear aerodynamic and blade twist effects increase the collective pitch required in flight relative to Helisim. As noted above in the discussion on lon­gitudinal trim, the downwash over the tail causes a pitch up in the low-speed regime, giving rise to an increase in the required forward cyclic; the comparison for the Bo105 is actually very good in the mid-speed region (Fig. 4.10(a)). Also at low speed and into the transition region, the inflow roll increases the left cyclic required, revealing a failing in the simple trapezoidal model of longitudinal inflow predicted by the Glauert representation (Fig. 4.10(b)). The comparison of main rotor collective pitch is illus­trated in Fig. 4.10(c). The underprediction by about 10% in hover, increasing to over 30% at high speed, is typical of linear aerodynamic theory. The tail rotor pitch is also usually underpredicted (Fig. 4.10(d)) as a combined result of missing tail rotor losses

Fig. 4.10 Bo105 control angles in level trimmed flight: (a) longitudinal cyclic; (b) lateral cyclic; (c) main rotor collective; (d) tail rotor collective

and underpredicted main rotor torque, most noticeably at high speed. At moderate – to high-speed flight, the absence of tail rotor flapping and the powerful interactions with the aerodynamics of the rear fuselage and vertical fin increase the modelling discrepancies.

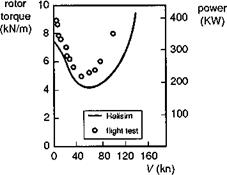
The power required, shown in Fig. 4.11 for the Bo105, has the characteristic bucket profile as a function of forward speed, reflecting the reduction in induced (rotor drag) power and increase in parasite (fuselage drag) power as speed increases. At high

Fig. 4.11 Bo105 power required as a function of forward speed

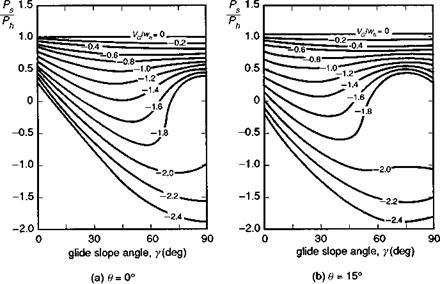
speed, nonlinear rotor aerodynamic terms have a significant effect on collective pitch and power required, leading to the gross errors with the simplified Level 1 modelling as shown by the comparison withBo105 flight test data in Figs 4.10(c) and4.11. For moderate rates of climb and descent, the Level 1 theory predicts the basic trends in power required and control angles fairly well. The rotor is particularly efficient in climbing flight. While the power required to climb a fixed-wing aircraft is approxi­mately equal to the rate of change of potential energy, the increased mass flow through the rotor of a helicopter reduces the power required to half this value. For similar reasons, the rotor is inefficient in descent, the power reduction corresponding to only half the rate of loss of potential energy. These simple results are explicable through the momentum theory of Level 1 modelling. In steep descent, however, strongly nonlinear aerodynamic effects dominate the trim (and stability and response) requirements. We have already discussed the vortex-ring region in both Chapters 2 and 3 and highlighted the inadequacy of simple momentum theory for predicting the power required and response characteristics. On the other hand, for higher rates of descent, between vortex ring and autorotation, the empirical modifications to momentum theory discussed in Chapter 3 provide a reasonable interpolation between the helicopter and windmill so­lutions to the momentum equations for rotor inflow. An analysis of trim requirements in helicopter descending flight is reported by Heyson in Ref. 4.3. At steep angles of descent, and flight speeds of about 1.5 times the hover induced velocity, the power required to increase the rate of descent actually increases. Figure 4.12, taken from Ref. 4.3, illustrates the power required as a function of glide slope angle for several different values of flight speed along the glide slope. The reference velocity wh and power Ph correspond to the hover values, otherwise the results are quite general. At steep angles of descent (>60°), the power required to increase the rate of descent at a constant speed increases. Also shown, in Fig. 4.12(b), is a power contour for the rotor pitched up by

Fig. 4.12 Power required in descending flight (from Ref. 4.3): (a) в = 0°; (b) в = 15‘

15°, showing the expanded region of increased power required as a function of flight path angle. Heyson refers to this, and the associated response characteristics, as power settling, and comments on the operational significance of this strong nonlinearity. To quote from Heyson’s report,

A pilot flying a steep approach generally flies with reference to the ground either visually or through the use of some avionic system. Although he can sense sidewinds as a drift, his perception of a headwind or tailwind is poor. Even a light tail wind can produce a major difference between the glideslope with respect to the surrounding air mass and the geometric glideslope. If the flight is stabilised near one of the minimum power points, Fig. 12 shows many combinations of у, в, and VG/wh for which a tailwind induced change of only 10° or 15° in у increases the required shaft power by 50 to 100% of the installed power. In the presence of such a major increase in required power, the helicopter settles, thus increasing the glide slope and still further increasing the required power.

With the above discussion on steep descent, we have strayed into the response domain, showing the importance of predictable trim characteristics to the pilot’s flying task. We shall return to this aspect in Chapters 5 and 7.

Predicting the trim control angles required, the power required and the steady loads on the various components forms a basis for calculating such static characteristics as the control margins at the flight envelope boundary, payload and range capabilities and limit loads on the tail boom in sideslipping flight. Achievement of accurate estimates (e. g., to within a few per cent of the true values) of such parameters will almost certainly require more detailed modelling than that described in the above analysis. The main rotor forces are a more complex function of rotor motion and the aerodynamics can be strongly nonlinear in high speed or at high thrust coefficient. The fuselage and empennage forces can be strongly influenced by the rotor wake and the tail rotor flapping can tilt the disc and thrust vector and change the power required. In some cases these will be first-order effects and cannot be ignored. Certainly, the component interactions will tend to spoil the simple sequential nature of the algorithm described above, giving rise to many more potential convergence problems and demanding more sophistication in the iterative solution. For trend predictions, however, the simple theory can be remarkably accurate; the characteristic shapes of the trim control curves is evidence of this. Examination of the effects of small changes from some baseline configuration can also provide useful insight into the sensitivities to design configuration or flight state parameters.

Trim solutions are generally unique, with a fixed set of control positions defining each equilibrium condition. A natural question that arises out of the study of trim is what happens if the aircraft is disturbed by a small amount from the trim? This could happen with a small gust or nudge of the controls. Will the aircraft immediately settle into a new trim, return to the original trim or depart away from the trim state in an unstable fashion? These questions cannot be answered from analysis of the trim equations; they require the full dynamic equations of motion from which the time evolution of the flight trajectory and fuselage attitudes can be determined. While a wide flight envelope simulator will usually require the full nonlinear equations, the answers to our questions regarding the effects of small perturbations can generally be found through analysis of the linearized equations using the concepts of the stability and control derivatives.

The concept of stability of motion in a dynamic system is a very intuitive one that grasped the imagination of early pioneers of aviation. The supporting archetypal theory for flight stability was developed in the very early days of manned flight (Refs 4.2 and 4.4). The concept that stability and control were unlikely partners, the latter gaining from shortcomings in the former, was also recognized in these same early days, such that marginal stability, or even instability, was actually a useful property when considering the required piloting effort. Since that time much has been written on stability and control and much of the theoretical foundation for the stability of low-speed fixed- wing aircraft was already well developed by the time that early helicopters were in serious development. The first helicopters were unstable but the presence of mild instabilities at low speed was probably something of a blessing because control power was fairly marginal on these early craft. While fixed-wing aircraft have developed and can easily be conferred with high levels of natural stability and compatible levels of control, basically helicopters are still naturally unstable and require some level of artificial stabilization to ensure safe control in poor weather and when flying under instrument flight rules (IFR). The degree of stability required in helicopters to ensure safe operations is an important flying quality consideration, and will be discussed in some detail later in Chapter 6.

Understanding the flight behaviour of helicopters, why they are so difficult to build with natural stability, and developing rational explanations for the many curious dynamic characteristics, cannot be achieved simply through deriving the equations of Chapter 3, or even by building a simulation model. These are necessary but insufficient activities. The development of a deep understanding of flight behaviour comes from the intellectual interplay between theory and practice, with an emphasis on handson practice and analytical theory. Most of the understanding of stability and control has come from relatively simple theoretical approximations that permit expression of cause and effect in parametric form. Coincidentally, the publication of the earliest texts that provided a definitive treatment of both fixed – and rotary-wing stability and control occurred in 1952 (Refs 4.2, 4.5). Both of these texts deal with fundamental concepts in analytical terms that are still valid today. While our ability to model more and more complex representations of the aerodynamics and dynamics of aircraft seems to extend every year, our understanding of why things happen the way they do essentially comes from simple theory melded with a good physical understanding.

With these words of introduction we embark on this section on stability (and con­trol) with the guiding light in search of simple approximations to complex behaviour. We shall draw heavily on the theory of linear dynamic systems but the underlying vector-matrix theoretical methods, including a discussion on eigenanalysis, are con­tained in Appendix 4A, to which the unfamiliar reader is referred. Features of the classical description of aircraft stability are the concepts of static and dynamic stabil­ity, the former relating to the immediate behaviour following a disturbance, the latter to the longer term behaviour. These are useful but elementary concepts, particularly for fixed-wing aircraft, drawing parallels with stiffness and damping in a simple mechani­cal analogue, but the distinction is blurred in the study of helicopter motion because of the stronger couplings between longitudinal and lateral motions. The perspective we shall take here is to draw the distinction between local and global stability – the former relating to the stability of motion following small disturbances from a trim condition, the latter relating to larger, potentially unbounded motion. Of course, unbounded mo­tion is only a theoretical concept, and ultimately the issue is likely to be one of strength rather than stability in this case. Analysis tools for large nonlinear motions of aircraft are limited and tend either to be based on the assumption that the motion is nearly linear (i. e., nonlinearities are weak), so that approximating describing functions can be used, or to be applicable to very special forms of strong nonlinearity that can be described analytically.

Nonlinear analysis of fixed-wing aircraft has been stimulated by such phenomena as stall (including deep stall), spinning, inertial coupling and wing rocking. The need to understand the flight dynamics in these situations has led to extensive research into analytical methods that are able to predict the various kinds of departure, particularly during the 1970s and 1980s (Ref. 4.6). Helicopter flight dynamics also has its share of essentially nonlinear phenomena including vortex-ring state, main rotor wake-tail rotor interactions, rotor stall and rotor wake-empennage interactions. Much less constructive analytic work has been done on these nonlinear problems, and many potentially fruitful areas of research need attention. The methods developed for fixed-wing analysis will be equally applicable to helicopters and, just as the transfer of basic linear analysis techniques gave the helicopter engineers considerable leverage in early days, so too will the describing function and bifurcation techniques that have enabled so much insight into the dynamics of fixed-wing combat aircraft. Nonlinear problems are considerably more difficult than linear ones, one consolation being that they are usually considerably more interesting too, but little has been published to date on nonlinear helicopter flight dynamics.

In this chapter we restrict the discussion to linear analysis. We shall consider classical 6 DoF motion in detail. This level of approximation is generally good for low-moderate frequency, handling qualities analysis. The assumption underlying the 6 DoF theory is that the higher order rotor and inflow dynamics are much faster than the fuselage motions and have time to reach their steady state well within the typical time constants of the whole aircraft response modes. This topic has been discussed in the Tour of Chapter 2 and the conditions for validity are outlined in Appendix 4A.

4.3.1 Linearization

Consider the helicopter equations of motion described in nonlinear form, given by

x = F(x, u, t) (4.35)

In 6 DoF form, the motion states and controls are

x = {u, w, q, 9, v, p, ф, r, ф}

where u, v and w are the translational velocities along the three orthogonal directions of the fuselage fixed axes system described in Appendix 3A; p, q and r are the angular velocities about the x-, y- and z-axes and 9, ф and ф are the Euler angles, defining the orientation of the body axes relative to the earth.

The control vector has four components: main rotor collective, longitudinal cyclic, lateral cyclic and tail rotor collective

u = 91s, 91c, 90T }

The expanded form of eqn 4.35 can be written as eqn 4.36 combined with the Euler angles, eqn 4.37 (inverse of eqn 3A.42), as derived in Chapter 3 and Appendix 3A.

X

U = —(wq — vr) +——————– g sin в

Ma

Y

V = —(ur — wp) +——————- + g cos в sin ф

Ma

Z

w = —(vp — uq) +——————- + g cos в cos ф

Ma

hxp = (Iyy — Izz)qr + Ixz(r + pq) + l

Подпись: (4.36)Подпись: (4.37)lyyq = (Izz — Ixx)rp + Ixz(r — p ) + M
Izzr = (Ixx — Iyy) pq + Ixz( p — qr) + N
ф = p + q sin ф tan в + r cos ф tan в
в = q cos ф — r sin ф
ф = q sin ф sec в + r cos ф sec в

Using small perturbation theory, we assume that during disturbed motion, the helicopter behaviour can be described as a perturbation from the trim, written in the form

x = xe + Sx (4.38)

A fundamental assumption of linearization is that the external forces X, Y and Z and moments L, M and N can be represented as analytic functions of the disturbed motion variables and their derivatives. Taylor’s theorem for analytic functions then implies that if the force and moment functions (i. e., the aerodynamic loadings) and all its derivatives are known at any one point (the trim condition), then the behaviour of that function anywhere in its analytic range can be estimated from an expansion of the function in a series about the known point. The requirement that the aerodynamic and dynamic loads be analytic functions of the motion and control variables is generally valid, but features such as hysteresis and sharp discontinuities are examples of non-analytic behaviour where the process will break down. Linearization amounts to neglecting all except the linear terms in the expansion. The validity of linearization depends on the behaviour of the forces at small amplitude, i. e., as the motion and control disturbances become very small, the dominant effect should be a linear one. The forces can then be written in the approximate form

X = Xe + —— Su + —— Sw + ••• + —— 5во + ■■■, etc. (4.39)

d u d w дво

All six forces and moments can be expanded in this manner. The linear approximation also contains terms in the rates of change of motion and control variables with time, but we shall neglect these initially. The partial nature of the derivatives indicates that they are obtained with all the other DoFs held fixed – this is simply another manifestation of the linearity assumption. For further analysis we shall drop the perturbation notation,

hence referring to the perturbed variables by their regular characters u, v, w, etc., and write the derivatives in the form, e. g.,

д X д L

dU = Xu ’ зеГс = Lв1с ’ etc’ (4.40)

The linearized equations of motion for the full 6 DoFs, describing perturbed motion about a general trim condition, can then be written as

x – Ax = Bu(t) + f(t) (4.41)

where the additional function f(t) has been included to represent atmospheric and other disturbances. Following from eqn 4.40, the so-called system and control matrices are derived from the partial derivatives of the nonlinear function F, i. e.,

д F

д x


A=


(4.42)


Подпись: B= Подпись: д F д u Подпись: (4.43)

and

Подпись: Xu Подпись: Xu Ma Подпись: (4.46)

In fully expanded form, the system and control matrices can be written as shown in eqns 4.44 and 4.45 on page 212. In eqn 4.44 the heading angle ^ has been omitted, the direction of flight in the horizontal plane having no effect on the aerodynamic or dynamic forces and moments. The derivatives are written in semi-normalized form, i. e.,

where Ma is the aircraft mass, and

Подпись:I’ – Izz 1 Ixz N

Подпись: xx zzLp = I I _ 12 Lp + I I _ 12 Np

Подпись: (4.48)

ixxizz ly"r lxx*77

Ixx and I77 are the roll and yaw moments of inertia and Ixz is the roll/yaw product of inertia. The к constants in the inertia terms in eqn 4.44 are given by the expressions

Ixz( Izz + Ixx Iyy)

Ixx I77 — IXz


ki


(4.49)


Izz (Izz Iyy) + Ixc:

Ixx I77 — Iiz


к2


(4.50)


Ixx (Iyy – Ixx) – Ilz
Ixx Izz — Ixz


кз


(4.51)


Подпись: 212

In addition to the linearized aerodynamic forces and moment, eqn 4.44 also contains perturbational inertial, gravitational and kinematic effects linearized about the trim condition defined by

Фе, &e, Ue, , We, Pe, Qe, Re

The trim angular velocities are given in terms of the aircraft turn rate in eqns 4.29-4.31.

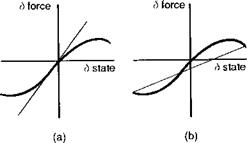
Equation 4.41 is the fundamental linearized form for describing the stability and response of small motion about a trim condition. The coefficients in the A and B matrices represent the slope of the forces and moments at the trim point reflecting the strict definition of the stability and control derivatives. Analytic differentiation of the force and moment expressions is required to deliver the exact values of the derivatives. In practice, two other methods for derivative calculation are more commonly used, leading to equivalent linearizations for finite amplitude motion. The first method is simply the numerical differencing equivalent to analytic differentiation. The forces and moments are perturbed by each of the states in turn, either one-sided or two-sided, as illustrated conceptually in Fig. 4.13; the effect of increasing the perturbation size is illustrated in the hypothetical case shown in Fig. 4.13(b), where the strong nonlinearity gives rise to a significant difference with the small perturbation case in Fig. 4.13(a). The numerical derivatives will converge to the analytic, true, values as the perturbation size reduces to zero. If there is any significant nonlinearity at small amplitude, then the slope at the trim may not give the best ‘fit’ to the force over the amplitude range of interest. Often, larger perturbation values are used to ensure the best overall linearization over the range of motion amplitude of interest in a particular application, e. g., order 1 m/s for velocities and 0.1 rad for controls, attitudes and rates. In each case it is important to estimate the degree of nonlinearity over the range of interest, as the derivative value used can have a significant effect on stability and response characteristics.

Before we examine the derivatives themselves in more detail we should refer to the second ‘numerical’ method for deriving derivative estimates. This involves a fitting or model-matching process whereby a linear model structure is used to fit the response of the nonlinear simulation model. This method can also be applied to flight data and is described under the general heading – system identification. We discussed the approach briefly in Chapter 2 and we shall give more attention to applications in Chapter 5. The system identification approach seeks to find the best overall model fit and, as such, will embody the effects of any nonlinearities and couplings into the equivalent

Fig. 4.13 Derivative calculation by backward-forward differencing: (a) small perturbation;

(b) large perturbation

derivative estimates. The states are no longer perturbed independently; instead, the nonlinear model, or test aircraft, is excited by the controls so that the aircraft responds in some ‘optimal’ manner that leads to the maximum identifiability of the derivatives. The derivatives are varied as a group until the best fit is obtained. How these estimates relate to the pure analytic and numerical equivalents will depend on a number of factors, including the degree of nonlinearity, the correlation between states in the response and the extent of the measurement noise on the test data. In this chapter we shall discuss only the analytic and numeric methods of derivative estimation, returning briefly to the global system identification approach in the applications in Chapter 5.

Balance of forces and moments

Trim is concerned with balancing the forces and moments acting on the aircraft. A typical trim is given by Table 4.1, where the various contributions to the forces and moments are given for a Lynx in a climbing turn (case уfe = —0.15 rad, Q, ae = 0.4 rad/s in Fig. 4.6(b)).

For our approximate model, many of the second-order effects have been neglected as can be seen in Table 4.1. (e. g., the X force from the empennage and X and Z force from the tail rotor, the fuselage rolling moment and tail rotor pitching moment). The inertial force components along the body axes are seen to be large, arising from the centrifugal force due to the angular motion of the aircraft. For the case shown, the trim tolerances were set at values that left the residual forces and moments as shown in the ‘Totals’ row. With zero initial value for pitch attitude and roll attitude set by eqn 4.34, convergence can usually be achieved to these levels of force within a few iterations.

Rotorspeed/torque partial trim

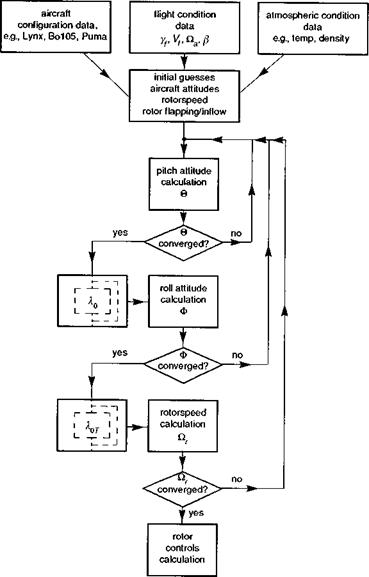
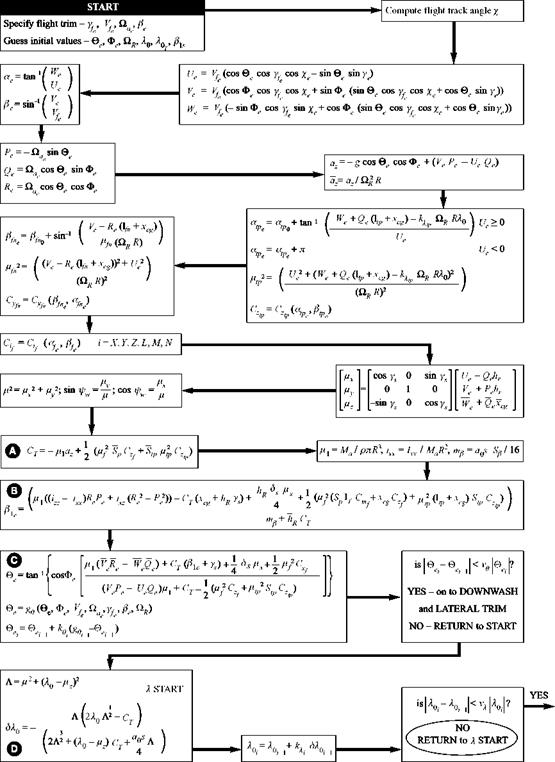
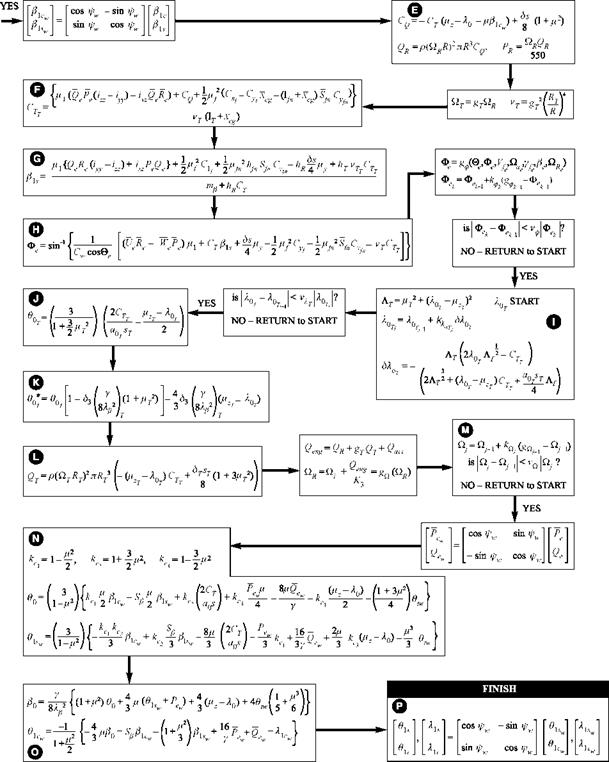
When the lateral and directional trim have converged, the tail rotor downwash is cal­culated (I), followed by the tail rotor collective (J), including the effect of the S3 pitch/flap coupling (K), and tail rotor torque (L). The total engine torque required can now be calculated, from which the rotorspeed can be updated using the droop law (M in Fig. 4.5). The rotorspeed calculation is the final stage in the iterative cycle and the whole sequential process described above must be repeated until convergence is achieved.

The remaining calculations in Fig. 4.5 determine the main rotor control angles, first in the hub/wind axes system (N, O) (see the Appendix Section 3A.4), followed by a transformation into hub axes, to give the swash plate control outputs (P). We shall return to discuss the controls to trim below in Section 4.2.6.

Table 4.1 Trim forces and moments – Lynx at 80 knots in climbing turn (yfe = —0.15 rad, Qae = 0.4 rad/s)

Component

X (N)

Y (N)

Z (N)

i(Nm)

M (Nm)

N (Nm)

Gravity

—5647.92

35035.54

23087.88

0.00

0.00

0.00

Inertial

1735.41

—38456.29

58781.41

86.49

—18.87

49.80

Rotor

5921.18

—415.68

—82034.80

—4239.18

1045.06

28827.72

Fuselage

—2008.32

0.00

225.79

0.00

—571.94

0.00

Tailplane

0.00

0.00

—60.291

0.00

—454.238

0.00

Fin

0.00

374.801

0.00

201.013

0.00

—2830.976

Tail rotor

0.00

3457.164

0.00

3951.677

0.00

—26046.555

Total

0.3556

—4.4629

—0.0136

0.0005

0.0002

—0.0098

Lateral/directional partial trim

Satisfaction of the longitudinal trim at this stage in Fig. 4.5 does not guarantee a valid trim; estimates of the lateral trim have been used and the process now has to continue with the aim of correcting both of these. Having derived a new estimate for the lateral trim, the longitudinal cycle will then need to be repeated until all six force and moment equations balance properly. But the next stage in Fig. 4.5 involves the calculation of a new value for the main rotor downwash (D in Fig. 4.5), which is itself an iterative process (see Chapter 3), and the estimation of the main rotor torque and power required (E). With these calculations performed, the tail rotor thrust can be estimated from the yawing moment equation (F), the lateral flapping corrected from the rolling moment

Fig. 4.8 Roll angle in trim: (a) Trim roll angle as a function of forward speed; (b) Trim roll angle as a function of turn rate


Подпись: (4.34)

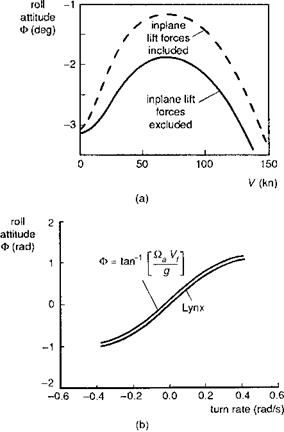
equation (G) and the new value of roll attitude derived from the sideforce equation (H). A check is now made on the convergence of the roll attitude in the same way as described for the pitch attitude, with defined convergence tolerance and damping factor. For both pitch and roll attitude, the number of iterations required, and hence the speed of convergence, depends critically on the initial guesses; clearly, the further away from the correct solution that the initial guess is, the longer will convergence take. For straight flight, setting the initial values to zero is usually adequate for fairly rapid convergence. Figure 4.8(a) shows the variation in roll attitude with forward speed for the Lynx, illustrating the powerful effect of adding the in-plane lift loads in the calculation of rotor sideforce (see Chapter 3). In turning flight, the bank angle will become large, and an initial guess based on the rules of simple circular motion is usually sufficient to ensure rapid convergence, i. e.,

Подпись: sideslip /і і Fig. 4.9 Lynx trimmed in sideslipping flight at 100 knots

Figure 4.8(b) shows how the Lynx roll attitude varies with turn rate at the 80-knot trim point. The approximate result given by eqn 4.34 is plotted for comparison and shows how accurate by this simple kinematic relationship predicts the Lynx result.

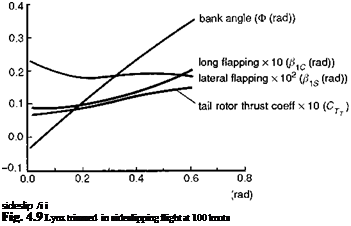
At large turn rates, in forward flight, the roll attitude iteration can become sensitive to the sign of the error between the initial guess and the correct solution. If the initial Ф results in a lateral acceleration greater than the weight component, then this simple trim procedure will diverge, no matter how much damping is added. The trim iteration will converge only when a Ф estimate greater than the solution is introduced. These details will need to be considered when a simple trim algorithm is used, but they are usually catered for in the more sophisticated nonlinear numerical search algorithms. In sideslip flight, the bank angle also varies significantly as shown in Fig. 4.9, where Lynx trim results for bank angle, flapping angles and tail rotor thrust coefficient are plotted. The bank angle is approximately linear with sideslip up to about 30°, with both aerodynamic and gravitational sideforces on the aircraft varying approximately as sin в. Longitudinal flapping increases at a greater rate than lateral flapping, as the rotor thrust is tilted further forward to compensate for the increased drag in sideslip flight.

Longitudinal partial trim

The main rotor thrust coefficient, longitudinal flapping and fuselage pitch attitude are calculated from the three longitudinal equations (A, B and C in Fig. 4.5). At this point, a comparison with the previous estimated value of pitch attitude is made; if the new estimate is close to the previous one, defined by the tolerance ve, then the partial longitudinal trim is held and the process moves on to the lateral/directional trim. If the iteration has not converged to within the tolerance, the process returns to the start and repeats until convergence is satisfied. Note that the new estimate of pitch attitude in Fig. 4.5 is given by

Подпись:Подпись: (4.33)®ei – ®ei+ kei (gi-i – ®ei_i)

where

®e — ge (®e> Фє7 Vfe 7 Yfei ^aej ee7 Qr)

In some cases the iteration can diverge away from, rather than converge towards, the true solution, and the value of the ‘damping factor’ ke can be selected to ensure convergence; the smaller (< 1) the k factor, the slower, but more stable, is the iterative process. The key calculations in this longitudinal phase of the trim algorithm are the thrust coefficient, the longitudinal disc flapping and the pitch angle itself. For straight flight, the thrust remains relatively constant; in turning manoeuvres, the inertial term in the normal acceleration az, predominantly the Ue Qe term, will result in an increased thrust. The longitudinal flapping is derived from a more complicated expression, but essentially the rotor needs to flap to balance the resultant of the aerodynamic moments from the fuselage and empennage in straight flight. If the tail rotor is canted then an additional flap component will be required. Many helicopters are designed with a

Fig. 4.4 Sequence of calculations in the trim iteration – summary

forward main rotor shaft tilt so that, at the cruise condition, the fuselage is level and the one-per-rev longitudinal flapping is zero or very small. We have already noted that the pitch angle is essentially derived from the ratio of drag to thrust, hence exhibiting a quadratic form with forward speed.

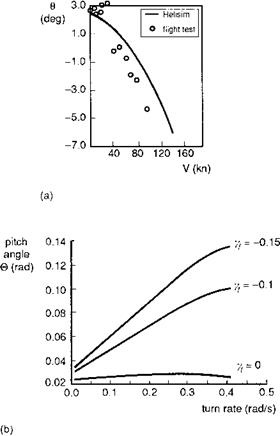
Figure 4.6(a) illustrates the variation of pitch angle with speed for HelisimBo105 together with a comparison against the DLR flight measurements. Note the hover pitch attitude of about 3°, due to the forward shaft tilt. The transition region is typically characterized by an increase in pitch angle as the main rotor downwash impinges on

Fig. 4.5 Part I – Sequence of calculations in the trim iteration – expanded form

Fig. 4.5 Part II

Fig. 4.6 Pitch angle in trim: (a) Trim pitch angle as a function of forward speed – comparison of flight and theory; (b) Trim pitch angle as a function of turn rate

the horizontal stabilizer; this effect is evident in the flight, but not well predicted by simulation. Some helicopters feature a movable horizontal stabilizer to reduce this pitch-up tendency at low speed and to maintain a level fuselage in high-speed flight. In forward flight, the comparison between flight and theory suggests a higher full-scale value of fuselage drag than that used in the simulation; this is typical of the comparison with this level of modelling, with the simulation underpredicting the fuselage nose – down pitch at high speed by as much as 2°. In non-straight flight, the trim pitch angle will vary with turn rate and flight path angle. The strongest variations occur in climbing and descending flight, and Fig. 4.6(b) illustrates the kind of effect found on Lynx in climbs. The turn rate extends out to 0.4 rad/s, corresponding to a bank angle of nearly 60° at the 80-knot condition shown. As the climb rate increases, indicated by the increasingly negative flight path angle, the pitch angle to trim rises markedly; a negative flight path angle of -0.15 rad corresponds to a climb rate of about 1200 ft/min at the 80 knots trim speed. The increased pitch attitude at this steep bank angle is required to maintain zero sideslip. If the nose were set on the horizon in this condition

then the sideslip angle would correspond to the pitch angle shown in Fig. 4.6(b); the correct pitch attitude is achieved by balancing the turn with pedals, rather than pulling back on the cyclic stick.

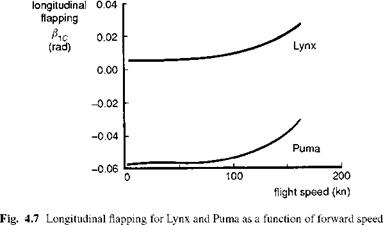
One further point on longitudinal trim relates to the differences between heli­copters with different rotor types. Since the pitch angle is determined primarily by the ratio of drag to lift on the whole vehicle, we should not expect to find any significant differences in pitch attitude to trim between hingeless and articulated rotor helicopters, but we might expect to see differences in longitudinal flapping angle. Note the previous observation that the longitudinal flapping will compensate for any residual moment on the other helicopter components. Figure 4.7 compares the longitudinal disc tilt for the Lynx and Puma across the speed range. The large difference in trim flap at hover is partly due to the different baseline centre of gravity (cg) locations for the two aircraft. The Puma cg lies practically under the hub at the fuselage reference point; the hover flap-back then almost equates to the forward shaft tilt. For the Lynx, with its aft cg lying practically on the shaft axis, the hover flap is close to zero. For both aircraft, as forward speed increases, the disc tilts further forward, implying that the residual pitch moment from both aircraft is nose up (i. e., from the horizontal stabilizer). The change in disc tilt for both aircraft is only about 1.5° across the speed range.