Category Helicopter Test and Evaluation

Airspeed

Determining the airspeed of an aircraft involves finding the difference between total, stagnation or pitot pressure and static pressure. When a helicopter moves through the atmosphere air entering the pitot probe will be brought to rest thus the pressure sensed by this probe will be its stagnation or pitot value. If the static pressure is subtracted from this pitot pressure (Pp) then the remaining dynamic pressure will be a function of the speed of flight. Thus true airspeed (V), which is a function of this dynamic pressure, is not measured directly but inferred by the action of the pitot – static system.

Подпись: P = P p Airspeed Подпись: Y/Y -1

How the indicated airspeed (Vi), that is the velocity information presented on a typical airspeed indicator (ASI), relates to the free-stream velocity or true airspeed (V) must now be considered. Air is a compressible fluid whose characteristics can be expressed in the form of the compressible Bernoulli equation which can be manipu­lated to give a relationship between stagnation pressure, static pressure (assumed to equal the ambient pressure) and true Mach number:

This equation can be further modified to yield the pressure difference sensed by the ASI. Thus:

Airspeed

Airspeed

1 + PP – P


2


M 2 =


Airspeed

Since M = Vla and a, the local speed of sound, equals —yP/p, then:

Подпись: VV=

Подпись: V= Подпись: 2У У - 1 Подпись: 1/2 P 1/2 _ p0 Подпись: 1 + Подпись: 0 Подпись: - 1/У ~) 1/2 - 1I

It is standard practice, however, to calibrate airspeed indicators at sea-level. This is achieved by assuming a sea-level standard pressure (P0 = 101 325 N/m2) in the calibration. Thus the calibrated airspeed (Vc) is given by:

The difference between the calibrated airspeed and the equivalent airspeed is called the scale altitude correction (*Vc), thus:

V1

V = = -r(Vc + *Vc) (6.6)

The size of this scale altitude correction depends on the Mach number and altitude of flight. Since most rotorcraft operations take place below 10000 ft (3000 m) and 200 kts it would be useful to determine whether a scale altitude correction need be applied during rotary wing flight data processing. At 10000 ft the International Standard Atmosphere gives a static pressure of 69 671 N/m2 and a temperature of

267.3 K. A true airspeed of 200 kts results in a Mach number of 0.313 and gives a dynamic pressure of 4903 N/m2. Thus the equivalent airspeed is 171.9 kts and the calibrated airspeed is 172.5 kts. So even for high-altitude high-speed helicopters the scale altitude correction is less than 0.4% and is therefore usually ignored. Thus Equation (6.6) becomes:

VV

V e ________ ‘ c

—CT —CT

A distinction now has to be made between the local static pressure (P„) of the air through which the rotorcraft is flying and the pressure (Ps) measured via the static vents located on the aircraft skin. Equally if the pitot pressure is measured incorrectly, as a result of sideslip for example, there will be a difference between the true total or

Подпись: V = Подпись: 2У У -1 Подпись: i/2 Подпись: 0 Подпись: i/2 Подпись: 1 + Подпись: P' - P p jj Po Подпись: У — 1/У ■) 1/2 -1

pitot pressure (Pp) and that recorded by the pitot probe (Pp). As a result of these potential error sources, the indicated airspeed, Vi, is given by:

Off-standard and design atmospheres

Although ISA provides an internationally agreed model for the atmosphere it does not take into account actual variations in pressure and temperature due to geographical or seasonal effects. This variability is engineered by means of off-standard or design atmospheres [6.8]. Within the actual atmosphere the temperature and pressure at any given altitude is highly variable and therefore off-standard atmospheres could have been produced with non-standard variations of both pressure and temperature with geopotential height. This is not in fact done as all published off-standard and design atmospheres assume an ISA variation of pressure with height and simply define differing temperature profiles. The off-standard atmospheres also assume that the lapse rate in the troposphere is the same as ISA (-0.0065 K/m) and simply specify a different sea-level temperature. Thus for example property tables for atmospheres ranging from ISA — 15°C to ISA + 15°C are available. Another approach is the so – called design atmosphere that is intended to replicate more closely the atmospheric conditions pertaining to a particular climatic region of the earth. Four standard design atmospheres have been defined: tropical maximum; temperate and arctic maximum; tropical and temperate minimum; and arctic minimum. These extremes were drawn up on the basis of conditions unlikely to be exceeded more often than one day per year.

The tropical maximum atmosphere has a sea-level temperature of 318.15 K (45°C) and uses the ISA lapse rate. The troposphere is assumed to extend up to just above 13 km (13 077 m). In the temperate and arctic maximum atmosphere the temperature starts at 303.15 K (30°C) and reduces by the ISA lapse rate until 10769 m is reached. Above this the lower stratosphere with its constant temperature is assumed to start. The tropical and temperate minimum atmosphere features a layer of constant temperature (253.15 K or — 20°C) starting at sea-level and ending at 1219 m (4000 ft). Above this a lapse rate of — 0.005 2917 K/m is assumed to apply up to 10 667 m (35 000 ft). The arctic minimum atmosphere is the most complex with three layers defined in the troposphere. Between sea-level and 1524 m (5000 ft) the temperature increases from 223.15 K ( —50°C) at lapse rate of 0.0097425 K/m (approximately 3°/ 1000 ft). In the next layer ending at 3047 m (10000 ft) the temperature is assumed to be constant at 238.15 K ( —35°C). Above this and up to the tropopause, set at 10 667 m (35 000 ft), a lapse rate of — 0.004 5932 K/m (1.4°/1000 ft) applies.

6.2.2 Measurement of air data

6.2.2.1 Altitude

As implied above the measurement of altitude requires static pressure information. This is obtained from a port located on the outer skin of an aircraft. The static pressure is converted into pressure altitude by the altimeter using a calibration law based on Equation (6.3). Altimeters feature a sub-scale marked in milli-bars (mb), or inches of mercury, which the pilot can adjust thereby altering the meaning of the height information presented on the altimeter. Since the pressure altitude (Hp) of a point in any atmosphere is defined as the geopotential height in the Standard Atmosphere giving the same pressure, it follows that an altimeter will give a pressure altitude reading provided it has been set to show zero at a pressure equal to P0 (1013.25 mb). In flight testing references to height are usually in terms of pressure altitude and it is therefore very common to set the altimeter sub-scale to ‘1013’ before commencing data gathering.

An altitude that is rarely displayed but often calculated is density altitude (HD). This is the geopotential height in a standard atmosphere with the same density as that being experienced by the air vehicle. Since the forces acting on a wing, blade or body are a direct function of air density the behaviour of a helicopter will depend on its density altitude.

Helicopter Systems

6.1 INTRODUCTION

Before discussing the various methods that are employed in the testing of the major systems found in rotorcraft (see Chapter 7) it is necessary to explore the underlying theory and technologies that are involved. This will not only set the testing in context but will help to indicate whether the test techniques themselves are dependent on, or affected by, the actual system under test. In this chapter three major systems are described with which the pilot has an almost continuous interface through routine flight operations: air data systems; engine control and rotor governing systems; and flight control systems (including AFCS). Although the assessment of the mechanical characteristics of powered flight control systems has already been covered technical details of these systems are covered in this chapter for completeness.

6.2 AIR DATA SYSTEMS

6.2.1 Standard atmospheres

The definition of standard atmospheres dates back to the 1920s in the United States and Europe. They were developed in response to a growing need for standardization in aircraft instrumentation and performance measurement. The US atmosphere was developed by the National Advisory Committee on Aeronautics (NACA) [6.1], while the European atmosphere was produced by the International Commission on Aerial Navigation (ICAN) [6.2]. The slight differences between these two independent stand­ards were reconciled and international uniformity achieved by the adoption in 1952 of a new standard. This international standard atmosphere was sponsored by the International Civil Aviation Organization (ICAO) and was defined for altitudes up to 20 km [6.3]. Later work by the US Committee on the Extension of the Standard Atmosphere (COESA), based on data from rockets and satellites, extended this atmosphere to 700 km by 1962 [6.4]. This atmosphere was adopted by ICAO [6.5] as a new standard for altitudes up to 32 km superseding the 1952 ICAO atmosphere.

In 1975 the International Organization for Standardization (ISO) generated a standard atmosphere which covers heights up to 70 km and is based in part on the ICAO standard [6.6]. For heights below 50 km this atmosphere is referred to as the International Standard Atmosphere (ISA), while for heights between 50 km and 70 km it is termed the ‘Interim Standard Atmosphere’. The World Meteorological Organization (WMO) Standard Atmosphere, which is defined between — 2 km and 32 km, is identical to the ISO standard.

6.2.1.1 The atmospheric modelч

The atmospheric model described below has been widely adopted and forms the background to the International Standard Atmosphere. The atmosphere is assumed to consist of a perfect gas with local values of pressure, density and temperature related by the state equation:

P = pRT

The atmosphere is further assumed to be in static equilibrium with respect to the earth such that the following hydrostatic analysis can be made. Consider a small element within the atmosphere of constant cross-sectional area (SA) and height (SZ) centred at some point. Assume that the pressure acting on the base of the cylinder is P and this changes to P + SP at the top. The mass of fluid contained in the cylinder will be equal to the product of its density and volume (p SA SZ) which will generate a downwards force (its weight) equal to mass x the local value of acceleration due to gravity (g). Since the cylinder is in equilibrium:

(P + SP)SA + pg SA SZ – P SZ = 0 SP + pg SZ = 0

Thus:

SZ =-Pg (6Л)

Equation (6.1) provides a relationship between pressure, density and geometric (or tape-line) height. When considering the pressure distribution in the atmosphere it is convenient to use geopotential height (H), which is based on a constant value for the acceleration due to gravity. The geopotential height is the geometric height in a uniform gravitational field that gives the same potential energy as exists at the point under consideration in the actual, variable gravity field. Now the work done in raising a body of mass (m) from one geopotential surface to a higher surface is equal to the potential energy that the body has at the higher surface. If the surfaces are separated by a distance Z then:

Подпись:g dZ

0

Подпись: g dZ 0 H = —

gsl

This equation relates the geopotential height in a uniform gravitational field, in which the acceleration due to gravity is taken as equal to the sea-level value (gsl), to the actual variation of g with Z. In atmospheric modelling and aircraft performance work gsl is taken as the standard value g0 (9.70665 m/s2) and the resulting measurement of H is called the standard geopotential height. The accepted value of g0 corresponds to a geographic latitude of 45.5425° [6.7].

A relationship between standard geopotential height and pressure can be obtained

by combining the above equations and by assuming that the molecular composition of air is constant over the altitudes of interest. So:

rz

dP P. g0H = g dZ

dZ =-pg = _gRT and Jo

g0 dH = g dZ

Hence:

Подпись: (6.2)dP = _ _P_

dH = _g RT

A particular atmospheric model is defined by substituting into Equation (6.2) a given variation of temperature with height and then deducing the corresponding variation of pressure with height. Standard atmospheres consist of layers in which the temperature is either constant or varies linearly with altitude such that:

T = Tb + a(H _ Hb)

Подпись: dP P : Подпись: g0 RTb Helicopter Systems

where Tb is the temperature at height Hb and a is the temperature gradient, or lapse rate, for heights between Hb and Hb + 1. Thus for the standard atmospheres under consideration, a will either be zero or a constant. Consider a layer where the lapse rate is zero and the temperature is therefore constant at Tb:

lnPb =_Й(H_ Hb)

Now consider a layer where the lapse rate is constant (dT/dH = a) and the pressure is given by Equation (6.2):

dP =_g0 [‘J dT

Подпись: aR T >Ti P

ln P = _aRln T

Therefore:

Подпись:PT

PT

6.2.1.2 The International Standard Atmosphere

The first two layers of the International Standard Atmosphere are called the troposphere and the lower stratosphere. In the troposphere, which extends up to 11 km, the temperature falls linearly with a lapse rate of _ 0.0065 K/m (close to 2°/1000 ft) from a sea-level value (T0) of 288.15 K. Above the tropopause, in the lower stratosphere, the air temperature is constant at 216.65 K. With the sea-level ambient pressure (P0) defined at 101 325 N/m2 it is possible to generate specific equations relating pressure to geopotential height. Since most helicopters do not routinely operate above 10 000 ft
(3000 m) we need only consider relationships for the troposphere. Since air at 288.15 K has a gas constant equal to 287.05 J/kg/K and:

Подпись: aKP

P T0

Подпись: g0laRP – P (‘+ T0 H

Then substituting for the defined constants into this equation gives the following for H:

P – 101 325(1 – 2.2558 x 10 ~5H)52559 H in metres’)

} (6.3)

P – 101325(1 – 6.8756 x 10 ~6H)5 2559 hin feet J

Note that H can be replaced by Hp (the pressure altitude) as both the sea-level ISA constants and the ISA lapse rate have been used for the formulation of the equations.

Presentation and interpretation of results

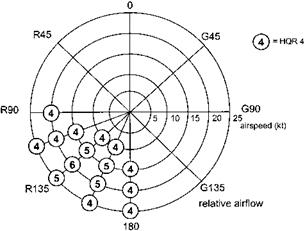
Results from the pace vehicle tests will show the trimmed flight control positions for all the relative wind velocities tested. Particularly important results will be any indications of controls approaching limits. The apparent static stability of the aircraft can also be documented from these tests together with details of the pitch and roll attitudes adopted and vibrations experienced. The results must be used with care, however, when considering the handling qualities of the aircraft hovering with winds of different velocities. This is due mainly to the very different visual cues between a ground-referenced hover and formation with a vehicle travelling over the ground at speed. In addition stronger winds are always accompanied by some degree of turbulence which is not replicated by the pace vehicle tests. So if testing using a pace vehicle has been used to generate HQR data like that shown in Fig. 5.27 it must be considered as only a indication of a possible critical azimuth. This would have to be confirmed by appropriate testing in natural winds.

5.7.2 Ride characteristics

The ride characteristics of a helicopter are those qualities that influence the subjective opinion given by the occupants on comfort and pilot workload in turbulence. The characteristics are divided into two distinct areas; gust response and ride quality.

Gust response is the characteristic that governs the way an aircraft behaves in turbulence from the point of view of the pilot. The two factors of which it comprises are the tendency of the aircraft to be displaced from the set flight condition by gusts and the actions needed by the pilot to regain the condition. The type of rotor system, inertia, stability characteristics, and AFCS will all affect the magnitude of any reaction to gusts. The control response of the helicopter will determine the inputs required by the pilot to counter disturbances. In essence gust response is the change in pilot workload to maintain the aircraft attitude in turbulence.

image140

Fig. 5.28 Pace vehicle operations.

Whilst gust response can only be determined by the pilot, ride quality can be determined by any of the occupants. Ride quality is a measure of the comfort or otherwise that the crew and passengers experience in flight. It is clearly closely linked to the same factors that affect gust response (less control response), together with vibration. Ride characteristics as a whole can have a significant effect on the perfor­mance of the crew over a protracted period.

5.7.3 Mission task elements

The concept of mission task elements (MTEs) was introduced by ADS-33 as a means of proving that the designed-in characteristics of a rotorcraft actually provide Level 1 handling qualities when conducting role-relevant tasks. The definition of MTEs and of the associated tolerances is the responsibility of the procuring agency, and the choice depends on the intended role of the aircraft. ADS-33E [5.2] contains a number of definitions of MTEs which are designated as flight test manoeuvres. Although these all have role relevance to combat rotorcraft, they are specifically designed to facilitate testing against the quantitative (dynamic response) criteria of the Standard. ADS-33E offers precise definitions of all the MTEs together with default task tolerances.

The specification document divides the MTEs into three categories depending on the visual conditions under which the task will be performed. These categories are tasks in a Good Visual Environment (GVE); tasks in a Degraded Visual Environment (DVE); and tasks in Instrument Meteorological Conditions (IMC). Each task is further categorized by the level of agility required by a rotorcraft to accomplish it: these agility levels are Limited, Moderate, Aggressive, and Target Acquisition and Tracking. Guidance is given within the document on which tasks are appropriate for use with aircraft in the Attack, Scout, Utility, or Cargo roles. Some MTEs are also indicated as suitable for externally slung load operations. The MTEs included in ADS – 33E are mainly concerned with battlefield helicopter manoeuvres but research is underway into developing MTEs for other roles. For example, a deck-landing task is being developed which requires the pilot to conduct a lateral translation and then to follow a target which moves up and down a pole. This brings out the point that an MTE does not have to be totally realistic in comparison to an operational task, it merely needs to require a similar aircraft response that will uncover any deficiencies in handling qualities.

ADS-33E gives guidance on how the MTEs should be flown and used. Each MTE should be flown by a minimum of three pilots with the HQRs awarded being averaged. Pilots are allowed to practise each manoeuvre as many times as necessary to eliminate any learning curve. The task performance can be judged by either the crew or outside observers; in both cases the test pilot should be advised of the accuracy achieved before the HQR is awarded. The division of responsibility for monitoring task performance between crew members should be defined and briefed prior to the tests. The set MTEs listed in the Standard are intended to be flown at the same level of aggressiveness relative to the capabilities of each rotorcraft. In other words the dimensions of the course will vary depending on the characteristics of the aircraft under test. It may also be necessary to change the course layout to take into account the wind on the test day.

MTEs have been employed effectively during handling qualities assessments of aircraft which predate ADS-33E. In such cases it is unrealistic to expect the aircraft to display level one qualities consistently but by using these tasks it is possible to identify deficiencies quickly. Thus knowledge of the standard MTEs and the ability to devise new ones is an essential skill of test personnel.

Pace vehicle operations

5.7.3.1 Safety considerations

Pace vehicle operations are used extensively at test establishments to test helicopters with relative winds from all directions and a variety of strengths. The operations are relatively straightforward but there are a number of safety considerations that are addressed to ensure that all risks are reduced as far as possible. The operations start with a face-to-face brief between the aircraft crew and the vehicle crew. At this brief the area of operations is defined, including the limits of the area in the form of end markers. As the aircraft may well not be pointing in the direction of its ground track it can be difficult for the pilot to know when he or she has reached the end of the area. When the aircraft reaches an end marker the vehicle crew makes the calls, ‘approaching end marker’ and ‘at end marker’ indicating that the test should be halted. Usually the operations are conducted along a runway as this provides a good surface for the vehicle and an obstacle-free environment for the aircraft. As the aircraft needs to move to different positions around the vehicle when conducting testing it is necessary to reposition the vehicle to different sides of the runway to ensure that the aircraft remains over a clear area. The instructions that will be used to achieve this are briefed. The final call to be stipulated at the brief is the ‘break-off ’ call which the pace vehicle crew will use if for any reason they require the test to be stopped and the aircraft to move away.

Also at the brief the minimum spacing between the vehicle and the aircraft is stipulated. This is usually a minimum distance of two rotor diameters for safety reasons. In practice the actual spacing used is often greater than this to prevent the helicopter downwash from affecting the vehicle anemometer. The ‘golden rule’ for safety in these operations is for the pilot to keep the vehicle in clear sight at all times to prevent a collision. This means that the aircraft will not only have to turn to place the relative airflow at the required azimuth but also will have to move to a new position in relation to the vehicle to ensure that it can be seen clearly. When each test run is complete the aircraft moves well away from the operating area to allow the vehicle to reposition safely. Before starting testing, practice recoveries to the hover from high speed rearwards flight are made; this is particularly important if the aircraft shows a marked nose-down tuck on recovery due to the airflow effect on the horizontal stabilizer.

5.7.3.2 Test technique

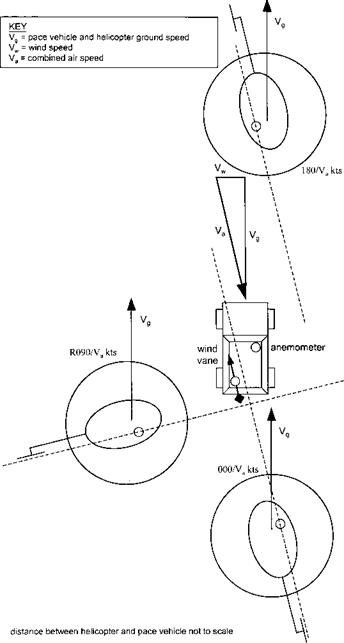
Once the pace vehicle has achieved the groundspeed which gives the required test airspeed, the operator calls ‘on condition’. The pilot then positions the aircraft behind the vehicle and lines up with the roof-mounted wind vane; this gives the zero azimuth relative wind and provides the pilot with the heading from which all other relative wind azimuths are calculated. Once the data has been collected the helicopter is turned to achieve the next required wind azimuth, repositioning as necessary to keep the vehicle in sight, see Fig. 5.28. At each test point the pilot ensures that the aircraft is keeping a good formation position with the vehicle before the data is taken. At speeds at or close to the lateral or rearwards limits of the aircraft care is needed not to exceed these limits when repositioning. The technique used is to turn the aircraft into the relative airflow, reposition as necessary, then turn carefully to achieve the required wind azimuth. Making the calculation of the aircraft heading needed to achieve a particular azimuth can be difficult. To ease this process the co-pilot/FTE will often use a swivelling compass rose mounted on a board that has azimuths marked. The aircraft heading when aligned with the wind vane is set against the zero azimuth mark. The aircraft heading needed to generate any wind azimuth can then be read off directly.

Low-speed testing

Since helicopters are typically slower, less reliable and more expensive to operate than aeroplanes, their procurement only makes sense if the mission requires operations in

image139

Fig. 5.27 HQRs for out-of-wing hovering. G = green winds (wind from right), R = red winds (wind from left).

the hover and at low speed. Thus, whatever the role of a helicopter, it will need to have satisfactory handling qualities in the low-speed regime. The definition of low speed is not consistent throughout the flight test world but it is normally taken to be from zero to 40 or 45 knots airspeed/groundspeed. Any full flight test programme will need to include qualitative tests of the manoeuvres that take place in this low-speed area of flight.

Hovering is clearly one of the most important manoeuvres to evaluate as helicopters may be required to hover for extensive periods and often with considerable accuracy due to the proximity of obstacles. Testing examines the workload to control plan position, heading and height. As well as evaluating hovering in zero wind, tests include operations in winds up to the airspeed limits from all azimuths. Although a pace vehicle can be used to generate relative winds it cannot be used to determine handling qualities in the hover due to the difference in visual cues and in the level of turbulence present. For most purposes it is only necessary to evaluate relative winds from along the longitudinal and lateral axes and the directions at 45° to these axes. In addition to the consideration of pilot workload, other factors such as the vibration level and roll angle at each wind azimuth are evaluated. Not only will these factors affect crew comfort but they may also have implications for on-board systems. A widely deployed missile system which is fitted to a number of battlefield helicopters is a good case in point. The missile will not launch at bank angles above 5° which can be below the aircraft roll angle required to maintain position in the hover with some relative winds. In addition aircraft fitted with winches often have bank angle limitations for operations in the hover. Figure 5.27 shows an example of how to present HQR data for hovering; vibration ratings (VARs) can be presented in a similar way. The stability characteristics of the aircraft and the FCMC will be the major factors that affect hovering characteristics.

Hover turns are made up to the maximum permitted rate starting in calm conditions before moving on to tests in winds up to the lateral and rearwards envelope limits. Tests investigate the ease of controlling yaw rate as well as stopping the turn on selected headings. The accuracy of height and plan position maintenance during the manoeuvre is checked. Torque spikes when initiating and stopping turns with the ‘power’ pedal are a common problem with responsive governor systems: transient droop may be an equivalent problem with less responsive governors. At high yaw rates some aircraft demonstrate significant cross-coupled responses. Other aircraft have suffered from loss of tail rotor effectiveness due to the tail rotor entering the vortex­ring state during high rate turns which has led to accidents or damage to the transmission when arresting the turn.

There are a number of different manoeuvres which the helicopter pilot can use to leave and return to the hover. These transitions can be longitudinal (normal approach and quickstop); lateral (sidestep); and vertical (bob-up/bob-down and towering transi­tion). In each case the manoeuvre can be flown with different levels of aggression by varying the maximum bank or pitch angle used or varying the time to reach the maximum angle. When flown with high levels of aggression these manoeuvres will be affected by any deficiencies in the field of view; control response; cross-coupling and engine and rotor governing system. Tests of these manoeuvres are conducted in a variety of wind conditions with incrementally increasing levels of aggression up to role-relevant values.

Assessing take-offs is relatively straightforward and is mainly concerned with evaluating the control activity required to go from the stationary, on-surface condition to either the hover or forward flight. Large control inputs may not be a problem in good visual conditions but may have more serious implications at other times such as when using night vision goggles (NVG). The available tail clearance to absorb pitching motions on lift-off is one area that is investigated. For running take-offs a particular point of concern is any tendency of the aircraft to pitch nose down once airborne due to changes in the main rotor downwash on the horizontal stabilizer.

Landings are normally split into vertical and running landings. In both cases the ability of the undercarriage to absorb vertical rates that are appropriate for the role has to be proved. Ministry of Defence Standard 00-970 [5.1] defines a minimum vertical velocity of 2 m/s that the undercarriage must be capable of absorbing during landings on flat, non-moving surfaces. Higher velocities are specified for deck landings that depend on the maximum intended sea state. Vertical landings are essentially just an extension of hovering with the added complication that differing downwash effects can cause uncommanded aircraft disturbances. Assessment is also made of the behaviour of the aircraft when in partial contact with the surface to assess the likelihood of ground resonance occurring. Running landings have more considerations such as tail clearance during the deceleration; heading maintenance during the landing run; tendency of the undercarriage to dig into the surface and the effectiveness of the brakes. For skid equipped aircraft the effects of reducing collective pitch during the ground run are investigated cautiously as it can lead to the helicopter ‘nosing over’.

Sloping ground operations are important for tactical rotorcraft where the choice of landing site may be very limited. Particular considerations are the control margins available and any tendency towards dynamic rollover. Dynamic rollover is a phenom­enon where beyond a certain angle of bank when in contact with the ground the rotorcraft develops a rolling moment that exceeds the corrective moment that the pilot is able to generate with the cyclic and the collective. This can lead to the aircraft rolling on to its side very rapidly. It is necessary to separate workload due to the relative wind and that due to the slope by performing a landing on the same heading but on level ground. Similarly the effect of stronger winds on control margins can be predicted if the difference in displacement with increasing wind strength is known from pace vehicle tests. Ideally, the tests should be flown on surveyed slopes with a variety of surface conditions.

If required ground taxying is tested on a variety of surfaces to assess turning circles and aircraft stability on the ground. Aircraft with high CGs and relatively narrow undercarriage tracks have been known to roll over even with full lateral cyclic applied when turning through a strong wind. The ease of operation of devices such as wheel locks and steerable nose or tail wheels is also evaluated. Ground taxying tests up to the maximum permitted speed are conducted prior to attempting evaluations of running take-offs and landings.

MISSION TASK METHODS

Test personnel have a large range of tools to document and analyze aircraft character­istics but it should always be borne in mind that it is the performance of the aircraft in the mission that is the most important part of any test programme. It is only by using a test pilot with recent experience of the role and by flying representative tasks that all deficiencies can be identified. This requires the test programme to include sufficient role tasks to be flown in an environment which is as close as possible to the conditions that will be found in service. Good test teams have always understood this concept and in recent years attempts have been made to formalize the process.

5.7.1 Handling qualities rating scales

One of the main functions of the test pilot is to report his or her opinion of the handling qualities of the aircraft after a flight. It is this opinion which will often lead to major decisions being made about a programme and, being an opinion, it is of course entirely subjective. As flight test became a more disciplined science in the period following World War Two it became apparent that some way had to be found to standardize the way in which pilots reported their qualitative results. This was needed so that comparisons could be made between the opinions of different pilots. A number of different approaches were made to try to solve this problem such as the Cornell Aeronautical Laboratory and original Cooper scales. Problems were found with these early attempts and in 1966 Messrs Cooper and Harper presented a joint paper [5.7] to the Flight Mechanics panel of AGARD in which they advocated a ten-point handling qualities rating scale. This Cooper-Harper HQR scale, as it became known, has found wide acceptance in the flight test community and is now the standard way for test pilots to report their opinions of handling qualities. Although the HQR scale is the most widely used type of scale in test flying it is not the only one. Other scales have arisen to quantify a variety of subjects such as workload (the RAE Bedford workload scale); and precise manoeuvres (the A&AEE deck landing scale).

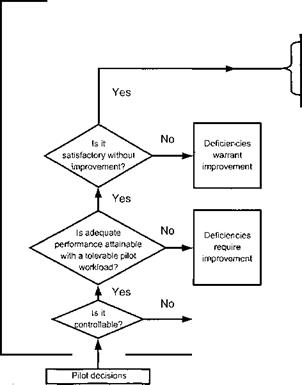
The Cooper-Harper scale is shown in Fig. 5.26 and although it is a relatively straightforward concept it requires a considerable degree of care and skill to apply correctly. The test pilot is presented with three dichotomous questions which when answered lead to four possible categories of quality. Three of these categories are further divided into sub-categories, each of which is awarded a numerical value leading to a total of ten possible HQR values. In essence the HQR scale quantifies the amount of physical or mental compensation that a pilot has to expend in performing a defined task to a defined standard. In this context the term compensation is taken to mean the additional pilot workload required to complete a task, over and above that which would be required when flying an aircraft with excellent qualities. The important phrase here is additional pilot workload; to complete any task will require a certain level of workload even with optimum handling qualities. Cooper and Harper make this clear by stating that the total workload is comprised of the workload due to compensation for aircraft deficiencies plus the workload due to the task itself. The scale was not intended to be linear and therefore it is vital that the pilot enters the scale at the correct point to answer the questions and does not try to shortcut the process by simply choosing a number. This flow chart style of presentation, as shown

Подпись:Подпись:Подпись:Подпись:image137Подпись:Подпись:image138Aircraft Demands on the pilot in

characteristics selected task or required operation

Pilot compensation not a factor for desired performance

Pilot compensation not a factor for desired performance

Подпись: Improvement Major deficiences Control will be lost during some portion in mandatory of required operation Подпись: Stability and Control Testing 221

Minimal pilot compensation required for desired performance

1

r

Minor but annoying

Desired performance requires moderate

A

deficiencies

pilot compensation

J

1

Moderately objectionable

Adequate performance requires considerable

5

1

1

deficiencies

pilot compensation

1

Very objectionable but

Adequate performance requires extensive

6

tolerable deficiencies

pilot compensation

Major deficiencies

Adequate performance not attainable with maximum pilot compensation. Controllability not in question

Major deficiencies

Considerable pilot compensation is required for control

8

Major deficiencies

Intense pilot compensation is required for control

9

in Fig. 5.26, reinforces this point. Correct use of the scale depends on the evaluator understanding the precise meaning of certain key words which will be explained.

As the HQR is awarded for performing a task it is essential that the task is chosen with care to be relevant to the role of the aircraft. It must be a flying task, of relatively restricted scope, which the pilot must complete in pursuance of the mission. The choice of task is an important stage in the process of assigning an HQR and needs careful consideration. The task must be a distinct phase of flight that can be allocated a definable level of performance. Examples of tasks could be capturing an angle of bank or main­taining a set aircraft attitude and heading. Where a more complex task is being evaluated it may be divided into sub-tasks each of which can be allocated a rating. The highest numerical rating awarded for a sub-task then defines the rating for the task as a whole.

Particularly important terms are workload and performance. Performance can be thought of as the degree of accuracy required from the rotorcraft to execute a task, for example, maintaining the aircraft heading within 10° of the initial value. As the accuracy required increases, a corresponding increase in pilot workload will be needed. This workload can be physical, in terms of control activity and/or mental, in terms of concentration. The workload required to perform the task must be considered in the context of the mission and must take into account the amount of spare mental or physical capacity the pilot would have under operational conditions. This is an important point which is sometimes overlooked. By employing an unrealistically high workload pilots can often achieve very high standards of task performance despite poor aircraft handling qualities. It may be useful to artificially reduce the pilot’s capacity for aircraft stabilization in order to simulate the demands of the mission.

Since workload will depend on the amount of precision required, it is clearly vital that not only the task itself is defined precisely but also the level of performance should be stated, for example, maintaining airspeed during a ground controlled approach to within 5 knots. This task performance is often termed the tolerance and is defined for two levels; desired performance and adequate performance. Performing the task to desired performance indicates that the pilot has been able to achieve the accuracy that he or she would wish for, whereas adequate performance means that a level of accuracy has been achieved which, although below the standard the pilot desires, is sufficient to complete the task. Deciding on the tolerances is probably the most difficult aspect of assigning HQRs and must be approached with care. The tolerance must be applicable to the role and the test pilot must be able to justify the resulting level of accuracy. For example, a desired tolerance to maintain airspeed to within 2 knots during transit flight could probably be achieved but there is unlikely to be any operational justification in setting such a high standard of performance. Setting a very wide tolerance that is unrepresentative of the role requirements would be equally incorrect.

The Cooper-Harper scale allows the performance associated with a particular task to be placed into one of four categories: [11]

• Inadequate performance. This third category is defined by the failure to achieve even the adequate performance despite the pilot workload being increased to the maximum tolerable level in an effort to compensate for handling deficiencies. An improvement in handling qualities is required (HQR 6-9).

• Loss of control. The final category allows for the possibility of loss of control during the execution of a task. An improvement in handling qualities is obviously mandatory (HQR 10).

A term which is often used in specification documents such as 00-970 [5.1] and ADS-33E [5.2] is the handling qualities level. Handling qualities Level 1 encompasses HQR 1-3, Level 2 takes in HQR 4-6 and Level 3 is for HQR 7-9. There is also a direct relationship between the HQR awarded and the pilot’s conclusion on the characteristic under investigation. Thus a satisfactory conclusion could not be sup­ported by an HQR 4 or greater. The question of whether or not half ratings can be awarded is often debated. Cooper and Harper themselves did not disallow this in their original paper. In many test establishments, however, the practice is discouraged at least for aircraft release purposes. One common exception is the use of an HQR 41. This is often permitted to address the large gap between the desired performance with moderate compensation of an HQR 3 and the adequate performance with considerable compensation of an HQR 5. Of course HQR 31 and 61 are never allowed as they sit on the boundaries of the handling qualities levels.

A special case arises when considering failure modes. When applying a rating to an aircraft’s handling qualities following a failure, the likely operational requirement has to be defined. Thus if the aircraft will be required to continue with its mission then an HQR should be applied in the normal way. However, if the aircraft will only be required to return to base and perform a landing then more relaxed tolerances can be applied. It may be that a significant pilot workload results following a failure, for example, landing in manual control after a loss of hydraulic pressure. In this case an HQR 5 might be awarded which would normally be associated with an unsatisfactory conclusion. However, the test pilot might conclude that the aircraft was satisfactory because the high workload might only be required for a short period when full attention can be given to completing the task. In this special circumstance it is normal practice to caveat the conclusion with the phrase, for degraded operations.

The handling qualities of the aircraft will clearly affect task performance but the skill of the pilot will also affect the outcome. To take into account the position of the test pilot Cooper and Harper expected that he would evaluate handling qualities with respect to his understanding of the lower degree of skill and training existent in a group of operational pilots. Thus the test pilot must analyze his workload in the context of a less skilled or less experienced pilot. As part of this process he or she must decide on how many attempts at the task will be undertaken before awarding an HQR. It would be unrealistic to award a rating on the first attempt but excessive practise runs can make it more difficult to analyze the compensation required. The compensation is usually most evident in the first few attempts.

HQRs are used in two main ways: either as data for control law research or as data to support conclusions in an evaluation report. An example of the latter is shown in Table 5.3. In research work a pool of pilots may be asked to attempt a task or set of tasks and the HQRs awarded can then be analyzed. This may involve averaging the numerical HQRs to determine the handling qualities level. Since, as already mentioned,

Table 5.3 Relationship between HQRs and other assessment criteria.

Cooper – Harper Task

Performance

HQR

Workload

HQ

Level

Conclusion

Desirable

1

not a factor to

minimal

1

Satisfactory

2

3

4

moderate

to

extensive

2

Unsatisfactory

Adequate

5

6

Inadequate

7

extensive

to

intense

3

Unacceptable

8

9

Loss of control

10

uncontrollable

the Cooper-Harper scale is not a linear measure of compensation, a certain amount of care is needed when conducting any arithmetical operations with the results. For example, an HQR 2 awarded by one pilot cannot be summed with an HQR 6 from another pilot to arrive at an HQR 4. A wide discrepancy in results like this might indicate a problem with the way the research trial had been constructed.

When using HQRs as evidence to support conclusions in evaluation reports it is vital to define the task precisely and to state the performance tolerance used. The test pilot should then use an appropriate adjective to describe the workload and should describe the amount of compensation required in terms of actual control activity and/ or mental effort. Finally the rating number is stated. The following is an example of a complete HQR statement used as supporting data for a conclusion: Maintaining heading +5 degrees during level flight at 100 KIAS was difficult requiring constant yaw pedal inputs of up to 3 cm, once per second (HQR 5). It should be remembered that the pilot should reach his conclusion on the aircraft in the role; in other words the rating awarded should not drive the conclusion. Thus the test pilot should decide on the conclusion using his or her experience of the role and then check the appropriateness of the supporting HQR. If the rating is not appropriate then the task should be repeated or the tolerances reappraised. The frequency of use of HQRs in a report is a matter of judgement. They are an extremely concise and useful means of describing and quantifying the aircraft’s handling characteristics, however their use is often restricted to avoid loss of impact and repetitiveness.

Computer generated sweeps

Some test agencies advocate the use of automatic input devices that can generate ‘pure’ sinusoidal frequency sweeps by injecting inputs directly into the pitch change linkage actuators. This method generally makes analysis easier and gives a degree of repeatability. However since the input and response will be subject to spectral analysis, the exact shape and size of input is not critical. Indeed, the analysis of an ‘imperfect’ frequency sweep may yield information on frequencies higher than the nominal maximum due to discontinuities in the input. Additionally, computer generated sweeps do not account for the effects caused by the mechanical flying controls and the man – machine interface such as biomechanical feedback caused by vibration through the pilot’s limbs. It is vital that such effects are identified so that appropriate ‘notch’ filters can be included in the flight control circuit if necessary. Additionally, sweep data that has not been generated by a pilot is rarely acceptable for handling qualities studies or demonstration of compliance. Finally, a pilot is able to adapt his control inputs in an intelligent way to account for drift from the trim condition.

5.6.1 Data analysis and specification compliance

Having described a suitable method for gathering frequency response data in-flight, precisely how such information is used for checking specification compliance now

image135

Fig. 5.24 Frequency response of a phase limited system.


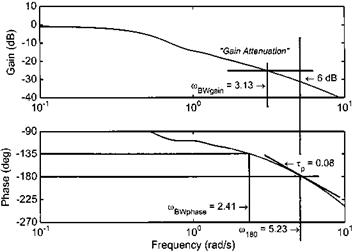
needs to be considered. Since most of the requirements concern the manner in which phase lag varies with frequency, a start will be made there. Typical of all helicopters is the tendency for the output (aircraft attitude) to lag the input (control deflection) by larger amounts as the input frequency is increased. The requirement on the pilot to apply larger amounts of lead to overcome this increasing phase lag, or shift, leads to an increase in workload. Ultimately at high input frequencies, the aircraft response will reach 180° out of phase (m180) and will be neutrally stable [5.4] with control deflections required in the same direction as any disturbances in order to counter them. Although it is possible in such circumstances for an experienced pilot to maintain control, there will almost certainly be excessive workload that will undoubtedly prejudice mission effectiveness. For adequate handling qualities, it is necessary to avoid this situation by ensuring that the bandwidth of the aircraft exceeds that required for the mission. When gathering data for frequency response analysis, as indicated above, the rotorcraft is essentially operated in an open-loop manner that is quite different to the closed-loop nature of all high-gain mission tasks. The definition of phase-limited bandwidth considers this fact by specifying a 45° phase margin that allows for the neuro-muscular lag associated with a pilot operating with full attention but less than maximum effort [5.5]. Thus, the phase-limited bandwidth (fflBWphase) is simply defined as the frequency at which the phase lag reaches 135° (2.41 rad/s in Fig. 5.24).

Подпись: _ A'2m180 p _ 57.3(2m180) Computer generated sweeps

In researching the use of bandwidth as a general criterion, it was discovered that pilots were also sensitive to the rate at which phase changed in the region of the bandwidth frequency and the point of neutral stability. Commensurate with the simple definition of bandwidth the phase rate, or phase delay, uses a two-point approximation of the phase curve between m180 and 2m180, thereby assuming a linear roll-off in phase throughout this critical region. Thus from Fig. 5.24:

image136

Fig. 5.25 Frequency response of a gain limited system.

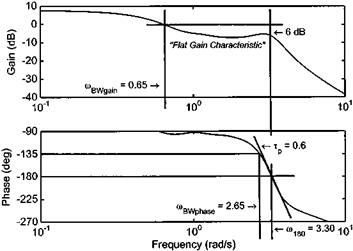
When operating unaugmented helicopters or ones fitted with a rate command system, pilot inputs are required to provide attitude maintenance, especially in gusty conditions. This is different to attitude command/attitude hold (ACAH) systems, where the pilot can reduce his own personal gain and rely on the inherent attitude­keeping features of the rotorcraft. Consequently, research using rate or rate command/ attitude hold (RCAH) response types highlighted the need for a further definition of bandwidth as it was found that the variation in gain with frequency had a significant impact on the handling qualities ratings awarded [5.5]. Handling problems were found when pilots attempted to operate helicopters with high phase delay and flat gain characteristics in the region of the phase limited bandwidth. When required to fly more aggressively or with greater precision, pilots have a natural tendency to increase both the size and frequency of their inputs as they attempt to ‘tighten’ control of the helicopter. This tendency is more evident if the phase delay is large since the helicopter will suddenly appear to be ‘getting away’ from the pilot as the bandwidth frequency is approached. A further complication arises if the gain characteristics are flat rather than being attenuated. With gain attenuation, the tendency of the pilot to increase input magnitude is mitigated by a reducing output/input ratio, see Fig. 5.24. However, if the gain characteristic is flat then as the pilot makes larger inputs he gets an unchanged or even a larger output which coupled with a large phase lag can result in PIO, see Fig. 5.25.

The concept of gain-limited bandwidth (fflBWgain) was developed as a means of avoiding this problem. Since pilots can act as amplifiers and are capable of doubling their gain, mBWgain is determined by applying a gain margin of 6 dB (20log10 (2) = 6) to the open loop data as shown in Figs 5.24 and 5.25. Note that with flat gain characteristics and high phase delay mBWgain is typically much lower than mBWphase and it is a simple matter to use the lower of the two bandwidths when assessing the specification compliance of unaugmented or RCAH response types [5.2].

Flight techniques

Frequency sweeps at low speed should only be attempted in zero wind or very light wind conditions. Similarly frequency sweeps at high airspeed should not be made if significant turbulence is present. Usually two pilots are used with one pilot performing the sweep while the other controls the remaining three axes. A ‘quarter count’ cadence count technique is often used for the low to medium frequencies. Using a longitudinal cyclic sweep as an example and starting with a 20-second period, the pilot would count from one to five as he moves the cyclic aft, then again as he returns the cyclic to the trim position. The process is then repeated for the forward deflection. The period is then reduced by counting to four for each quarter, and so on. Ideally the sweep is performed three times using a minimum of two pilots as each pilot will employ a slightly different technique. A 10-second ‘trim-shot’ is typically recorded before and after each sweep.

5.6.2.5 Incremental approach

There is no need to cover the entire frequency spectrum in a single sweep. In view of the independence of the results from input amplitude, it is perfectly feasible to combine the data from several test runs. From the point of view of aircraft damage, it is desirable to minimize the exposure of the airframe to this type of testing. Thus it is important that the test objectives are clearly defined as it may not be necessary to go up to potentially damaging high frequencies if adequate results can be obtained without doing so.

For ADS-33E work it is only necessary to cover the frequency range which will permit the bandwidth and phase delay calculations to be completed. It is sensible to conduct an initial frequency sweep with a low limiting frequency and analyze the results before continuing. Having determined the frequency range(s) of interest from the first ‘overview’ test, the optimum range(s) of inputs for subsequent, more detailed, tests is determined. Risk mitigation is achieved by minimizing the amount of testing and avoiding high frequencies wherever possible so that the potential for airframe damage is reduced. The conduct of limited range and, therefore, duration frequency sweeps will also facilitate the maintenance of an accurate trim condition throughout the test input.

Frequency spread

A wide range of input frequencies (up to around 2 Hz) without ‘holes’ in the spectrum is essential. In other words, it is important neither to omit a particular sub-range of frequencies nor to dwell on them for too long. One of the most difficult aspects of a frequency sweep is the maintenance of a progressive increase in frequency. Moderate frequency inputs are easy to achieve and impatient pilots tend to progress to the higher frequencies too quickly. The result of this is the omission of many low-to – middle frequencies. This problem is best overcome by using a cadence count technique as well as coaching the pilot to prevent him dwelling on a particular frequency.

5.6.2.2 Trim condition

The maintenance of the desired trim condition (airspeed and/or attitude) is important. This is best achieved by conducting a symmetrical frequency sweep which starts and stops at an accurate trim condition. Depending on the trim condition it may be necessary to bias the central control position in order to maintain the correct trim attitude or airspeed. To prevent corruption of the power spectrum it is important that such bias movements take place at a low frequency (over several input cycles). Typically the aircraft is kept within 10 knots of the trim airspeed as it passes through the level pitch attitude. Stick trim is generally beneficial as positive centring provides useful cueing to the trim position, however, large breakout forces may introduce discontinuities in the inputs.

5.6.2.3 Off-axis response

It is inevitable that off-axis responses will take place and it is important to allow them to occur for parameter identification purposes and for cross-coupling specification compliance testing. If the responses become so large that the pilot must intervene then he should make corrective inputs which are not correlated with the frequency of the primary control inputs. Thus if a high frequency pitch sweep is being made and suppression of a roll response is required this should be made at low frequency and vice-versa.

5.6.2.4 Resonance

It is important to avoid any dominant rotor or structural modes which could cause adverse structural or aerodynamic resonance that may damage the aircraft. Such frequencies should be identified by engineering analysis prior to a sweep. A well – designed helicopter should have structural, rotor and control system natural frequencies well above the range of frequencies a pilot would be likely to generate under normal circumstances. However, the deliberate use of high frequencies during testing may erode the design safety margin in this respect.