Results of the FORM Analysis
Within the stochastic analysis, the impact of random input parameters on the static aeroelastic response of the transport aircraft wing is investigated. Based on the results of the sensitivity analysis the analysis is performed at first only for skin areas due to the crucial impact on the wing aerodynamics. The wing structure is divided into four areas in which the input parameters were independently varied. The division of the areas is given in table 6 as a function of the span co-ordinate.
In each area, the structural parameters were varied simultaneously in the top and bottom skin parts. By this simplification, the number of random variables Xi decreased to a total of four that in turn led to significant reduction of numerical expenditure.
The Gaussian normal distribution for random input parameters is assumed (see section 3.2). To estimate the coefficient of variance for the thickness distribution manufacturing data sheets for maximum thickness deviation were analyzed. Following this analysis, a coefficient of variance, which lies between 0.02 and 0.04, seems to be realistic, but the results were calculated until the COV = 0.05 showed the effect of greater scatter within the input parameters. For the variation of the Young’s modulus, the same coefficients are used to guarantee the comparability of the results.
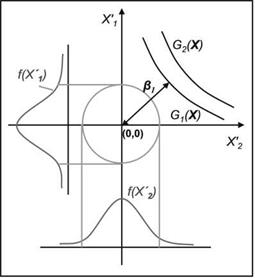
The allowed relative deviation A aEqSt / aEqSt of the converged angle of attack compared to the reference structure is analyzed in the range between 0.4% and 1.0% for different coefficients of variation. Each value of this deviation defines a limit state function G(X’). For a given value of G(X’) the FORM routine calculates a combination of random variables for which the reliability index converges. With regard to the investigated problem a combination of relative deviations of the structural input parameters in each area was found for which the probability of a given deviation of the angle of attack becomes a maximum.
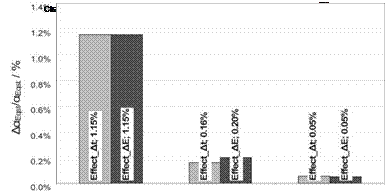
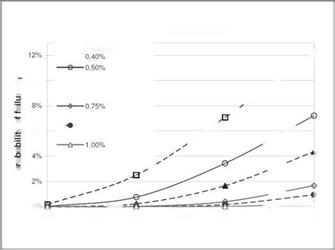
The results of the variation in the wall thickness and the Young’s modulus in skin areas are presented in figures 9 and 10. In the diagrams a probability of failure is plotted for a series of limit state functions over the coefficient of variance V. Due to almost linear correlation between the reliability index and limit state functions for a given COV, some curves could be extrapolated from the calculated results. These curves are plotted by dashed lines. For each limit state function the probability of the failure arises with the scatter in the input parameter expressed by V. The lower
Table 6 Areas of parameter variation
|
Area |
Лі |
Ло |
|
1 |
0.0 |
0.22 |
|
2 |
0.22 |
0.44 |
|
3 |
0.44 |
0.72 |
|
4 |
0.72 |
1.0 |
the allowed difference of the angle of attack expressed by a failure function is the higher is the probability to violate the requirements.
In the diagrams a probability of failure is plotted for a series of limit state functions over the coefficient of variance У. Due to almost linear correlation between the reliability index and limit state functions for a given У, some curves could be extrapolated from the calculated results. These curves are plotted by dashed lines in fig. 5 and 6. For the investigated coefficients of variance the results for a relative deviation of an angle of attack of 1.5% were calculated for the local variation in the skin thickness of 10% and more. This degree of variation within the wing structure seems not very realistic to be considered further. For each limit state function the probability of the failure arises with the scatter in the input parameter expressed by V. The lower the allowed difference in the angle of attack, expressed by a failure function the higher is the probability to violate the requirements.
The comparison of the results for variation of skin thicknesses and Young’s modulus shows very similar probability curves for both input parameters. The probability of failure obtained for the variation of Young’s modulus is somewhat smaller as for a variation of skin thicknesses. This tendency shows a good agreement with the predictions made within the sensibility study carried out in section 3.4.
From the results of the stochastic analysis depicted in figures 9 and 10 it can be seen that the probability of higher deviations (<1%) of the global aerodynamic properties of the wing still are very small even for a higher variance of structural parameters. This demonstrates a high robustness of the coupled fluid structure system affected by the considered type of uncertainty.
|
|
|
|
|
|
|
|
|
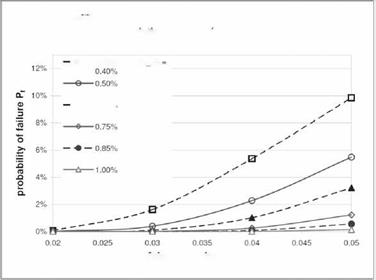
local bending stiffness of the panes is reduced by a variation of structural parameters having a significant influence on the aerodynamic drag.
References
[1] Heinze, W.: Ein Beitrag zur quantitativen Analyse der technischen und wirtschaftlichen Auslegungsgrenzen verschiedener Flugzeugkonzepte fur den Transport groBer Lasten; ZLR-Forschungsbericht 94-01, Braunschweig (1994)
[2] Osterheld, C. M.: Physikalisch begrundete Analyseverfahren im integrierten mul – tidisziplinaren Flugzeugvorentwurf; ZLR-Forschungsbericht 2003-06, Braunschweig (2003)
[3] Reimer, L., Braun, C., Bae-Hong, C., Ballmann, J.: Computational Aeroelastic Design and Analysis of the HIRENASD Wind Tunnel Wing Model and Tests. In: International Forum on Aeroelasticity and Structural Dynamics (IFASD) 2007, Stockholm, Sweden, Paper IF-077 (2007)
[4] Heinrich, R., Dargel, G.: Spezifikation des Testfalls fur den Hauptmeilenstein M8.1 im Verbundvorhaben MEGADESIGN (2006)
[5] Haupt, M., Niesner, R., Unger, R., Horst, P.: Coupling Techniques for Thermal and Mechanical Fluid-Structure-Interactions in Aeronautics. PAMM u Proc. Appl. Math. Mech. 5, 19-22 (2005)
[6] Schneider, W.: Die Entwicklung und Bewertung von Gewichtsabschatzungsformeln fur den Flugzeugvorentwurf unter Zuhilfenahme von Methoden der mathematischen Statistic und Wahrscheinlichkeitsrechnung; Berlin, Techn. Univ., Diss. (1973)
[7] Niu, M. C.Y.: Airframe Structural Design: practical Design Information and Data on Aircraft Structures. Conmilit Pr., Hong Kong (1999)
[8] Patnaik, S., Gendy, A., Berke, L., Hopkins, D.: Modified Fully Utilized Design (MFUD) Method for Stress and Displacement Constraints. NASA Technical Memorandum 4743 (1997)
[9] Malcolm, D. J., Laird, D. L.: Extraction of Equivalent Beam Properties from Blade Models. Wind Energy 10, 135-157 (2007)
[10] Reim, A., Horst, P.: Structural optimization considering stochastic variations of manufacturing alternatives. In: 8th World Congress on Structural and Multidisciplinary Optimization (2009)
[11] Haldar, A., Mahadevan, S.: Probability, Reliability and Statistical Methods in Engineering Design. Wiley & Sons (2000)
[12] Rackwitz, R., Fiessler, B.: Structural Reliability Under Combined load sequences. Computers & Structures 9, 489-494


