Category MECHANICS. OF FLIGHT

Control problems

Reference has already been made to the unpleasant things that may happen to aircraft as they go through the speed of sound – violent changes of trim, up or down, oscillations, buffeting, and so on. In such circumstances the first essen­tial from the pilot’s point of view is that he should have complete control; and so be master of the aircraft and its movements.

Unfortunately this is by no means easy to provide – and for several reasons.

Consider, for instance, an ordinary tail plane and elevator. At subsonic speeds an elevator depends for its effectiveness on the complete change of flow which occurs over both tail plane and elevator when the elevator is raised or depressed; the actual forces which control the aircraft are in fact much greater on the tail plane than they are on the elevator itself. Now as soon as a shock wave is formed on the tail plane – and the most likely place for its formation is at the hinge between tail plane and elevator – a movement of the elevator cannot affect the flow in front of the shock wave, so we have to rely entirely on the forces on the elevator itself to effect control. But the elevator will be in the turbulent flow behind the shock wave, and so may itself be very ineffective in producing the control forces required.

At higher speeds, when the shock wave moves back over the elevator, the opposite trouble may occur, and the forces on the elevator may be so great that it becomes almost immovable.

The answer to these troubles has been found in the all-moving slab type of tail plane (Fig. 5H) – sometimes given the rather curious name of a flying tail – and in making this power-operated. In this way we have what at the same time is an adjustable tail plane and an elevator.

The same principle can be applied to the ailerons – by having all-moving wing tips – and, more rarely, to the rudder, by having a combined fin and rudder.

But this is not the only high-speed control problem. Another is the possi­bility of reversal of the controls, owing to the distortion of the structure by the great forces on the control surfaces. This is most likely to happen on the ailerons. Suppose, for instance, that the starboard aileron is lowered in order to raise the starboard wing – if the force on the aileron is very great it will tend to twist the wing in such a way as to reduce its angle of attack, and so reduce the lift instead of increasing the lift on that wing; and the net result is that the wing will fall instead of rise. The aileron is acting on the wing just as a control tab is intended to act on a control surface; but that is little consolation to the pilot, and it doesn’t take much imagination to realise his horror when a move­ment of the control column has exactly the opposite effect to that intended! Nor is it an easy problem for the designer to solve since the extra weight involved in providing sufficient stiffness, especially on thin and heavily swept – back wings, may be prohibitive. So as well as requiring power-generated controls, special high-speed ailerons may be needed – these are situated well inboard where the structure is stiffer instead of at the tips. Another solution is to use ‘spoilers’ instead of ailerons. These are small flaps which come out of the top surface of the wing and disrupt the local flow, thus reducing lift on that wing and giving rolling control.

The introduction of power-operated controls has in itself caused a new problem in that the pilot no longer ‘feels’ the pressure resisting the movement of the controls; this feel was always a safety factor in that it made the pilot conscious of the forces he was applying, and in fact there was some advantage in that there was a limit to what he could do to the aeroplane owing to the sheer limitation of his strength. So important is this matter of feel that when power-operated controls are used it has been necessary to incorporate artificial or synthetic ‘feel’; and this is made even more real by grading it so that it varies not only with the movement of the control surface but with the density of the air and the air speed, in other words with the dynamic or stagnation pressure, ypV2 or q – it is sometimes called ‘g-feel’. Quite apart from the safety aspect, this synthetic feel gives the pilot a sense of control over the aeroplane which restores something of the art of flying.

But this is not the only problem resulting from the use of powered controls. If the power fails, and if there is no means of reverting to manual operation, the control may lock solid and the pilot be denied the use of rudder, elevators or ailerons. The answer to this is to introduce a safety factor by having more than one control surface, each having a separate power control; thus the Concorde had two rudders, one above the other, and six elevons (combined elevators and ailerons, which is the usual arrangement on delta or highly- swept wings). The Russian counterpart even had eight elevons.

Again on delta and highly-swept wings there is sometimes an interesting use of spoilers, this time as an aid to longitudinal control. Targe aircraft flying at high speed, with their considerable inertia, are slow to respond to the eleva­tors, just as they are to the ailerons. If one set of spoilers is fitted inboard (i. e. close to the fuselage) on each wing, and so forward of the aerodynamic centre; and another set is fitted well outboard and so, owing to the sweepback, behind the aerodynamic centre; and these are then linked to the elevator control in such a way that the fore and aft sets can be operated differentially, they will cause a movement of the centre of pressure which will aid the elevator control, just as when they are operated differentially on the port and starboard wings they assist the ailerons in providing lateral control, as described above.

Raising the critical Mach Number – sweepback

The second main way of raising the critical Mach Number (and this applies only to the wings, tail, fin and control surfaces) is sweepback – not just the few degrees of sweepback that was sometimes used, rather apologetically and for various and sometimes rather doubtful reasons, on subsonic aircraft, but 40°, 50°, 70° or more.

Raising the critical Mach Number - sweepback

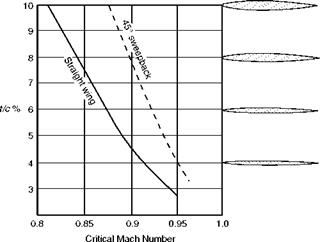
Fig 11.15 Critical Mach Number and t/c ratio

Raising the critical Mach Number - sweepback

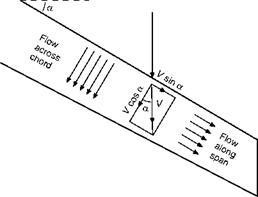
Sweepback of this magnitude not only delays the shock stall, but reduces its severity when it does occur. The theory behind this is that it is only the com­ponent of the velocity across the chord of the wing (V cos a) which is responsible for the pressure distribution and so for causing the shock wave (Fig. 11.16); the component У sin a along the span of the wing causes only frictional drag. This theory is borne out by the fact that when it does appear the shock wave lies parallel to the span of the wing, and only that part of the velocity perpendicular to the shock wave, i. e. across the chord, is reduced by the shock wave to subsonic speeds. As the figure clearly shows, the greater the sweepback the smaller will be the component of the velocity which is affected,

Fig 11.16 Sweepback – components of velocity

Raising the critical Mach Number - sweepback

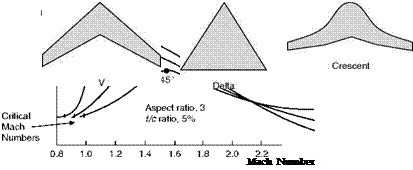
Fig 11.17 Effects of sweepback

Fig 11.18 Swept-back wings for transonic speeds and so the higher will be the critical Mach Number, and the less will be the drag at all transonic speeds of a wing of the same tic ratio and at the same angle of attack.

Experiment confirms the theoretical advantages of sweepback, though the improvement is not quite so great as the theory suggests. The dotted line in Fig. 11.15 shows how a wing swept back at 45° has a higher critical Mach Number than a straight wing at all values of tic ratio, the advantage being greater for the wings with the higher values of tic. Figure 11.17 tells us even more; it shows that sweepback not only increases the critical Mach Number, but it reduces the rate at which the drag coefficient rises (the slope of the curve), and it lowers the peak of the drag coefficient – and 45° of sweepback does all this better than 30°. Incidentally this figure also shows that, above about M = 2, sweepback has very little advantage – but that is another story and, in any case, aeroplanes cannot fly at M = 2 without first going through the transonic range.

Figure 11.18 shows various plan forms of swept-back wings.

Of course, as always, there are snags, and the heavily swept-back wing is no exception. There is tip stalling – an old problem, but a very important one; in the crescent-shaped wing (Fig. 11.18) an attempt has been made – with some success – to alleviate this by gradually reducing the sweepback from root to tip. CLmax is low, and therefore the stalling speed is high, and CLmax is obtained at too large an angle to be suitable for landing – another old
problem, and one that can generally be overcome by special slots, flaps or suction devices. There are also control problems of various kinds, and the designer doesn’t like the extra bending and twisting stresses that are inherent in the heavily swept-back wing design. But whatever the problems sweepback seems to have come to stay – at least for aircraft which are designed to fly for any length of time at transonic or low supersonic speeds.

Raising the critical Mach Number – slimness

When increase in engine thrust – due to the rapid development of jet engines – first made transonic flight possible, research was concentrated on the problem of raising the critical Mach Number, of postponing the shock stall, of getting as near to the barrier as possible without getting into it – in short, of keeping out of trouble rather than facing it.

There are two main ways of raising the critical Mach Number. The first is slimness. The need for slimness will be abundantly clear from all that has been said about shock waves and their effects – and the slimness applies to all parts, the aerofoil section, the body, the engine nacelles, the fin, tail plane and control surfaces, and perhaps most of all to small excrescences (if there must be such things) on the aircraft. The aerofoil section must be of the low-drag laminar – flow type already referred to, and must have a very low ratio of thickness to chord. The Spitfire of the Second World War has already been mentioned as an example of slimness, and of a high critical Mach Number – all the more remarkable in that it was not designed for transonic speeds.

The full line in Fig. 11.15 shows very clearly the effect of thickness/chord ratio on the critical Mach Number for a straight wing (the dotted line will be referred to in the next paragraph); at a tic ratio of 10 per cent this wing has a critical Mach Number of only just over 0.8, at a tic ratio of 8 per cent it is raised to 0.85, and at 4 per cent it is over 0.9. Not long ago the tic ratios of wings for fighter aircraft were from 9 to 12 per cent, but they have now been reduced to 7 or 8 per cent, and may yet be still further reduced to a figure as low as 3 per cent, though there are of course very great design and manufac­turing difficulties in producing such thin wings. In thus speaking of thin wings it is important to keep in mind that what really matters is not the actual thick­ness, but the ratio of thickness to chord.

Sonic bangs

We are now all too familiar with the noises made by aircraft ‘breaking the sound barrier’, not to mention those unfortunate people who have suffered damage to property as a result. These so-called sonic bangs, or booms, are of course, caused by shock waves, generated by an aircraft, and striking the ears of an observer on the ground, or his glasshouses or whatever it may be; but there has been considerable argument as to the exact circumstances which result in the shock waves being heard, why there are often two or more dis­tinct bangs, whether the second one came first, and so on.

Strangely enough many people don’t seem to realise that we were familiar with sonic bangs, and their effects on us and our property, long before aircraft flew at all. A crack of the whip is probably the oldest man-made example; it may not have been responsible for breaking glasshouses, but in the hands of a circus performer it can be a pretty shattering noise. A roll or a clap of thunder is an example from nature of a series of shock waves; and one must have noticed how the bangs produced by aircraft often resemble a short roll of thunder. Explosions, too, produce shock waves, and, although a bombing raid is hardly an appropriate time to analyse such things, there were many unfortu­nate enough to experience during the war the disastrous effects on their ears and property of the shock wave of an exploding bomb, as distinct from the damage caused by the bomb itself. Some, too, may even have noticed the rather weird way in which the different bangs arrived at different times depending on where the observer was relative to the launching and explosion of the bomb. But the nearest thing to the sonic bangs produced by aircraft are the crack of a rifle bullet, or of a shell going overhead, or of the V2 rocket of wartime memory.

If an aircraft were to fly at supersonic speed at a height of a few feet over one’s head the shock waves from wings, body, tail, etc., would strike one’s ears in rapid succession, so rapid that one couldn’t distinguish between them, and (if one remained conscious at all) the impression, so far as noise is concerned, would probably be of a short roll of thunder. The higher the aircraft flew, the less violent would be the noise produced by the shock until it would hardly be noticed at all from the ground; the noise of the engine, and of the aircraft itself, are of course continuous noises which are quite distinct from that of the shock.

An aircraft diving towards the earth at supersonic speed, and at an angle of say 45°, then suddenly slowing up and changing direction, will ‘shed’ its shock waves, which will travel on towards the earth and strike any observers who may happen to be in their path. It is certainly quite clear from schlieren pho­tographs that a bow wave approaches from the front as the speed of sound is approached, and, conversely, goes ahead of the aircraft when it decelerates below the speed of sound.

So far as effects at ground level are concerned, we know that these become less intense with the height of the aircraft; more intense with Mach Number, though not anything like in proportion; that they are affected by the dimen­sions of the aircraft, increasing with its weight and volume, and being of longer duration according to its length; that they are more intense during accelerated flight (when the shocks tend to coalesce) than in steady flight; and that they decrease very rapidly with lateral displacement from the line of flight of the aircraft, in fact they only extend over a certain lateral distance. All this is rather what one might expect, but the problem is complicated because shocks of different intensities may be generated by the body, wings, tail and other parts of the aircraft, hence sometimes the roll as of thunder rather than one or two sharp bangs. One factor that one might not expect is the extent to which the bangs vary according to the conditions in the atmosphere between the aircraft and the ground, the winds, temperature, turbulence and so on. The actual pressures created at ground level are not so great as is sometimes thought; the overpressure in the Concorde boom, for instance, was only of the order of 96 newtons per square metre.

Can anything be done about it? Not much; if we insist on flying at these speeds. We can legislate against supersonic flight other than over the sea or thinly populated areas, but even so aircraft have to reach these areas. Moreover the tendency must be for the weight and size of such aircraft to increase rather than the reverse. Some alleviation can be obtained by control of climbing speeds; and at certain heights the speed of sound may be exceeded without creating a boom at all, the shock wave being dissipated before it reaches the ground. So really there is nothing for it but to fly as much as poss­ible over the sea, and as high as possible, perhaps even really high – as we shall mention in the last paragraphs of this book.

Finally it should be mentioned that the publicity that has been given to sonic booms has tended to make us forget all the other noises created by air­craft, those from the engines, propellers or jets, and from the motion of the aircraft itself; these noises are probably more objectionable than sonic booms to those who live on landing or take-off paths, they are by no means confined to transonic and supersonic aircraft, and there are better prospects of reducing some of these noises as, for example, by using quieter engines.

Shock waves and pressure distribution

It has already been stated that at the shock stall, as at the high incidence stall, there are sudden changes both in lift and drag; and it is only to be expected that these are due in the main to changes in the pressure distribution over the wings or other surfaces. So pressure plotting has been as important a feature of research into the problems of high-speed flight as into those of subsonic flight, and the connection between the shock patterns and pressure distri­bution is naturally of great interest and importance.

It must be remembered that when we were originally considering the shapes of aerofoil sections in Chapter 3, the so-called laminar flow aerofoil (Fig 3.22)
proved of great value at speeds of 140 m/s upwards. The characteristics of this section were comparative thinness and gently graduated camber, with the point of maximum camber farther back than on slow-speed types. As a result of this shape – in fact it was the purpose of it – the airflow speeded up very gradually and the distribution of decreased pressure over the upper surface was much more even than for the slower types on which there was a marked peak of suction quite near the leading edge (Fig. 3.8). We naturally approached the transonic region with aerofoil sections of this type, and so in considering the pressure distribution diagrams we must expect a fairly even distribution of decreased pressure on the top surface before the shock waves appear (this will be evident in Figs 11.13 and 11.14, overleaf).

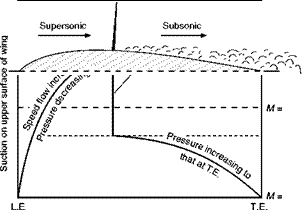
Figure 11.13 shows in a very realistic way how the decrease in pressure, or suction, on the upper surface of a wing is affected by the formation of a shock wave when the wing as a whole is moving near the critical Mach Number. It shows the local Mach Number of flow across the surface of the wing; pressure of course depends on the speed, and hence Mach Number; the higher the local speed the less the pressure (back to Bernoulli again). The pressure scale is not given since compressibility effects complicate the issue considerably, but qual­itatively Figure 11.13 gives the right idea.

Подпись: Subsonic flow at critical Mach Number
Shock waves and pressure distribution

Figure 11.14 is rather more complicated, but it is worth trying to under­stand because it demonstrates so clearly the practical effect of the shock waves on the pressure distribution – this time on both top and bottom surfaces, and for a symmetrical wing section at a small angle of attack – and the resultant effect on the lift and drag coefficient of the wing over the transonic range.

Fig 11.13 Shockwave and pressure distribution

Подпись: 326 MECHANICS OF FLIGHT

Full line: Pressure on top surface

Shock waves and pressure distribution


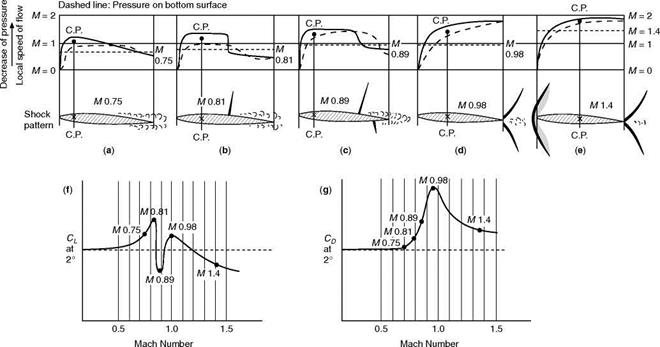
Fig 11.14 Shock-wave patterns and pressure distribution Symmetrical bi-convex section at 2° angle of attack.

Incidentally, too, the figure gives a partial answer to the exercise suggested at the end of the previous paragraph, but perhaps the reader tackled that exer­cise before reading on!

At (a), (b), (c), (d), and (e) in the figure, which illustrate what happens at Mach Numbers of 0.75, 0.81, 0.89, 0.98, and 1.4 respectively, we see first the shock patterns at these speeds. All refer to a symmetrical bi-convex aerofoil section at an angle of attack of 2°. Above the shock pattern is shown the cor­responding Mach Number distribution, across the chord; the full line representing the upper surface and the dotted line the lower one; decreased pressure is indicated upwards, as this corresponds to increasing Mach Number. It is the difference between the full line and the dotted line which shows how effective in providing lift is that part of the aerofoil section; if the dotted line is above the full line the lift is negative. The total lift is represented by the area between the lines, and the centre of pressure by the centre of area. Increasing speed, which is proportional to the decreasing pressure, is also shown upwards.

On the vertical scale on each diagram is a Mach Number of 1, i. e. the speed of sound, and the free stream Mach Number, i. e. the Mach Number at which the aeroplane as a whole is moving through the air. Thus we can see at a glance over what parts of the surfaces, upper or lower, the local airflow is subsonic or supersonic, and over what parts its speed is above or below that at which the aerofoil is travelling.

Parts (f) and (g) of the figure show the lift coefficient and drag coefficient corresponding to each diagram. Of these the lift curve is most interesting, partly because we have already seen the drag curve in Fig. 11.7, but more because the drag is not revealed by the pressure distribution to the same extent as the lift is, and in fact the pressure distribution does not show the important part of the drag that is tangential to the surface at all.

Figure 11.14 should be studied at leisure; it tells a long story – too long for me to point out every detail. But let us just look at some of the more important points.

Part (a) of course, is the subsonic picture, except that separation has already become apparent near the trailing edge and there is practically no net lift over the rear third of the aerofoil section; the centre of pressure is well forward and, as (f) shows, the lift coefficient is quite good and is rising steadily; the drag coefficient, on the other hand, is only just beginning to rise.

In (b) the incipient shock wave has appeared on the top surface; notice the sudden increase of pressure (shown by the falling line) and decrease of speed at the shock wave. The centre of pressure has moved back a little, but the area is large, i. e. the lift is good (see (f)), and the drag (g) is rising rapidly.

The pressure distribution in (c) shows very clearly why there is a sudden drop in lift coefficient (see (f)) before the aerofoil as a whole reaches the speed of sound; on the rear portion of the wing the lift is negative because the suction on the top surface has been spoilt by the shock wave, while there is still quite good suction and high-speed flow on the lower surface. On the front portion there is nearly as much suction on the lower surface as on the upper. The centre of pressure has now moved well forward again; the drag is increasing rapidly (g).

Part (d) is particularly interesting because it shows the important results of the shock waves moving to the trailing edge, so no longer spoiling the suction or causing separation. The speed of flow over the surfaces is nearly all super­sonic, the centre of pressure has gone back to about half chord, and owing to the good suction over nearly all the top surface, with rather less on the bottom, the lift coefficient has actually increased (see (f)). The drag coefficient is just about at its maximum.

At (e) we are through the transonic region. The bow wave has appeared. For the first time the speed of flow over about half of both surfaces is less than the Mach Number of 1.4 of the aerofoil as a whole. The lift coefficient has fallen again, because the pressures on both surfaces are nearly the same; and this time – for the first time since the critical Mach Number – the drag coeffi­cient has fallen considerably.

Shock-wave patterns

In an earlier paragraph we described how a shock wave is formed at a speed of about three-quarters of the speed of sound, i. e. at about M = 0.75. On a symmetrical wing at zero angle of attack the incipient shock wave appears on both top and bottom surfaces simultaneously, approximately at right angles to the surfaces, and, as one would expect, at about the point of maximum camber (Fig. 11.12b). On a wing at a small angle of attack, even if the aero­foil section is symmetrical, the incipient shock wave appears first on the top surface only (Fig. 11 A) – again as one would expect, because it is on the top surface that the speed of the airflow first approaches the speed of sound.

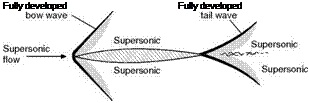
Figure 11.12 shows how the shock-wave pattern changes (on a symmetri­cally shaped sharp-nosed aerofoil at zero angle of attack) as the speed of airflow is increased from subsonic, through the transonic range to fully super­sonic flow.

Between the formation of the incipient wave (at a Mach Number of about 0.75 or 0.8) and the time when the wing as a whole is moving through the air at a speed of sound (M = 1.0), the shock wave tends to move backwards, but in doing so becomes stronger and extends farther out from the surface, while there is even more violent turbulence behind it (Fig. 11.12c). At a speed just above that of sound another wave appears, in the form of a bow wave, some distance ahead of the leading edge; and the original wave, which is now at the trailing edge, tends to become curved, and shaped rather like a fish tail (Fig. ll. lld). As the speed is further increased the bow wave attaches itself to the leading edge, and the angles formed between both waves and the surfaces become more acute (Fig. 11.12c). Still further increases of speed have little effect on the general shock-wave pattern – but here we are trespassing on supersonic flight, which is the subject of the next chapter.

At each wave there is a sudden increase of pressure, and density, and tem­perature, a decrease in velocity, and a slight change in direction of the airflow. The thickness of a shock wave, through which these changes take place, is only of the order of 2 to 3 thousandths of a millimetre – they look thicker on pho­tographs because it is not possible to get a perfectly plane shock wave in the experiment. The changes at the shock wave are irreversible, which is another way of saying that the losses, which lead to wave drag, cannot be recovered. It is interesting to note, however, that the incipient waves only extend a short distance from the surface, and leaks are possible round the ends of the waves; as speed increases the waves extend and there is less and less possibility of such leaks. It is interesting to note, too, that the decrease in velocity, which occurs behind the shock wave, means that when an aircraft is moving through the air, and a shock wave is formed, the air behind the shock wave begins to move in the direction in which the aircraft is travelling.

In addition to showing the shock-wave patterns, Fig. 11.12 also indicates the areas in which the flow is subsonic or supersonic. In (a) at M = 0.6 it is all

Shock-wave patterns

Supersonic

Подпись: Fully developed Fully developed

^Supersonic

Fig 11.12 Development of shock waves at increasing mach numbers

(a) Subsonic speeds. No shock wave. Breakaway at transition point.

(b) At critical Mach Number. First shock wave develops.

(c) At speed of sound. Shock wave stronger and moving back.

(d) Transonic speeds. Bow wave appears from front. Original wave at tail.

(e) Fully supersonic flow. Fully developed waves at bow and tail.

subsonic (clearly we are still in the subsonic region); at M = 0.8 the flow immediately in front of the shock wave is supersonic, but all the remainder is subsonic (we are now in the transonic region with both types of flow); at M = 1 the area of supersonic flow has increased but the flow behind the shock wave is still subsonic (as we shall learn later it is always subsonic behind a shock wave that is at right angles to the flow, it can only be supersonic behind an inclined or oblique shock wave); at M = 1.1 nearly all the flow is supersonic, but there are still small regions of subsonic flow, immediately in front of the leading edge at what is called the stagnation point where the flow is brought to rest, and immediately behind the trailing edge (we are still in the transonic region, but not for much longer); at M = 2 the flow is all supersonic – we are through the barrier (though to be strictly correct, unless the bow wave is actu­ally attached to the leading edge, which will only happen if the edge is very sharp, there will still be a small area of subsonic flow at the stagnation point between the bow wave and the leading edge; and of course in the boundary layer itself the air immediately next to the surface is at rest relative to the surface, and most of the remainder of the airflow in the boundary layer is sub­sonic).

The figure also shows how the extent of the separated region, or thickened boundary layer tends to decrease with increasing Mach Number, and this sug­gests that as wave drag becomes relatively more important, boundary layer drag becomes relatively less so. This may also give a clue to the decrease in drag coefficient as we pass through the barrier (Fig. 11.7).

The reader should now be able to draw for himself the shock patterns, cor­responding to those of Fig. 11.12 for an aerofoil inclined at a small angle of attack, and the exercise in doing so will help him to appreciate how and why shock waves are formed.

Figure 11B (on page 306) is a remarkable example of condensation and shock waves on an aeroplane in flight with, below, a Schlieren photograph of shock waves on a model of the same aircraft. More shock waves on an aero­foil are shown in Fig. 11F at the end of this chapter.

Experimental methods

In the course of this book there has been frequent comment to the effect that theory has tended to lag behind practice as the means whereby we have acquired aeronautical knowledge. Some critics have said that this claim has been exaggerated, but the author still believes that it is fair comment. It cer­tainly isn’t a new idea for this is an extract from the 14th Annual Report of the Aeronautical Society of Great Britain (now the Royal Aeronautical Society) – ‘Mathematics up to the present day has been quite useless to us in regard to flying’ – the date of that report, 1879!

But whatever may have been the relative importance of theory and experi­ment in the acquisition of knowledge about subsonic flight, even the most theoretically-minded critic will surely agree that we have had to rely almost entirely on experiment in solving the problems of transonic flight, for here we have a mixture of subsonic and supersonic flow, compressibility and incom­pressibility, two completely different theories all mixed up. Curiously enough, in real supersonic flight, theory comes into its own; supersonic theory is simpler and older than that of subsonics or transonics – Newton’s theories used to calculate air resistance of a body at 515 m/s give an answer nearer the truth than if they are used to calculate its resistance at 51.5 m/s.

But one of the fascinations of this subject is that the experimental methods themselves are so interesting, involving as they do their own theories quite apart from the facts that they reveal. So far as transonic and supersonic flight are concerned we have already referred to ingenious methods of photography which give us pictures not only of shock waves, but also of smaller changes of density; and by taking films by these methods we can watch the changes of density and of the shock pattern as speed is increased from subsonic to tran­sonic, then through the transonic to the supersonic region. At subsonic speeds we have devised methods of seeing the flow of air, but the schlieren and other methods show something even more important – what happens as a result of airflow. We have learnt a very great deal by these methods, and we shall look at some more pictures later.

But though it is conceivable that by very elaborate means such photographs could be taken in flight they really require laboratory conditions, which means wind tunnels. Now wind tunnels present quite enough problems at subsonic speeds; but as we approach the speed of sound the very shock waves which we want to investigate and photograph, obstruct the flow through the tunnel (even when it hasn’t got a model in it), and raise a barrier so effective that the tunnel is virtually choked and the high-speed flow cannot get through. Even if the tunnel design can be modified so as to allow the flow, the shock waves on even the smallest of models will cause very severe interference between the model and the walls of the tunnel, and so make the results of the tests value­less. This choking of wind tunnels, which was particularly difficult to overcome between Mach Numbers of 0.85 and 1.1, is the explanation of two rather curious facts in aeronautical history, that a truly supersonic wind tunnel became a practical proposition before a transonic one, and that flight at super­sonic speeds took place before such speeds were reached in wind tunnels.

The problem of the transonic wind tunnel has now been largely overcome (though rather late in the day) by using slotted or perforated walls, and there are many types of supersonic tunnel in use today. Some of these are very similar to subsonic types in general outline; the extra speed has simply been obtained by more power together with suitable profiling of the duct – perhaps simply is not quite the right word, because the increase in power required, and consequent cost, is tremendous. It might be thought that fans of the propeller type would not be suitable for such tunnels; but in fact they can be used because they are situated at a portion of the tunnel where the speed is com­paratively low, the cross-section of the tunnel, and therefore the propeller, being correspondingly large. The great size of the propeller, often larger than any used on aircraft, presents problems of its own, but none the less this con­ventional type of tunnel, which may be straight through, return flow or even open jet, is probably the most satisfactory where a large tunnel is required.

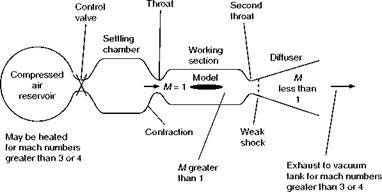
For smaller types, and higher speeds, it is more usual to employ some kind of reservoir of compressed air and, by opening a valve, to allow this to blow through the tunnel to the atmospheric pressure at the exhaust (Fig. 11.10). By arranging for the exhaust to be into a vacuum tank, even higher speeds can be obtained. One great disadvantage of this method is that continuous running for long periods is impossible; in fact constant speed is only achieved for a very

Experimental methods

Fig 11.10 High-speed wind tunnel: blow-through type

If return flow type

excess air is blown Air injected Can be of return

off during return underpressure flow type

Experimental methods

Air injected under pressure

Fig 11.11 High-speed wind tunnel: induced flow type

short time. It sounds rather primitive, and in some ways it is, but Mach Numbers of 4 or more may be reached by this method, though the cross-sec­tional area of the working section is usually small.

More efficient, at some Mach Numbers, than this straight blow-down type of tunnel is the induction or induced flow type, in which air is blown in or injected just down stream of the working section (Fig. 11.11), thus ‘inducing’ a flow of air from the atmosphere through the mouth of the tunnel. Notice that in this type the compressed air does not flow over the model at all, only the induced air does. The injected flow can be the jet of a turbo-jet engine; in fact the jet engine itself can be in the tunnel. An induction type tunnel may be of the return flow variety, in which case provision must be made for the excess air to be blown off from the return passage.

It is one thing to obtain a high Mach Number in a wind tunnel – it is quite another thing also to obtain a high Reynolds Number (see Appendix 2) and so eliminate scale effect. This brings in the question of high-density tunnels, low – density tunnels, cryogenic (low temperature tunnels) and even the use of gases other than air; this interesting problem will be touched on in Appendix 2, but it is really beyond the scope of this book.

A simple and fascinating way of observing patterns very similar to shock – wave patterns is by using what is sometimes called the hydraulic analogy. Anyone who has watched the bow wave, and other wave patterns caused by a ship making its way through water, and has also seen the shock-wave pat­terns in air flowing at supersonic speed, must have been struck by the similarity of the patterns. If bodies of various shapes are moved at quite mod­erate speeds across the surface of water (not totally immersed), or the water made to flow past the bodies, many shock-wave phenomena can be illustrated and, by a suitable system of lighting, thrown on to a screen. Some people say that such demonstrations are too convincing, because they make one think that it is the same thing – which of course it isn’t. The patterns are similar but the angles and so on of the waves are different.

Finally, we come to full-scale or free-flight testing, and even this may be divided into two types, tests with piloted aircraft and those with pilotless air­craft or missiles. Not only are these the eventual tests, but in the case of transonic flight, in particular, they have also been the pioneer tests and most of them have been made in piloted aircraft. In the early investigations, piloted aircraft certainly had their limitations because we could only approach the speed of sound in a dive; this had rather obvious and rather serious disadvan­tages. It took a long time (and a lot of height lost) to reach the critical speeds and then, if the symptoms were alarming – as they sometimes were – we were unpleasantly near the ground by the time a recovery could be made; moreover the making of such a recovery was not made any easier if the symptoms were severe buffeting, or worse – a further dropping of the nose and steepening of the dive – or worse still – heaviness of the controls so severe that they could not be moved. In such circumstances the point made in an earlier paragraph that the Mach Number might be decreasing as we hurtled towards the ground was hardly sufficient consolation.

As the thrust of jet engines increased – and it was this thrust which made even the approach of the speed of sound possible – the shock stall could be reached in level flight in some types of aircraft, and later still in climbing flight. This was an altogether different proposition from the pilot’s point of view and, as testing at transonic speeds lost its terrors, our knowledge increased corre­spondingly more rapidly.

Test on bullets and shells moving through the air at supersonic speeds have been made on ballistic ranges since before the days of practical flight, and pho­tographs of shock waves were taken more than 60 years ago, but it was only when aircraft themselves began to approach the speed of sound that the sig­nificance of such tests in respect of aircraft design began to be realised; and it was the development of the ramjet and rocket as means of driving missiles, and the parallel development of electronic instruments which could not only guide the missiles but take readings and keep records during the flight – in some cases even transmitting them back to earth – it was these that con­tributed most of all to our knowledge, and to the solution of the problems of transonic and supersonic flight.

So we can sum up the experimental methods that have been used to inves­tigate these problems as coming under the following headings –

(a) Photography of shock waves.

(b) High-speed wind tunnels.

(c) The hydraulic analogy.

(d) Free flight in piloted aircraft.

(e) Rockets and missiles.

Now let us see what all this has taught us.

Height and speed range

It was explained in Chapter 7 that for a piston-engined aircraft owing to limi­tations of power the speed range of an aircraft narrows with height, until, at the absolute ceiling, there is only one possible speed of flight. This speed, however, was not the stalling speed, but rather the speed of best endurance, and the absolute ceiling was simply a question of engine power; for a given air­craft, the greater the power supplied, the higher would be the ceiling.

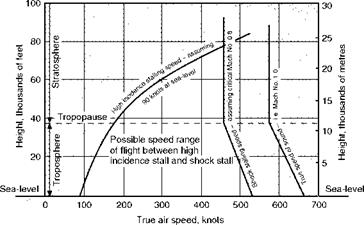
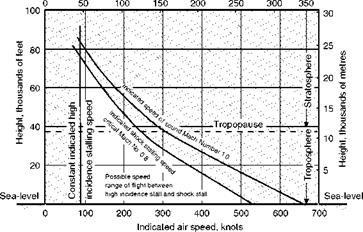
Now, however, with almost unlimited thrust available in the form of jets or rockets, or eventually perhaps atomic energy, there is an altogether new aspect of the limitation of height at which an aircraft can fly without stalling – one way or the other. For the true speed of the high incidence stall will increase with height, while the true speed of the shock stall will fall from sea-level to the base of the stratosphere, and then remain constant. The result, assuming a sea-level stalling speed (high incidence) of 46 m/s and a critical Mach Number of 0.8, is shown in Fig. 11.8, the shaded portions being the regions in which flight is not possible without stalling. It will be evident that if this aeroplane is to avoid both kinds of stall, it cannot fly above 23 000 m, whatever the power available, while if it flies at 23 000 m, it can only fly at the stalling speed. If it flies any slower it will stall (high incidence), and if it flies any faster it will stall (shock). Surely a modern interpretation of being between the devil and the deep sea! Figure 11.9 shows exactly the same thing from the point of view of indicated speeds. Thus, quite apart from engine power, there is a limitation to the height of subsonic flight, and a narrowing of the speed range as the lim­iting height is approached.

This curious coming together of the two stalls will occur at considerably lower heights during manoeuvres, which will cause the high incidence stalling speed to increase, and the shock stalling speed to decrease. The figures in Table 11.5 are quite reasonable for 40 000 ft (say 12 000 m).

Table 11.5 Effect of altitude on stalling speeds

High incidence stall (true air speeds)

Shock stall (true air speeds)

Normal stall, sea-level Normal stall at 40 000 ft

Stall at 4g, at 40 000 ft

Further increased at high M to, say,

At 4g, this may be reduced to, say

M = 0.7 40 000 ft M = 1 40 000 ft M = 1 Sea-level

90 180 360 380

380 400 570 661

knots —^ ^ ^ ^

і— і— і— і— knots

Increase of high incidence stalling speed

Decrease of shock stalling speed

True air speed, metres per second 0 50 100 150 200 250 300 350

Height and speed range

Fig 11.8 Subsonic speed range of flight – true speeds

One must always be careful in interpreting results of this kind. The above discussion must not be taken to imply that all aircraft are limited by shock stall or buffet at the maximum speed. This will be true for aircraft designed for eco­nomical cruise at transonic speed (as are most commercial airliners) but clearly many aircraft are designed to pass through the transonic speed range and cruise at supersonic speed – but more of that in the next chapter.

Indicated air speed, metres per second

Height and speed range

Fig 11.9 Subsonic speed range of flight – indicated speeds

Before we move on to supersonic flow, though, we will spend a little time examining the ways in which knowledge of transonic flows was acquired by experiment and how this knowledge is used in the design of aircraft which operate at transonic speeds.

Behaviour of aeroplane at shock stall

All this rather assumes that there is something to be feared about a shock stall, and that pilots try to avoid it. After all, there was a time when we looked upon the high incidence stall in the same way – something to be avoided at all costs. Now, however, it is practised by all pilots in the very early stages of learning. Much the same is happening to the shock stall – it is all a question of knowl­edge, and many aircraft currently cruise safely well into the transonic region.

By far the most important effect is a considerable change of longitudinal trim – usually, but not always, towards nose-down, and sometimes first one way then the other. Unfortunately the change of trim is made even worse by the very large forces required to move the controls, and the ineffectiveness of the trimmers. There is also likely to be buffeting, vibration of the ailerons, and pitching and yawing oscillations which may become uncontrollable, and which are variously described as snaking (yawing from side to side), por­poising (pitching up and down), and the Dutch roll (a combination of roll and yaw).

These effects can, though, be alleviated by the use of power controls and automatic stability augmentation systems. The best way of avoiding the diffi­culties is to keep an eye on the machmeter – if there is one – and, if the worst comes to the worst, to get into regions of higher temperature. The best ways of getting out of trouble are to stop going so fast – or to go faster! In a climb it is easy to stop going so fast – just throttle back. That is why the safest and best research work can often be done in climbing flight. In level flight it may not be quite so easy to lose speed, especially if the controls cannot be moved; and in a dive, which is where these troubles are most likely to occur, it will be even more difficult. It is essential therefore that all aircraft which are capable of these speeds, and which have undesirable characteristics in the transonic range, should have some kind of dive brake, or spoiler, which can safely be used at high Mach Numbers. We have had to go very fast on aeroplanes before the need for a brake was recognised! As to going faster; well, that will take us into the region of supersonic flight which will be dealt with in the next chapter.

Flight at transonic speeds – the pilot’s point of view

We have so far discussed the problems of approaching the speed of sound very much from the point of view of the designer – but what about the pilot? Well, to find out what is going on, or what is likely to happen, the first thing needed is an instrument to measure at what Mach Number an aircraft is flying. Various types of machmeter are already in existence, and no doubt they will be improved in accuracy and reliability. For a machmeter to give a reliable indication of the Mach Number it must measure, in effect, the true speed of the aircraft and the true speed of sound for the actual temperature of the air. The first is usually done via the indicated speed, which can be corrected for air density by a compensating device within the instrument, but which still includes position error. A temperature compensating device can be used to give the true speed of sound, but in modem instruments this has been eliminated, and a combination of aneroid barometer and air speed indicator gives all the correction required – except that of position error. The term ‘Indicated Mach Number’ is sometimes used for the reading of the machmeter, but it is an unsatisfactory term since it differs from indicated air speed in that the main correction, that of density, has already been made in the instrument itself.

In the absence of a machmeter the pilot will find that the air speed indicator is apt to give very misleading ideas – even more so than usual. This assumes, of course, that the pilot is not one of those who have already discovered that what the air speed indicator reads is not an air speed at all! Without such knowledge, a pilot may reason that if the speed of sound is around 340 m/s it is impossible to run into trouble with say 103 m/s on the clock; a shock stall at this speed might come as a real shock.

Yet such a shock is possible because –

In the first place, the speed of sound is a real speed, a true speed.

Secondly, it decreases with fall of temperature, down to 295 m/s, or less, in the stratosphere.

Thirdly, the speed as indicated is not the true speed, and the error is more than 100 per cent in the stratosphere, so that at a real speed of 340 m/s at say 40 000 ft, the indicator will read less than 154 m/s.

Fourthly, trouble begins not at the speed of sound but at the critical Mach Number, and if this is 0.7 (a low value but by no means unknown), a shock stall may occur at 0.7 X 154, i. e. 108 m/s on the clock.

Fifthly – and a point not so far mentioned – a shock stall occurs at an even lower critical Mach Number during manoeuvres, so that in a turn the 108 might be reduced to less than 103.

And there we are!

The figures are all possible, they might even be worse.

There is one compensation; the pitot head is one of the first parts to experience the effects of compressibility, which may cause the air speed indicator to over-read at very high speeds – but this is usually allowed for in calibration.

Table 11.4 Air speed indicator readings and truespeed

Height True speed True speed at which Reading of ASI

of sound shock stall will occur at this speed _____________ assuming M 0.7_________________________________

feet

metres

knots

m/s

knots

m/s

0

0

661

340

463

463

238

10 000

3048

640

329

448

385

198

20 000

6096

614

316

430

315

162

30 000

9144

589

303

412

253

130

40 000

12192

573

295

401

200

103

50 000

15 240

573

295

401

156

80

Table 11.4 may be a help to a pilot in realising what is going on; the figures are calculated on the assumption of the International Standard Atmosphere and will vary to some extent according to how much actual conditions differ from this.

The figures in the last column are the readings of the air speed indicator at which a shock stall may occur (it may even occur at lower indicated speeds because the figures given do not allow for manoeuvres), and they are apt to be rather alarming. There is, however, another way of looking at it – and one that is much more heartening.

Suppose one dives from 50 000 ft at a constant true speed of, say, 450 knots; that is at a rapidly increasing speed on the clock of –

176 knots at 50 000 ft,

225 knots at 40 000 ft,

275 knots at 30 000 ft,

328 knots at 20 000 ft,

387 knots at 10 000 ft,

and 450 knots at sea-level,

strange as it may seem, the actual Mach Numbers would be decreasing as follows –

450/570 or 0.77 at 50 000 ft,

450/570 or 0.77 at 40 000 ft,

450/590 or 0.76 at 30 000 ft,

450/616 or 0.73 at 20 000 ft,

450/640 or 0.70 at 10 000 ft,

450/666 or 0.68 at sea-level.

This means that if the critical Mach Number were 0.7 an aircraft that was shocked stalled at 50 000 ft would become unstalled at a height of about 10 000 ft.

Even if the true speed were to increase during the dive, as would probably happen in practice, there might still be a drop in Mach Number.

This consoling feature of the problem is based on the assumption of rise in temperature with loss of height – if the temperature does not rise, that is to say, if there is an inversion, well the reader – and the pilot – can calculate what will happen!