You may be surprised, but hypersonic vehicles are modeled just like airplanes. The framework of Lanchester10 applies even here. However, to gather the aerodynamic data is a gargantuan task. The greatest challenge is probably the SSTO vehicle. It takes off at low subsonic speeds, transitions through the sonic barrier to the supersonic regime, and, after about Mach 5, enters the hypersonic region. Eventually, the air density becomes so small, at about 100 km, that the aerodynamic effects are essentially nil.
It would be nice to have the resources to gather the data in wind tunnels. It takes three different facilities (subsonic, supersonic, and hypersonic) to cover the flight regimes. Yet, even then one has to make compromises. It is difficult to match the wind-tunnel’s Reynolds number with free flight, and the Mach number tops out at about 10. You may take recourse to the highly touted computational fluid dynamics Mafia. However, their supercomputers devour your budget as well, and they will still send you back to the transonic tunnel to fill in the gaps.
There is a third option available to you. Since the dawn of the computer age and the maturing of the FORTRAN language, aerodynamicists have condensed their knowledge in semi-empirical codes. We already have met the Digital DATCOM
3B
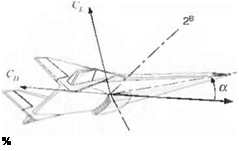
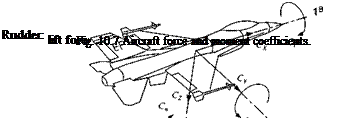
Fig. І0.8 Hypersonic vehicle lift and drag coefficients.
for aircraft and the Missile DATCOM programs. Both operate from dimensioned vehicle data using analytical formulas and interpolated wind-tunnel databases. In the early 1970s, so-called panel methods were developed, which are particularly useful in the supersonic and hypersonic regimes. Best known is the U. S. Air Force Supersonic/Hypersonic Arbitrary Body Program (S/HABP),12 which is very popular with industry. It was upgraded in the late 1980s by McDonnell Douglas, St. Louis,13 and is based on the impact pressure calculation method, which is most accurate at hypersonic speeds. Its capabilities, including viscous effects, extend down into the supersonic regime using so-called embedded flowfields.
Another semi-empirical code, the so-called PAN AIR method,14 is NASA’s contribution to supersonic and hypersonic aerodynamic prediction. It solves the linear partial differential flow equations numerically by approximating the configuration’s surfaces by panels. PAN AIR is a higher-order panel method that is limited to inviscid flow.
NASA’s Generic Hypersonic Aerodynamics Model Example (GHAME) serves us as a test case.15 It is a hypersonic vehicle that takes off horizontally under turbojet propulsion. Once at Mach 2 the ramjet propels the vehicle to Mach 6, at which the scramjet takes over until the limits of the atmosphere are reached. The aerodynamic model was developed with the S/HABP code and from experimental data based on the space shuttle and the experimental vehicles X-24B and C.
Contrary to the FALCON6 model, GHAME aerodynamics uses lift and drag as force components, as depicted in Fig. 10.8. Not shown are the side force and the moment conventions because they remain unchanged. The NASP-like vehicle is controlled by rudder and two elevons: Svi, left and 8vr, right. The elevons function as ailerons 8a and elevators 8e according to the relationships
The aerodynamic forces are given in stability axes (see Sec. 3.2.2.5)
[T,S=qS[-CD CY -CL
whereas the moments are in body axes as before
[mB]B = qS[Ci x b Cm x c C„ x b]
NASA formulated the aerodynamics by simple Taylor-series expansion, including only the linear terms and making all derivatives tabular functions of Mach number and angle of attack:
 Cl = CLll(M, a) + CLJM, a)a + CLJM, a)8e + CL (M, a)q
 Cd — Cd0(M• «) + CDam, a)a
CY = CYn(M, a) + CYll(M, u)P + CyJM, a)8a + CYil (M, a)Sr
Yet, by no means do these equations represent a linear model. Look at the lift slope derivative C/.u(Af, a). It is a tabular function of a and is multiplied again by a. The same is true for the drag derivative CDa(M, a). The other derivatives are linear in terms of the remaining states, but still nonlinear in Mach and a. The effect of body rates on the lift and side forces, i. e., the Cl, CY, and CYr derivatives, can often be neglected.
The moment coefficients follow a similar pattern:
C, „ = a) + C„,a(M, a)a + CmJM, a)8e + Cmq(M,
C, = Ci„(M. a) + С/р(М, a)P + a)8a + Chr(M, a)8r
+ Clr(M, a)p^+Cli(M, a)rA (10.66)
c„ — C„0(M, a) + C„,(M, a)P + CnJM, a)8r + C„fo(M, a)Sa + C„p(M, a)p^ + Clh(M, a)r^
All four terms in the pitching moment coefficient Cm are important. Yet, the rolling and yawing moment coefficients С/ and Cn usually have negligible trim coefficients C/„ and C„„. In effect, Fig. 7.1 predicts that they are zero. Notice the strong cross coupling between the rolling and yawing moments. It occurs through the famous Dutch-roll derivative and the body rates p, q and the controls 8a, Sr.
We are fortunate that NASA has provided us with complete tables. If you want to get a feel for their numerical values, you can turn to the CADAC GHAME6
simulation and consult Module A1. Now, finished with these aircraft-type vehicles, we turn to missiles with tetragonal symmetry.
10.2.1.3 Missiles. Most missiles have simple geometrical shapes. In rocketry the four fin, axis-symmetrical configuration, first fashioned by Wernher von Braun as the V2, are prevalent still today. Air-to-air missiles like ASRAAM and AMRAAM exhibit this tetragonal symmetry, as well as our CADAC SRAAM model.
The tetragonal symmetry fosters the expression of the aerodynamics in aerobal- listic axes. Refer back to Fig. 3.18 for the definition of the total angle of attack a’ and aerodynamic roll angle ф’. Both replace the standard incidence angles a and fi. The aerodynamic forces and moment are expressed in coefficient form in aeroballistic coordinates ]R
[‘I, f = qS[-cA c’y – c;v]
W~B]R=qSi[C, c; C’]
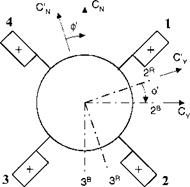
where q is the dynamic pressure, S the reference area (cross section), / the reference length (diameter), and the prime refers to the aeroballistic axes. Figure 10.9 depicts the positive sense of these coefficients. Pay particular attention to the positive direction of the aerodynamic roll angle ф’. It is taken positive from the aeroballistic axes to the body axes. Also notice that the axial force and the rolling moment coefficients are invariant under this transformation.
The functional dependency of a given configuration is reduced to the following form:
Ca = f(M. Sq’. Sr’. power) С/ — f(M. а’, ф’, p, Sp)
C’Y = ДМ, а’,ф’,8г’) C’m =/{М. а’.ф’. c. g., q’.Sq’)
C’v = f(M. а’, ф’. Sq’) C’n = f(M, а’. ф’, c. g., r’, Sr’)
where the Reynolds and incidence rate dependencies were neglected.
The body rates p. q’. r’ and the control commands Sp, Sq’. Sr’ are expressed in aeroballistic coordinates ]R and obtained from body coordinates by the
|
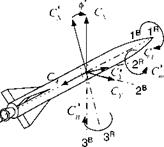
Fig. 10.9 Force and moment coefficients in aeroballistic axes.
|
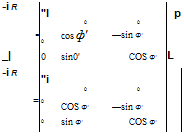


P
q’
r’
Sp
Sq’
Sr
The control commands require further explanations. The starting point is Fig. 10.10 with the convention of positive surface deflections. For reinforcement I have also included again the positive direction of the aerodynamic roll angle ф’. Because there are four fins, but only three attitude degrees of freedom, we combine them mathematically to form the three control commands
Sp = ±(-<51 -82 + 53 + <54)
Sq = ±(<51 +52 + 53 + 54) (10.68)
Sr = ±(-<51 +52-53+54)
A fourth combination is also possible, but it produces only drag and no control moment. Look at Fig. 10.10 and work out the three relationships. Four positive fin deflections create a positive pitch command; the first two fins up and the last two fins down generate a positive roll command; and alternating the fin deflections causes a positive yaw command. This convention is in agreement with aircraft practices and is summarized in the following equations.
Roll:
+8p —»■ +Д L rolling moment
Pitch:
+Sq —*■ +AN normal force
Yaw:
+<5r —>■ +ДТ side force
Now we are ready to expand the coefficients. Please refer to Eq. (10.69). The axial force coefficient CA consists of the base and skin friction drag СЛо and the power on/off effect AC a- Furthermore, it has a first-order term in a’ and a second – order three-dimensional table look-up in <5eff = (8q + <5r1 )/2 fthe effective fin deflection). You can see that great care has been taken to model the axial force because its fidelity determines the fly-out range of the missile. The side force and normal force coefficients C’Y and C’N are dependent on the roll orientation of the missile relative to the load factor plane, described by the angle 0′ (ф1 = 0 when the missile maneuvers in the cruciform configuration):
Ca — CAo(M) + AC,4(p0wer)(M) + САиЛМ)а’ + C/sj2rf (M, a’, <52ff)<52ff
Су — АСуф,(М, a’) sin4<£’ + C’Yg (M, a’)8r’ (10.69)
C’N = Сд,„(М, a’) + ДСд,_0.(М, a’) sin2 2ф’ + C’V^(M, a’)8q’
Inspecting Eq. (10.69), you see that this dependency is modeled by sine functions. Both terms, sin 40′ and sin2 0′, are periodic every 90 deg, corresponding to the tetragonal symmetry of the missile. However, the increment in side force reaches its maximum at 22.5 deg and its minimum at 67.5 deg. The normal force effect is always positive and reaches its peak every 45 deg. Realize that in aeroballistic axes the side force component is always small because, by definition, the missile responds in the load factor plane. Any perturbations caused by rotational asymmetries are of second order and are many times just neglected. The other terms in Exj. (10.69) are the control effectiveness derivatives Cy_ and C’N.
The moment coefficients are modeled in a similar fashion. They consist of primary terms, damping derivatives, control effectiveness, and c. g. adjustments. The primary roll term C;,^ ,(M. a’)a’2 sin 40′ of Eq. (10.70) is an attempt to model the roll coupling caused by vortices impinging on the tail surfaces at high angles of attack. It is dependent on the roll orientation of the missile, sin 40′, which we encountered already in the C’y coefficient:
Cl = CI<2(M, a)aa sin40′ + С/ДМ, or’)^ + Chp(M, a’)8p
+ a’)5q’- -f(*cg, fi – Mg)
This yaw-roll coupling is 90-deg periodic in <p’, causing a positive or negative rolling moment, depending on the orientation of the fins relative to the load factor plane. The other two terms of the rolling coefficient bear no surprises.
The pitching moment coefficient, similarly affected by the orientation of the load factor plane, possesses a perturbation term ЛС’г ф,(М, a’) sin2 2ф’. It vanishes at 90-deg increments between maxima. The yawing moment coefficient C’ repeats the pattern of С/.
To adjust for weight shifts during flight, the pitching and yawing moment must be corrected for the shift in c. g. Just like the aircraft equations (10.62), the adjustment is made with the moment arm (xcg д> — xcg), where лС1, д> is the reference location (at launch or from wind-tunnel tests.) and xcg the true location.
I have presented to you just one missile model, which is quite useful for preliminary performance studies. It has been adopted for many air-to-ground and air-to-air simulations and linked with the Digital DATCOM aerodynamic prediction program. If you want to see it in action, you should refer to the CADAC SRAAM6 simulation, study the Module Al, and run the test cases.
10.2.1.4 Summary. The three aerodynamic models, although limited in sophistication, should give you an appreciation of the six-DoF treatment of aerodynamics. There is a distinct difference between aircraft and missiles, corresponding to their respective symmetries. Planar vehicles are modeled with the Cartesian incidence angles a and /3, whereas tetragonal missiles lend themselves to the treatment with polar incidence angles a’ and ф’. However, you will find many missile simulations that use also the Cartesian incidence angle scheme. Next time you get your hands on a six-DoF simulation, see if you recognize some of the modeling features of this section.








 +ALL rolling moment
 = [Г]°/[иІ]° + [П£/]/М/ (10.58)