Category Noise Sources in Turbulent Shear Flows

Turbulence-Impingement Noise Results

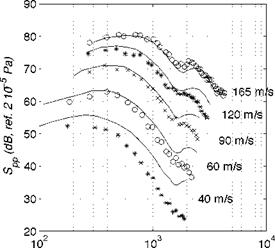
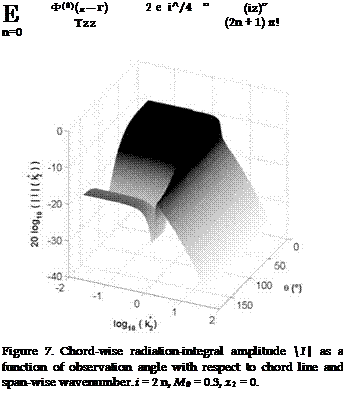
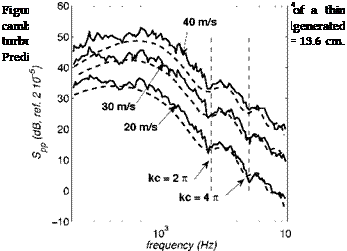
The figure 18 reproduces turbulence-impingement sound spectra for a NACA-0012 airfoil embedded in grid-generated turbulence, as reported by Pa­terson & Amiet (1976). The airfoil is mounted between end-plates at the nozzle of an open-jet anechoic wind tunnel and the noise is measured in the mid-span plane. Model predictions are superimposed on the sound spectra for different flow speeds. The agreement is found very good at the highest speed whereas the sound is clearly overestimated at the lowest flow speeds. The same experimental protocol repeated on a smaller set-up with a thinner airfoil of maximum thickness 3% at three flow speeds provides the results reported next in Fig. 19. Obviously the overall sound level and frequencies both increase with increasing flow speeds but humps and dips are seen al­ways at the same frequencies, at Helmholtz numbers close to 2 n and 4 n. The dips are attributed to interference fringes caused by chord-wise non­compactness and therefore do not depend on the flow speed (at least at the low Mach numbers investigated). They correspond to the same pattern il­lustrated in Fig. 7. A similar dip is observed in Fig. 18. But unlike the ones of the NACA-0012, the model predictions based on the same analytical for­mulation are now found very close to the measurements despite the low flow speeds. This difference is attributed to the thinner airfoil design, 3% against 12%. Various authors recognized that thick rounded leading edges have a reduced response to oncoming turbulence at sufficiently high frequencies. This is especially prominent for some cross-sections of wind-turbine blades,

Turbulence-Impingement Noise Results

Frequency (Hz)

Figure 18. Turbulence-impingement noise spectra of a NACA-0012 airfoil from Paterson & Amiet (1976). Grid­generated turbulence, observer at 90° in the mid-span plane. c = 23 cm.

the relative thickness of which reaches 15% or 18%. The reduction occurs intuitively when the incident turbulent eddies are smaller than the airfoil leading-edge thickness or curvature radius. Such small eddies are deviated by the mean streamlines instead of being scattered at the edge. If Amiet’s theory is assumed to hold for vanishing thickness or at least as long as the characteristic lengths of the turbulence exceed the thickness at the lead­ing edge, comparing the response of different airfoils to the same incident turbulence provides a way to quantify the reduction due to thickness effect.

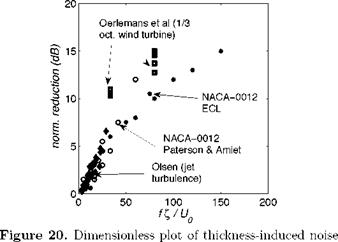
Data gathered from various investigators are found to collapse reason­ably, at least over an extended range of parameters, provided that they are plotted in a corrected form to account for the variety of experimental con­ditions, as shown in Fig.20 reproduced from Roger & Moreau (2010). The reduction is divided by the ratio (e/c) / (e/c)ref and plotted as a function of the variable f£/U0 where £ = (A/c)ref / (Л/c), the index ref standing for the NACA-0012 airfoil in the experiment of Paterson & Amiet (1976) taken as reference.

The amount of reduction in dB is almost proportional to thickness and to

Turbulence-Impingement Noise Results

frequency. The reduction also depends on the experimental set-up, mainly the grid-mesh size used to generate the turbulent field. The reasonable collapse of the figure can be used to empirically correct analytical predictions based on a thin-airfoil assumption.

Globally, turbulence-interaction noise at any subsonic Mach number is well predicted by Amiet’s analytical model for velocity disturbance rates of less than 10%, relative thicknesses of a couple of percent, and moderate cambers. The mean load, or equivalently the actual angle of attack neglected in the linearized theories of unsteady aerodynamics, has no noticeable effect for a thin and slightly cambered airfoil over a large range of realistic values, provided that the oncoming turbulence is nearly homogeneous and isotropic. Recent developments also indicate that the precise design of an airfoil is more sensitive when the incident turbulence departs from ideal homogeneity and isotropy (Staubs et al (2008)).

Turbulence-Impingement Noise Results

reduction for thick airfoils in incident turbulence, according to various investigators. Oerleman’s and Olsen’s results reviewed by Roger & Moreau (2010).

Scaling Laws and Experimental Validations

6.1 Scaling Laws and Asymptotic Trends

Scaling laws in aeroacoustics are often used as empirical prediction means. They can be obtained either from experimental data bases or from theoretical arguments. In the first case, the point is that the laws may fail when applied to configurations not covered by the original data base. The theoretical background is more reliable. Scaling laws are discussed in this section for turbulence-interaction noise and trailing-edge noise, from the aforementioned analytical models. They are based on the very important assumption that the flows are self-similar. This is very often so in practice because unsteady flows exhibit higher frequencies and levels with increasing mean-flow speeds. Typically the frequency is proportional to the mean flow speed U0 and can be made dimensionless by introducing a Strouhal number St = fl/Uo based on a relevant length scale l. Depending on the con­figuration, the fluctuating velocity amplitudes can be also proportional to the mean flow speed, or not (especially for three-dimensional flows, highly Reynolds-number dependent flows…). Therefore the PSD of the acoustic pressure is divided by U0 where the exponent n is to be determined. Afore­mentioned analytical models state that the acoustic intensity is proportional to the mean square value of the forcing disturbance, w1rms or P2ms, to its span-wise correlation length £y and to the span-wise extent of the edge L. The derivations assume that the ratio £y/L is small. Furthermore the inci­dent disturbances must have the properties of homogeneous and stationary random processes. Examples will be given in the next section.

The asymptotic high-frequency trend for turbulence-impingement noise is derived by only retaining the first term I of the radiation integral, since the trailing-edge correction gets smaller and smaller. For kc = 2 Mp Щ ^ ж and accounting for the developments of Fresnel integrals (Abramowitz & Stegun (1970)), some algebra leads to

Spp _ pi Up L Mo cos2(ee/2)

_ nR2 (1 + Mo cos ве)3

Scaling Laws and Experimental Validations Подпись: p2 Up n L Mo ( 2 sin2 9e 8 в2 R2 ( C) (1 + M0 cos 9e)4 '

with S0 = Re (1+Mo cos 9e). The result is expressed in emission coordinates with respect to the surrounding flow for the sake of a better physical insight, and 9e is the observation angle from the streamwise direction (see chapter 2 for definitions). In the limit of small Mach numbers M2 ^ 0, a cardioid directivity pattern is found. The sound goes to zero upstream at small angles close to the airfoil plane and is maximum downstream. For the low- frequency limit, Amiet’s formalism must be replaced by Sears’ theory and the radiation integral reads I = S(k/e2)/в. Small values of kc and reasonable values of Mo make the function get close to 1, so that now the ratio becomes

The radiation is that of a compact dipole in motion, zero in the plane of the airfoil and maximum in the normal direction. Except that it is not specified in the mid-span plane, the general case illustrated by the sample results of Figs. 7 and 8 is between the two asymptotic regimes. Apart from the change in the directivity, the exponent of convective amplification is also found to go from 4 to 3 from low to high frequencies because of increased non-compactness.

A similar analysis for trailing-edge noise only makes sense for the high- frequency limit. In this case, introducing the convection Mach number Mc = Uc/c0 yields the result

Spp _ LMc sin2 (9e/2)_________ 1 – (Mp – Mc)

Фрр ty n2 R2 (1 + Mp cos 9e) [1 + (Mp – Mc) cos 9e]2

in which the last factor has a secondary importance, especially for low-Mach number applications. The opposite cardioid trend to leading-edge noise is found, no sound being radiated downstream and a maximum radiation upstream. Both results are in accordance with what is expected from the half-plane Green’s function for a distant observer and a source located close

to the edge. In the limit of high frequencies, what happens at one edge radiates as if the complementary edge was removed to infinity. Trailing-edge noise radiates preferentially upstream and turbulence-impingement noise preferentially downstream.

Even though different in essence, both vortex-shedding noise and trailing – edge noise have common features because the underlying vortex dynamics responsible for sound radiation takes place in the very vicinity of the trail­ing edge in terms of emitted wavelengths. As a result if the radiation is interpreted as quadrupole sound according to Lighthill’s analogy it tends to obey the asymptotic half-plane Green’s function and produce a cardioid pat­tern. The present statements using Schwarzschild’s technique adopt Ffowcs Williams & Hawkings’ interpretation and directly address the equivalent dis­tributed dipoles the radiation of which is defined by the free-space Green’s function. Again it is verified that both interpretations provide the same result.

Vortex-Shedding Noise Model

Подпись: Spp(xi v) Подпись: po kcx3 UQ 2 SO Vortex-Shedding Noise Model Подпись: (19)

For vortex-shedding noise the far-field pressure PSD reads

and only refers to the narrow-band spectral signature. The expression looks very similar to the one of turbulence-impingement noise because the mathe­matical statement also relies on velocity disturbances as the origin of sound. Here Sww is the PSD of the upwash velocity w in the near wake and ly the corresponding span-wise correlation length. It must be noted that the quantity Sww refers to a disturbance field which is not homogeneous in the direction normal to the wake, therefore the definition of input data for the formulation is questionable. The obvious choice is taking the information
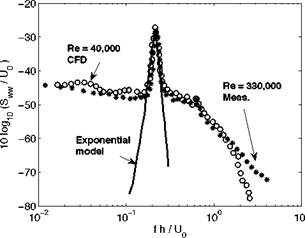
on the wake center-line where it is at its maximum. Moreover the formation of von Karman vortices at the back edge of a body requires a finite stream – wise distance which influences the induced loads. The situation is clear in the case of a rectangular trailing-edge for which the flow detaches from the corners, taken below as example. Two sets of data obtained from differ­ent methods and referring to different Reynolds numbers of the flow over a flat plate a zero incidence are compared in Fig. 17. The power spectral density of the upswash is evaluated at twice the plate thickness h down­stream and assumed representative of the forcing quantity. It is deduced from incompressible LES performed over a limited span-wise extent for the low-Reynolds number case, and directly measured by hot-wire anemometry in the large-Reynolds number case. For the latter a slight frequency shift has been applied to account for some confinement effect in the experiment. A very good collapse is obtained by plotting the reduced PSD Sww/U0 as a function of the Strouhal number fh/U0. This allows proposing a model exponential fit in logarithmic frequency scale, to be used as input data.

Vortex-Shedding Noise Model

Figure 17. Upwash velocity spectra in the near wake of a flat plate as predicted by LES at low Reh of 4,000 (from Roger et al (2006)) and as measured at high Reh of 330,000 (unpublished ECL data, French Program SAMBA).

The associated correlation length has been assessed in the experiment from wall-pressure measurements closely upstream of the trailing edge, as­suming that it is the same here and in the near wake by virtue of the continuity of the flow. It is quite large at the vortex-shedding frequency and drops rapidly besides. A consistent model fitted on measured data for the coherence has been found as

— е-(С/Ло)2 e — aы— w°|

where a is some constant, around 0.012/(2n) at the Reynolds number of

4.0 based on the trailing-edge thickness. The corresponding correlation length reads £y (w) = J n/2A(w), with Л = Ao e-a|ш-ш°і and Ao — 7 h.

Because the scaling of Fig. 17 is perfect with regard to the differences of dimensional parameters, it is considered reliable. However it holds only for zero angle of attack and a rectangular trailing edge. Other shapes such as beveled edges would possibly exhibit different features.

Trailing-Edge Noise Model

The corresponding PSD of the far-field sound reads

„ , . (кхз Lc 2 ш

Trailing-Edge Noise Model Подпись: 7 (2U k> Trailing-Edge Noise Model

Spp(x, w) = (iTSir) c J_По(U, k* (17)

It is written here in non-dimensional variables, introducing the wavenumber spectrum of the wall-pressure fluctuations

По(Ш, к*) = – Фрр(ш) £y(к*,ш),

U c п

where Фрр(ш) is the wall-pressure PSD induced closely upstream of the trailing edge by the incident turbulence only (ignoring contamination by the Kutta condition) and £y(k*,u>) is the correlation length defined from the coherence function between two span-wise locations щ apart from each other as

£y (k*,ш)= у/72(П2,ш) cos(k2 П2) d^2 .

о

Подпись: Spp(x,ш) Trailing-Edge Noise Model Trailing-Edge Noise Model Trailing-Edge Noise Model

The associated long-span approximation reads

The key practical issue is to get a relevant information on Фрр(^) and £y(Щ, ш). Very different flow conditions are encountered in engineering applications, corresponding to different wall-pressure statistics: attached turbulent boundary layers with more or less pronounced adverse pressure gradients, intermittently separated flows, re-attached flows after leading – edge separation and so on (in principle separated flows are out of the scope of usual trailing-edge noise modeling, except if the trace of the turbulence in terms of wall pressure still exhibits a phase convection speed in the stream- wise direction). The source information is reconstructed in experimental studies by interpolation from measurements on a cluster of wall-pressure sensors. Span-wise distributed sensors are needed to give partial access to the correlation length, and chord-wise sensors are needed to evaluate the convection speed Uc involved in the transfer function I. When small-scale mock-ups are tested in wind tunnels, the size of the sensors causes resolution issues that limit the relevance of the measurements; furthermore very thin areas such as the vicinity of the trailing edge are difficult to implement. This makes eq. (17) and eq. (18) more difficult to feed with reliable input data when compared to the equivalent expressions for turbulence-impingement noise.

Caution is required if Computational Fluid Dynamics is used to simulate the flow. At moderate Mach numbers, incompressible LES is the minimum required computational effort, but it may be not affordable. A possible alternative is resorting to RANS (Reynolds-Averaged Navier-Stokes) com­putations to infer the inner and/or outer scales of the boundary layers, and reconstructing the quantities Фрр and £y via empirical laws previously tuned on experimental data bases. This approach still needs being com­forted, facing the wide variety of possible flows encountered in rotating blade technology. Furthermore wall-pressure fluctuations are caused by turbulent patterns developing at different heights in the boundary layer and traveling at different convection speeds. Larger and faster eddies are farther away from the wall whereas smaller and slower ones are convected at shortest distance. In the same time larger or smaller eddies define lower or higher frequencies at same convection speed. This intricate mechanisms make the wall-pressure statistics difficult to analyze. Schematically arbitrary low fre­quencies can be produced by small-scale turbulence convected at very low speed. But eddy size is limited by boundary layer thickness, so that the correlation length is expected to drop at vanishing frequencies.

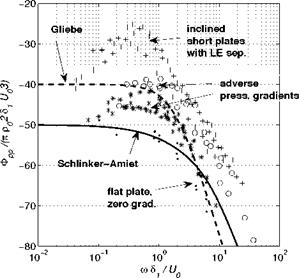
Wall pressure statistics is addressed more specifically in chapter 6. Com­plementary considerations are presented in the present section for trailing – edge noise applications. Wall-pressure spectra Фрр measured beneath bound­ary layers over flat plates and/or curved airfoil surfaces with more or less pronounced stream-wise pressure gradients are first reported in Fig. 13 in dimensionless variables taking the displacement thickness as parameter. For finite-chord airfoils the measurement has been performed close to the trail­ing edge. Developed turbulence over a flat plate with zero pressure gra­dient (small dots) often taken as reference is found to produce the lowest fluctuations. In contrast an adverse pressure gradient causes a significant increase, more especially at lower frequencies, up to 10 or 20 dB. This has been observed by many investigators, on both large plates and airfoils, and certainly depends on many parameters, such as curvature and gradient strength. More especially leading-edge separation followed by reattachment is found to produce the highest levels, with a wide low-frequency bump. This flow regime is typical of thin or roughly designed leading-edges in fan – noise technology, for which off-design conditions can be encountered.

Trailing-Edge Noise Model

Figure 13. Wall-pressure spectra measured beneath tur­bulent boundary layers, with or without pressure gradient, made dimensionless by outer variables, from Keith et al (1992) and ECL flat-plate data. External-variable models plotted for comparison.

Model wall-pressure spectra can be built up based on boundary-layer parameters. A review dedicated to aeronautical fan-noise applications has

Подпись: or Ф pp(f )Подпись: ФРР(/) nPo *1 Щ ’

Подпись: фрр(ш) Po <*1 U0
Подпись: ^ рр(ш)

been proposed for instance by Gliebe et al (2000). Substantial differences might be expected for low-speed cooling fans. First reported attempts for the definition of universal statistical models are based on the use of outer boundary-layer variables to scale the wall-pressure spectrum, as

where the second form is directly expressed in terms of frequency. Schlinker – Amiet’s model reads

Фрр(ш) = 10-5 (1+ ш +0.217Ш2 +0.00562а4)-1, ш = ш51/и0

and Gliebe’s et al model

Фрр(ш) = 10-4 (1 + аш2) 5/2 ,

Подпись: рр Подпись: фрр U0 *1 тр Подпись: ш2 (ш2 +0.0144) 3/2 ,

where а is 0.5 in the reference, and is better replaced by a smaller value, here 0.3 to fit with the low-Mach number results of Fig. 13. Both provide constant values at vanishing frequencies, abusive in view of some measure­ments, and asymptotic high-frequency trends like ш-4 and ш-5. The former and the latter hold for zero and adverse pressure gradients, respectively. The alternative Chase-Howe model based on inner variables (not plotted here) is expressed as

where тр is the wall-shear stress. It is known to yield better high-frequency collapse and reproduces some low-frequency decrease. In counterpart the wall-shear stress is of more difficult access for practical applications. The large scatter of data in Fig. 13 suggests that model predictions could be very sensitive to the pressure gradient associated with aerodynamic loading. Yet this gradient does not enter explicitly the definition of aforementioned models. An improved model including the pressure gradient and based on mixed variables has been proposed very recently by Rozenberg et al (2012). The assessment on extended sets of experimental data still requires further investigation.

The correlation length is another matter of concern for sound predictions. For developed turbulence in boundary layers with zero pressure gradient,

Corcos’ model is often used. The corresponding expression reads

Подпись:u/(bcUc)

Щ + u2/(bcUc)2 ’

Подпись: і 0.9 0.8 0.7 'V06 О S 0.5 a) 8 04 0.3 0.2 0.і 0 Trailing-Edge Noise Model
Trailing-Edge Noise Model

where bc is a constant, and essentially states that the correlation is inversely proportional to frequency (at least for parallel gusts k2 =0). This property is not physically consistent at very low frequencies. Indeed low frequencies naturally correspond to large scales and scales larger than the boundary layer thickness cannot be found.

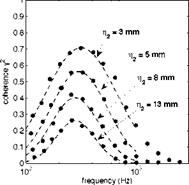
Figure 14. Evidence of a log-normal distribution of the span-wise coherence as a function of frequency. Left: measured data on a thin, moderately cambered rotating blade, from Rozenberg et al (2008). Right: reference data of Brooks & Hodgson (1981).

Подпись: 72 (f) Подпись: A2 a f Подпись: [ln f-ln fo]2/(2 a2)

Evidence of a relevant Gaussian distribution of the coherence as a func­tion of frequency on a logarithmic scale is reported in Fig. 14. The left-hand side plot refers to wall-pressure measurements directly made on the blades of a low-speed axial fan, from Rozenberg et al (2008). They are compared to a theoretical fit that obeys the log-normal law

in which the parameters A, f0, a appear as functions of the span-wise sep­aration. Only retaining the variations of A as dominant makes the same
qualitative variations expected for the correlation length. A similar be­havior is reported by Roger & Moreau (2004) about the development of a rapidly growing boundary layer close to the trailing edge of a Controlled – Diffusion airfoil, in a flow regime identified as ’distributed vortex shedding’ (see Fig. 22-d later on). In such a case, believed representative of many airfoils in real applications, the mean flow remains attached but vortical patterns are progressively shed along the suction side in the aft part of the airfoil. In fact Corcos’ model fails at very low frequencies but often pro­vides a consistent estimate of the coherence or of the correlation length at middle-and high frequencies. If the low-frequency range is not accessible as in some wind-tunnel airfoil testing setups because of installation effects or background noise issues, this model remains acceptable provided that tur­bulence in the vicinity of the trailing-edge is close to homogeneity. Other coherence measurements performed at two different speeds by Brooks & Hodgson (1981) on a NACA-0012 airfoil are shown on the right-hand side plot of Fig. 14. The log-normal frequency distribution is confirmed, with some similarity according to a Strouhal-number scaling.

Other data recently reported by Fischer (2012) also exhibit the drop of the coherence and of the correlation length at low frequencies, for airfoils dedicated to wind-turbine applications. Typical correlation lengths as de­termined by Rozenberg and Fischer are plotted in Fig. 15, in the upper and lower plots respectively. Bump-shaped distributions expected from the log-normal profiles are found. The data of Fig. 15-a refers to clustered wall – pressure probes mounted in the tip region of a blade and close to mid-span, for two stagger angles of the blades triggering different flow regimes. The physical behavior is the same but the involved characteristic scales are dif­ferent. In Fig. 15-b, the NACA 64-618 airfoil is tested at different flow speeds. The frequency is scaled by the Reynolds number, proportionally to some Strouhal number, and the correlation length by the square root of the Reynolds number, quite arbitrarily. Classical laws for boundary layers do not make a perfect collapse expected this way, because the transition oc­curs at different locations on the airfoil suction side at different flow speeds. Anyway the results suggest that modeling the correlation is achievable but still remains an open issue. Other reported variations of £y with the angle of attack suggest that again the pressure gradient should enter the scaling pa­rameters. Physical considerations lead to accept that the correlation length £y must be proportional to boundary-layer thickness.

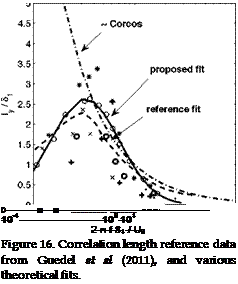
The non-dimensional plot of Fig. 16 attempts in pointing evidence of such a proportionality, but the reported data exhibit significant scatter. Determinations of both £y and di suffer from uncertainties because of ei­ther numerical or experimental resolution issues. The average theoretical

fit proposed by Guedel et al (2011) and another fit deduced from the log­normal model assuming variations of A only with the span-wise separation

Подпись: 0 ■—■— ~~~ 10-1 100 101 2 n f 81 / U0 Figure 16. Correlation length reference data from Guedel et al (2011), and various theoretical fits.

are added on the figure. Both are acceptable assumptions for acoustic pre­dictions in terms of decibels. In contrast Corcos-like fitting is not, at low frequencies. Extrapolated values at high frequencies for which measure­ments cannot be achieved lead to significant differences. At 2 n f S^/Uq = 4 in Fig. 16 the new proposed fit produces 12 dB less than the other two, therefore the choice of theoretical model becomes crucial.
Application to Airfoil Broadband Noise Modeling

The equivalent source distributions derived analytically in previous sec­tions are now used for a statistical description of the far-field noise. For tonal noise predictions, they would be applied directly. It must be noted that the theoretical background of Amiet’s theory and equivalent formula­tions ignore the aerodynamic wavenumber of the incident disturbances in the direction normal to the airfoil plane, say k3. This together with the flat-plate assumption is considered enough for most broadband noise mod­eling purposes. More sophisticated and fully three-dimensional approaches

are possible, but they are beyond the scope of the course and most often not tractable anymore by analytical methods.

5.1 Statistical Turbulence-Interaction Noise Model

Application to Airfoil Broadband Noise Modeling Подпись: (15)

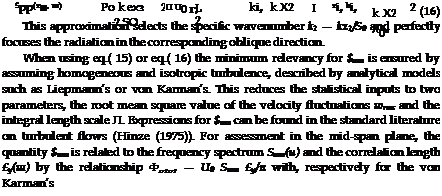
Once the radiation integral corresponding to a single gust is obtained from the distributed unsteady lift analytically, the power spectral density (PSD) of the far-field sound pressure Spp is related to the statistics of the upstream turbulent velocity field via spectral turbulent models used as input data. The complete formulation for a rectangular airfoil reads

Application to Airfoil Broadband Noise Modeling

where §ww is the two-dimensional wave-number spectrum of the turbulent velocity component normal to the airfoil. The full expression is required for short-span airfoils, most often encountered in rotating blade applications. For large-span airfoils, typically high-lift flaps such that the aspect ratio L/е ^ ж, an approximate expression follows from the equivalence of the sine-cardinal function with Dirac’s delta function, as

Application to Airfoil Broadband Noise Modeling

It is worth noting that the wall pressure field does not enter the formu­lation directly though it is the equivalent source of the sound according to the acoustic analogy. In fact resorting to unsteady aerodynamic theories displaces the needed input data from lift fluctuations to incident velocity fluctuations. In this interpretation the airfoil acts as a converter of velocity disturbances into acoustic pressure waves.

Подпись: Suu(+) Application to Airfoil Broadband Noise Modeling Подпись: Suu(w) Подпись: u2 Л 1 rms п UQ 1 + k2 Л2

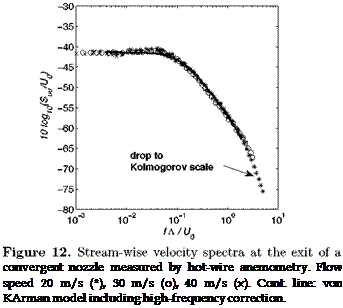
The statistics of the upwash component is not of easy access in ex­periments because it requires using for instance cross-wire two-dimensional anemometry. Single hot-wire anemometry is more tractable but it provides only the power spectral density of the stream-wise velocity component Suu. The information on Sww can be reconstructed from Suu by fitting the pa­rameters (urms, Л) of one of the aforementioned turbulence models on the measurements, with wrms = urms. This is done typically in the experiments mentioned in the next section, in which airfoils are tested in grid-generated turbulence. Model expressions for Suu according to von K+rman and Liep – mann are respectively given as (Hinze (1975))

Подпись: convergent nozzle measured by hot-wire anemometry. Flow speed 20 m/s (*), 30 m/s (o), 40 m/s (x). Cont. line: von KArman model including high-frequency correction.

A typical check against hot-wire measured spectra is reported in Fig. 12. The measurements are made in the presence of a turbulence grid placed upstream of the nozzle contraction in an open-jet wind tunnel, at different speeds. The distance to the grid is too short for obtaining ideal homoge­neous and isotropic turbulence but ensures a higher fluctuating level. The agreement is not perfect but well satisfactory enough for acoustic applica­tions. By the way the collapse in non-dimensional variables confirms that grid-generated turbulence is a self-similar flow. For a better consistency a correction can been applied to force the model spectral envelope to decrease at the highest frequencies towards the Kolmogorov scale, if these frequencies effectively contribute to the sound.

Application to Airfoil Broadband Noise Modeling Подпись: 3 K * Подпись: л ~ Подпись: (2K/3)3/2 є

If turbulence parameters must be estimated from RANS simulations, they are related to the turbulent kinetic energy K and the dissipation є as

Reliability issues remain when non-homogeneous turbulence is addressed or when the local turbulence parameters vary over distances which are not

large when compared to the airfoil chord. For instance, the predictions of turbulence-impingement noise of a ring-airfoil placed in the mixing layer of a round jet reported by Roger (2010) are based on measured Suu turbulent spectra. For a ring of same diameter as the jet, the predictions compare very well with the measurements, because turbulence in the middle of the jet shear layers is quite close to homogeneity. In contrast the disagreement observed with smaller or larger rings is attributed to significant departure from homogeneous and isotropic turbulence away from the center shear layer. In another context, the complex flows developing over high-lift devices of aircraft wings such as deployed flaps also exhibit strong variations in the vicinity of the flap leading edge; applying the methodology in such a case becomes questionable.

Vortex-Shedding Noise – The Reversed Sears’ Problem

Vortex-shedding noise is referred to in this chapter as the generation of sound by the formation of structured vortices, such as a von HArman street, downstream of a blunted airfoil trailing edge. The mechanism differs from aforementioned trailing-edge noise produced by vortical patterns already present upstream in the developing boundary layers (note that yet some authors use the same terminology). As stated by Brooks & Hodgson (1981), the occurrence or not of structured vortex shedding is a matter of compared values of the physical thickness of the trailing edge h and of the boundary layer displacement thickness V Typically the vortex street cannot develop if h/5 < 0.3. Vortex shedding is known to radiate narrow-band noise

Vortex-Shedding Noise - The Reversed Sears’ Problem Vortex-Shedding Noise - The Reversed Sears’ Problem Vortex-Shedding Noise - The Reversed Sears’ Problem Vortex-Shedding Noise - The Reversed Sears’ Problem
Vortex-Shedding Noise - The Reversed Sears’ Problem

around the Strouhal frequency f0 = 0.2 U0/h. In contrast trailing-edge noise is either broadband or tonal depending whether the boundary layers are turbulent or laminar-unstable. Vortex-shedding sound in fan technology can be difficult to recognize because the different values of the characteristic flow speed along the span of a blade result in a broader frequency range.

U

(a) (b) Figure 11. Model von Karman vortex street in the wake of a thick plate (a) and associated reversed Sears’ problem (b) from Roger et al (2006). Pure vortex-shedding configu­ration.

Imposing a Kutta condition in the present generic model would make no sense because both experiments and numerical simulations show evidence of lift fluctuations concentrating at the trailing edge with phase opposition between both sides. This symmetry with what happens at a leading edge impinged by upstream disturbances and referred to as Sears’ problem in section 2 suggests that a similar mathematical statement is also relevant. This is why the configuration is interpreted as a reversed Sears’ problem by Roger et al (2006) (note that another modeling approach has been pro­posed by Blake (1986)). This is simply made by reversing the flow direction in Fig.2-a and assuming that the leading edge becomes the trailing edge and vice versa. The wake oscillation defines an upwash w which is con – vected downstream and has to be canceled farther upstream on the airfoil surface. When applied to the vortex-shedding noise from a thick plate, a refinement must be introduced to account for a convection speed Uc of the upwash lower than the external flow speed U0 (Fig. 11). Again using Schwarzschild’s technique, the dominant first iteration for the induced lift is obtained as

Vortex-Shedding Noise - The Reversed Sears’ Problem

Подпись: ©і 0 y1

. (a — 1) k

i K

E [—© і y l]

with ©і = ak+p (1+M0), Щ = akf [1—M02 (1 — 1/a)2] V2, akf ~ 0.2nc/h. Since vortex shedding is known to have quite a large spanwise correlation length, between 5 and 7 trailing-edge thicknesses h, and because the observer is generally in the mid-span plane in validation experiments, the solution is derived only for two-dimensional gusts. The result reduces to the main term of parallel-gust impingement onto a leading edge as the convection speed is set equal to U0 and as the Mach number and chord-wise coordinates are given the opposite sign. The mathematical expression is defined up to —to upstream, but the unsteady loads concentrate at the trailing edge and negligible values are expected at the leading edge. Only the loads distributed over the actual plate surface are taken into account for the acoustic calculations.

Vortex-Shedding Noise - The Reversed Sears’ Problem Vortex-Shedding Noise - The Reversed Sears’ Problem Подпись: (14)

The normalized radiation integral of a gust at angular frequency ш is derived in a way similar to preceding cases. It is found as

Подпись: ©і Vortex-Shedding Noise - The Reversed Sears’ Problem

with

Unsteady Aerodynamics for Trailing-Edge Scattering

Most attached flows over well designed airfoils with a more or less sharp trailing edge belong the regime illustrated in Fig. 9. Turbulence carried in the boundary layers radiates sound because it is rapidly re-organized around the trailing-edge. Analytical sound predictions require a special mathematical statement. They are better derived starting from the incident wall-pressure field corresponding to the boundary-layer turbulence, since the Kutta condition is expressed in terms of a pressure release. In that sense the convection speed Uc of Fig. 9 refers to the wall-pressure trace of the incident vortex dynamics rather than to the incriminated velocity field. The sound-generating mechanism is addressed by the generic configuration of hydrodynamic pressure patterns convected past the edge of a thin rigid plate, sketched in Fig. 10.

More precisely the wall-pressure field is again Fourier-analyzed and ex­pressed as a combination of pressure gusts, and the airfoil response deduced for each gust. This suggests that few differences arise in the modeling with

Unsteady Aerodynamics for Trailing-Edge Scattering Подпись: c
Подпись: U’

Figure 9. Pure trailing-edge noise configuration. The sec­ondary convection speed U C in the wake introduced by Howe (1978) is not used in the present modeling approach.

respect to the previous mechanism, except that what was done with the velocity or the velocity potential is now repeated with the disturbance pres­sure. It must be noted however that different models have been proposed in the literature (see for instance Howe (1978) and Blake (1986)). They are not detailed here.

The incident forcing by a wall-pressure gust of amplitude, say P0 is con­sidered for one side only, that most often is the suction side of a loaded airfoil. The proper way of imposing a Kutta condition remains a matter of controversy when resorting to simplified models expected to reproduce real-life flows. A full Kutta condition on the pressure jump is most often considered. The scattered pressure field around the edge involves contri­butions in phase opposition on each side of the plate, so that the pressure jump is continuous and zero. Another choice is to assume that an incident vortical pattern in the boundary layer tends to follow its path in the wake. According to this interpretation discussed by Moreau & Roger (2009), the disturbance pressure remains continuous and zero around the edge instead of the pressure jump, and a counter-pressure of amplitude P0 is distributed on each side of the airfoil. A factor 2 makes the difference between both assumptions, and the effect will be 6 dB more in the far-field noise with the second one, for the same incident turbulence. Apart from that, the proce­dure will be declined in the same way. According to authors’ experience with a set of airfoils tested at low speeds, the condition of zero pressure around the edge produces the best agreement with measured data; further-

Подпись: 3

Подпись: x

x

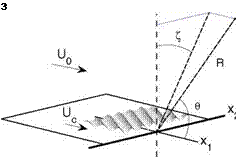
Figure 10. Reference frame for trailing-edge noise model­ing, and schematic view of a wall-pressure gust. Radiation angles mentioned for completeness. в is used in asymptotic formulations of section 6.1.

more it ensures that Amiet’s formulation coincides with asymptotic Howe’s theory at very high non-dimensional frequencies (Moreau & Roger (2009)).

In the derivations the origin of coordinates is taken at trailing-edge mid­point according to the sketch of Fig. 10. Pressure gusts are defined in a first step as if there were neither scattering nor edge. Though turbulence in a boundary layer is not homogeneous in the stream-wise direction, it is assumed almost homogeneous over the small extent just upstream of the edge where the dominant vortex dynamics takes place. More rigorously a gust should be given a growing amplitude, which would be equivalent to adding an imaginary part to the stream-wise wavenumber. Accepting the simplification, a gust of wall-pressure P0 is then forced to zero at the trailing edge by adding a counter-pressure Pi in phase opposition on both sides of the airfoil (this ensures continuity of the pressure in a close vicinity of the edge). If the airfoil leading edge is removed to infinity, Pi is solution of a Schwarzschild’s problem since it has to exactly cancel P0 in the wake and have a zero normal derivative upstream. The corresponding induced lift does not satisfy the condition of zero potential upstream of the airfoil leading edge. In the original formulation proposed by Amiet (1976-b), this is not considered a drawback because trailing-edge noise generally involves
small-scale turbulence and relatively high frequencies for which the induced counter-pressure decreases rapidly away from the edge. For low-frequency needs, a leading-edge back-scattering correction can be derived by going back to the disturbance potential and performing another application of Schwarzschild’s theorem (Roger & Moreau (2005)). The back-scattering correction is not negligible but is is only significant in limited cases. As such it is not detailed here. In contrast the duality of supercritical and sub-critical gusts still makes sense in the three-dimensional formulation of trailing-edge noise. The induced lift of supercritical gusts is £ = £1 + £2, with the dominant contribution £ ~ £ given as

Подпись: £~І(УІ*,,У2)2 ei (akt y1+ k* УІ) [(! _ ■) E (- [ak* + к + Mo j y2) _ 1 ,

(9)

Подпись: £І(У2,У2 ) Подпись: 2 e(a К УІ + k2 v*) Подпись: 1 _ ф(0) Подпись: [i (a k + iK + Mo fj,) y*i]1/2^j (10)

where a = U0/Uc is the ratio of the free-stream velocity to the averaged convection speed of the incident boundary-layer wall-pressure disturbances. For sub-critical gusts, the expression reads

with the same other notations as in previous section.

It is worth noting that the model assumptions remain questionable, prob­ably because the physical processes highly depend on the flow features and airfoil design in the vicinity of the trailing edge. Reducing the airfoil to a flat plate of zero thickness and assuming locally homogeneous turbulence is a concern if the actual shape is not much thinner than the boundary-layers, as in the case of quite thick beveled edges. In particular, the meaning and the hypothesis of a full or partial Kutta condition, as well as questions about the coupled incident and scattered wall pressures have been examined by some authors (Howe (1978), Zhou & Joseph (2007)). This variability of small-scale motions in boundary-layers explains both the difficulty of defin­ing universal scaling laws, addressed in section 6.1, and the either successful or disappointing comparisons of model predictions with measurements. It must be also kept in mind that trailing-edge noise modeling is addressed for a single incriminated boundary layer. Most often this one is the suction – side boundary layer of a loaded airfoil; if the pressure-side boundary layer is also turbulent, the model must be considered twice with different param­eters, assuming uncoupled sides. Outdoor measurements of the trailing – edge noise of wind-turbine blades reported by Oerlemans & Mendez-Lopez (2005) exhibit spectral features involving both sides of the blades: logically the high-frequency range is attributed to the thinner boundary layers of the
pressure sides whereas the low-and-middle frequency range is attributed to the thicker suction-side boundary layers.

Chord-wise radiation integrals (aeroacoustic transfer functions) are also derived from the unsteady lift distributions, following the same methodology as in section 2.5. The expression initially proposed by Amiet (1976-b) for parallel gusts has been readdressed by Roger & Moreau (2005) to account for three-dimensionality. For supercritical gusts the result reads

Unsteady Aerodynamics for Trailing-Edge Scatteringe-2iC ( j B

I = j(1 – i) e2tCI ^zrc E [2(B – C)] – (1 – i) E [2B] + 1

(11)

with B = ak + M0 p + к, C = ak + p (M0 — x/S0). Again for numerical issues it is better implemented using the function ES. For sub-critical gusts the radiation integral is found as

II = |(1 – i) e2iC VW’ES [2 (B’ – C)] – Ф(0) (j-2iB’]1/2^ +1|

І (12)

with B’ = ak + ік’ + M0 p.

Because trailing-edge scattering and turbulence impingement involve vortex dynamics close to an edge, the associated radiation properties have some similarities. Typically, isolated oblique supercritical wall-pressure gusts force trailing-edge noise in oblique directions, in the same way as illustrated in Fig. 8 for turbulence-impingement noise but with lobes now pointing preferentially upstream.

Radiation Integrals of Oblique Gusts

The trace determined by Schwarzschild’s technique provides the pres­sure jump along the airfoil, acting as the equivalent source distribution. The acoustic field is calculated now from the sources by a classical radia­tion integral. This is equivalent to resorting to Ffowcs Williams & Hawk­ings’ acoustic analogy. The sources are exactly the dipole contribution of the analogy, recognized as dominant at subsonic Mach numbers. Since the problem is solved in a non-compact and compressible context, the solu­tion implicitly accounts for the auto-diffraction by the surface. But if the formalism is to be applied to rotating blades, mutual diffraction between adjacent blades, if any, is not accounted for, because Amiet-Schwarzschild’s approach provides isolated-airfoil response functions. For non-overlapping blades or low-solidity fans within the scope of a strip-theory approach, this other simplification is fully acceptable. Oppositely high blade counts typi­
cal of some turbomachines would in principle require the implementation of cascade response functions, much more expensive and time-consuming, not addressed here.

The far-field radiation for a single gust is expressed in a reference frame attached to the airfoil as

Подпись: p(x,w)ikcp0 x3 и w L sin[L (k* – k* x2/So)/c] 1 2 S2 0 W L (k* – k* x2/S0)/c

Подпись: I (x,ki,k2) Radiation Integrals of Oblique Gusts

with k* = kc/2, where the sine-cardinal function sin ^/^ represents the span-wise radiation integral and where the non-dimensional chord-wise ra­diation integral (or aeroacoustic transfer function) I is introduced as

Подпись: і Radiation Integrals of Oblique Gusts Подпись: (5) (6)

Подпись:

Подпись: x І (1 - e2 i 04) - (1 + i)
Подпись: E(4 к) - e2 i 04 — E [2 0з] 03

In the expressions (x1,x2,x3) stand for observer’s coordinates with ori­gin at the center of the airfoil, respectively in the stream-wise, span-wise and normal directions. S0 = [x2 + в2 (x2 + x3)]1/2 is a corrected distance accounting for sound convection by the surrounding flow. It is close to the geometrical distance R only if M0 is small. L is the span. The sine – cardinal function accounts for the span-wise interference associated with the wavenumber k2. The function I has different expressions for the sub-critical and supercritical gusts, including leading-edge and trailing-edge contribu­tions: I = I1 + I2. For supercritical gusts it reads (Roger (2010))

Подпись: I1 Radiation Integrals of Oblique Gusts Radiation Integrals of Oblique Gusts Radiation Integrals of Oblique Gusts

with 02 = p (Mo – xi/So) – п/4, 03 = к + pxi/So, 04 = к – pxi/So. For sub-critical gusts the expressions follow as

Radiation Integrals of Oblique Gusts
Подпись: 7 E [2 03]

with 04 = iK — pxi/So, 03 = iK + fixi/So.

Подпись: ES (z) Подпись: E (z) V~z Подпись: 1 + i Ф(0'>(у—Л) ~^2 фz Подпись: Ф(0)(£) = 4 e-u du n 0

For the sake of robustness the Fresnel integrals and related functions are better implemented using the following relationship with the complex error function of complex argument

Radiation Integrals of Oblique Gusts

and the algorithm

The amplitude of the radiation integral I is plotted in decibels and in logarithmic k|-scale in Fig. 7 for an arbitrary set of parameters, as a func­tion of observation angle with respect to the chord-wise direction. The plot emphasizes a rapid drop for large values of k|, and a plateau for small val­ues at fixed angle. Note that interpolation has been performed between the supercritical and sub-critical ranges to smoothen the response surface at the singular value Щ = в p, for which the two-step Schwarzschild’s pro­cedure breaks down because the effective frequency parameter к is exactly zero. At some angles the dip in the supercritical range a priori makes the sub-critical gusts more significant contributors. This dip is caused by cancel­lations which result from chord-wise non compactness. At lower frequencies (typically p < n/4) the plateau would extend nearly constant whatever the observation angle could be. In contrast at even higher frequencies, multiple dips would be found.

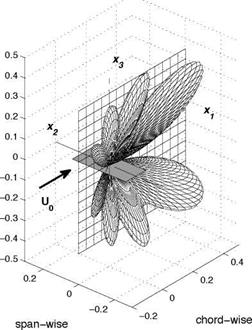
The complete directivity pattern of a single oblique gust results from the combination of this radiation integral with the additional sine-cardinal function, on the one hand, and the factor x3/S0 which accounts for the dipole character of the lift fluctuations, on the other hand. For non-compact chords and supercritical gusts it exhibits multiple inclined lobes. Another sample result with different parameters is plotted in Fig. 8. The four lobes result from chord-wise non-compactness associated with the relatively high reduced frequency. They are inclined away from the mid-span plane because of the obliqueness of the gust, as first pointed out by Amiet (1975). The radiation would be preferentially in the mid-span plane for a parallel gust. The larger the aspect ratio L/c, the thinner the lobes. In the limit of infinite aspect ratio, a single oblique angle would be selected. As frequency increases, not only the number of lobes increases but the radiation also takes place with more pronounced beaming downstream. In the limit of arbitrary large frequencies, as shown later on, the diagram would become cardioid – like with a maximum downstream; this is a typical feature of the half-plane Green’s function already identified in chapter 2. In contrast to supercritical gusts, sub-critical ones cannot produce multiple radiation lobes nor oblique focusing.

Globally the chord-wise radiation integral behaves like a low-wavenumber filter. The sine-cardinal factor acts as a band-pass filter centered on the wavenumber Щ = k*x2/S0 which gets progressively thinner as the aspect ratio increases. The wider it is, the more likely the sub-critical gusts con­tribute. More precisely if the observer gets closer to the mid-span plane, the sub-critical gusts bring a poor contribution. In this case the parallel and nearly-parallel gusts are responsible for the major sound. As x2/S0 increases the sine-cardinal filter shifts towards larger values of k2 and gives more im-

Radiation Integrals of Oblique Gusts

Figure 8. Typical directivity diagram of an oblique super­critical gust. kc = 12.57, p = 6.3, M0 = 0.05, Щ = —1.26, L/c = 2. Arbitrary units.

portance to sub-critical gusts. But in the same time extreme observer posi­tions close to the airfoil plane along the span correspond to vanishing values of x3 for which the dipole directivity factor makes the contribution smaller and smaller. This is why, again, sub-critical gusts are often discarded for simplicity. Yet in view of the three-dimensional plot of Fig. 7 their relative contribution can be significant if the sound must be evaluated for all pos­sible observer locations and for all configurations. This is precisely what is needed in rotating blade noise studies.

Because the present discussion is a question of gust obliqueness combined with convection Mach number, it will also hold in the subsequent analysis of trailing-edge noise, based on the same mathematical background.

1.4 Extensions

One of the most striking aspects of aforementioned Amiet-Schwarz – schild’s technique is its wide range of extension capabilities. First it is ap­plied later on to derive formulas for trailing-edge noise and vortex-shedding noise; secondly it has also been used to account for realistic features de­parting from the restrictive assumption of a rectangular airfoil the edges of which are perpendicular to the mean flow. The former advantage makes the analytical models of the three mechanisms addressed in this chapter quantitatively comparable, because they are built on the same basis. The latter allows introducing more physics in the models, thus offering more practical interest. But it is beyond the scope of the present document. Only indicative examples of reported works that are expected to enlarge turbulence-impingement noise modeling are listed below as an open door towards further extensions.

1 – Impingement of disturbances on a swept edge. Because the span – wise extent of the airfoil is assumed infinite for the sake of determining the induced lift, sweep, defined as a possible arbitrary angle between the lead­ing edge and the flow direction, is simply accounted for by performing a change of variables and introducing Cartesian coordinates along and nor­mal to the edges, thus oblique with respect to the flow direction. First derivations of the lift distribution £ are reported by Adamczyk (1974), based on the Wiener-Hopf technique. Equivalent solutions are obtained with Schwarzschild’s technique, and lead to extended expressions of the radiation integrals, as shown by Roger & Carazo (2010). Essentially the ef­fect of sweep is to shift the threshold between supercritical and sub-critical gusts by changing the relative edge-to wavefront angle and the associated span-wise phase speeds of the interaction.

2 – Effect of varying chord length. Fan design usually involves span-wise variations of all geometrical parameters of a blade. Therefore any blade segment in a strip-theory approach can have different chords at both ends, or equivalently non-parallel leading and trailing edges. This again can be included in Amiet-Schwarzschild’s approach, provided that some approxi­mation is accepted. Indeed both edges are treated separately as edges of half-planes. Once the dominant leading-edge scattering is determined by the first iteration in the same way as for a rectangular airfoil, a change of variables is performed in order to project the solution £1 in a new set of coor­dinates aligned with the trailing edge. The procedure, detailed by Roger & Carazo (2010), requires a splitting of £1 into trailing-edge aligned secondary gusts, which is only valuable for segments of moderate aspect-ratio.

3 – Unsteady response of a blade tip. Because the highest relative flow speeds on rotating blades are encountered at the tip, the effect of the blade termination upon the unsteady aerodynamic response is a key issue, espe­cially if the oncoming disturbances concentrate to precisely impinge near the tip. Again Schwarzschild’s technique provides a way to include the tip effect in the analysis. Detailed derivations are also described by Roger & Carazo (2010), for the tip of a rectangular unswept airfoil. The principle is as follows. The unsteady lift determined ignoring the tip is first continued by zero away from the airfoil surface and expanded in Fourier components. For each component the lift is forced to zero beyond the tip by adding a correction which is solution of another Schwarzschild’s problem, now in the span-wise direction instead of the original stream-wise statement. The inverse Fourier transform is finally performed numerically to get the cor­rected response. Application to blade-tip vortex interaction noise modeling is proposed by Roger & Schram (2012).

4 – Different convection and free-stream velocities. In some analytical reductions of practical problems, oncoming disturbances can need being assumed with a convection or phase speed that differs from the free-stream velocity involved in the far-field radiation. For instance, this would be the case for the turbulence generated in the flap cove of a wing with deployed high-lift devices and impinging on the flap leading edge. Though seldom addressed this extension is quite straightforward. It is not discussed here because similar statements are mentioned in the next sections for trailing – edge noise and vortex-shedding noise modeling.

The Compressible Gust – Schwarzschild’s Technique

Compressible alternatives to von Karman & Sears’ theory have been proposed and reviewed for instance by Goldstein (1976). The approach proposed by Amiet (1976) is selected here for its formal simplicity and the wide possibilities of extensions it offers, discussed later on. In particular the solution will be easily extended in a three-dimensional context. At low frequencies it reduces to a compressibility correction of the incompressible theory, described in the references. The correction is not addressed here because it remains quite close to original Sears’ solution for compact airfoils. Of more interest is the case of non-compact airfoil chords and related high frequencies, for which the solution is detailed below.

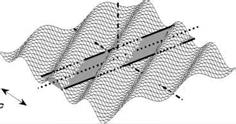
Sears’ problem is considered now in a three-dimensional space, thus in­troducing oblique gusts. A gust is defined by two aerodynamic wavenumbers ki and k2 in the streamwise (chordwise) and spanwise directions respectively

The Compressible Gust - Schwarzschild’s TechniqueX

Подпись: 1

The Compressible Gust - Schwarzschild’s Technique Подпись: 2
Подпись: 0
Подпись: X.

Figure 5. Two-dimensional gust for generalized Sears’ problem statement.

The Compressible Gust - Schwarzschild’s Technique Подпись: дф дхі Подпись: + (k2 Подпись: 0

by the upwash, w(k1,k2) e1 (kl X2+k2 X2-w t’) (Fig. 5). For convenience, the no­tation (y1,y2,y3) is devoted later on to the source point (with y3 = 0) and (x1, x2,x3) to the observation point or any field point. When evaluating the unsteady lift the airfoil is assumed of infinite span, as also featured in the figure, so that the potential is factorized as ф(х1,х2, t) ei (k2 Х2-ш b in accor­dance with the excitation by the gust. This leads to the modified convected Helmholtz equation, equivalent form of the linearized Euler and continuity equations

The Compressible Gust - Schwarzschild’s Technique The Compressible Gust - Schwarzschild’s Technique Подпись: 2 в xi c Подпись: (3)

to be solved with the rigidity condition on the surface of the airfoil and a Kutta condition in the wake. This equation is reduced to the ordinary Helmholtz equation by a change of variables referred to as Ribner’s trans­formation:

where Graham’s parameter @ = M0 Щ_/(вЩ) has been introduced for con­venience. When @ is smaller than 1 the gust is said sub-critical and the
equation is elliptic. The disturbance potential attenuates as an evanescent wave away from the airfoil leading edge. When 0 is larger than 1 the gust is supercritical and the potential radiates to the far field as sound. This is why the interest is often limited to supercritical gusts as the only contributing ones in the sound field. But this is true only in the limit of infinite or arbi­trary large span and if the problem is addressed to directly derive the sound. In the following two-step approach the equation is solved first to derive the induced unsteady lift, which is the trace of the sound on the airfoil. The sound itself is calculated afterwards from its trace by taking into account the source distribution over the actual span, and this truncation makes the sub-critical gusts contribute as well. In other words the sources are evalu­ated ignoring the span-end effect. It is worth noting that sub-critical and supercritical gusts correspond to subsonic and supersonic phase speeds of their trace along the leading edge with respect to the incident mean flow, respectively, as pointed out by Amiet (1975).

Подпись: д2ф dxf The Compressible Gust - Schwarzschild’s Technique Подпись: + k2 ф Подпись: 0

The aeroacoustic response of the airfoil is now interpreted as a wave scattering problem. The approach is outlined as a reference that can be applied in many more complicated configurations. The focus is first on the induced lift and the acoustic field will be addressed in the next section, essentially because the complete mathematical problem has no analytical solution. Furthermore even the finite-chord strip representing the airfoil cannot be handled exactly from this standpoint. The solution proposed by Amiet (1976) is to consider separately the contributions of the leading edge and of the trailing edge within the scope of an iterative procedure called Schwarzschild’s technique (see Landahl (1961)). The theoretical background is Schwarzschild’s theorem, stated as follows. Let ф be a scalar field solution of the Helmholtz equation

with the boundary conditions:

The Compressible Gust - Schwarzschild’s Technique Подпись: 0 (4)

ф(хі, 0) = F(xi) xi > 0,

This theorem is inherited from electromagnetism (the complex conjugate can need being taken depending on the choice of convention for the time Fourier transform). It produces closed-form solutions provided that the integral can be calculated analytically, which is always the case when dealing with gusts defined by complex exponentials.

Подпись: p Подпись: po Uo Подпись: дф дх1

Only the principle is explained here. For the application the airfoil is first assumed semi-infinite by removing the trailing edge to infinity downstream. A zero-order disturbance potential is introduced that exactly cancels the incident gust upwash not only on the airfoil surface but also everywhere on x3 = 0. This potential is balanced upstream of the leading-edge by a first-order contribution for which the transformed potential Фі is solution of a Schwarzschild’s problem. Indeed Ф1 is prescribed upstream of the leading edge and its normal derivative must be zero on the extended airfoil surface. Once determined, it is transformed back to get the effective potential ф1, and the pressure jump I = Ap1 = 2 p1 is deduced by the relationship in the presence of flow

Подпись: x The Compressible Gust - Schwarzschild’s Technique

This first iteration alone is wrong because the actual airfoil chord is not infinite. Therefore a trailing-edge correction is introduced, calculated as if now the leading edge was removed to infinity upstream. The difference is that the disturbance pressure is used to write down another Schwarzschild’s problem, because the Kutta condition states that this pressure must be zero in the wake and have a zero normal derivative on the airfoil surface (the details, not given here, again involve changes of variables to move the origin of coordinates from the leading edge to the trailing edge). In principle higher-order iterations could be performed but the first two are enough in practice, as pointed out by Amiet (1976). Details can be found in the referenced papers. In the present three-dimensional context, the full solution for the distributed unsteady lift of supercritical oblique gusts including main leading-edge impingement and trailing-edge back-scattering reads (Mish & Devenport (2000), Roger (2010))

introducing the non-dimensional chordwise coordinate yl with origin at the

center chord, and the notation к = p 1 — 1/02 = Jp2 — Щ 2/в2. E is the function introduced by Amiet and involving Fresnel integrals

Подпись: E(0eu

. dt. о л/2 nt

The same expression for the unsteady lift and more generally for Schwarz – schild’s eq. (4) or the complex conjugates are found in the literature de­pending on the definition of Fourier transforms; remind that in the present document time dependence is assumed as e-lut.

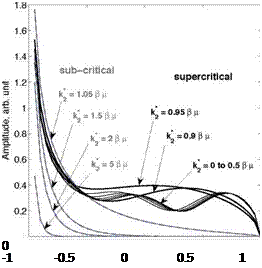
For sub-critical gusts к is replaced by i к’ with к’ = J(k|2/в2) — p2 and the term involving the function (1 — i) E by the error function erf ([2 к’ (1 — y’^)}1/2). All gusts involve the integrable inverse square-root singularity at the leading edge already pointed out by Sears’s solution, but the unsteady lift of sub-critical gusts decreases much faster farther downstream. This is emphasized in Fig. 6, where the chord-wise distribution of the unsteady lift amplitude on a flat-plate airfoil is plotted for various oblique gusts con­tributing to the same frequency, thus various angles triggered by different values of k2. Despite the physical drop at the trailing edge imposed by the Kutta condition, the lift induced by supercritical gusts contaminates more significantly the aft part of the airfoil.

Including sub-critical gusts in the modeling and paying attention to the sub – or supercritical duality of sinusoidal gusts is important for practical applications. Typically analytical studies of rotating blade broadband noise rely on a strip-theory approach: a blade is split into segments, each of which is assimilated to a rectangular airfoil of small aspect ratio, in order to account for span-wise varying conditions. If a two-dimensional response of each segment is assumed for simplicity, only parallel gusts are abusively selected, supercritical by definition. If the actual excitation by oncoming disturbances tends to produce sub-critical conditions, substantial errors are expected.

In its original two-dimensional declination for parallel gusts (k2 = 0) the compressible high-frequency solution holds whenever p = kc/(2в2) > n/4 or whenever c/в2 > A/4. Very low frequencies are possibly addressed by the technique but would a priori require a larger number of iterations, not compatible anymore with the derivation of closed-form solutions. Classical Sears’ solution could provide a good alternative for gust-impingement at a leading edge at low frequencies, used together with Graham’s similarity rules (see Graham (1970)). The mathematical limitation must be transposed to the parameter к instead of p in the general case, leading to possible concern for values of k2 approaching the transition between sub-critical and supercritical gusts. A palliative interpolation between both regimes can be

Подпись: 0 -1 -0.5 0 0.5 1

yi

Figure 6. Typical chord-wise distribution of unsteady lift amplitude for various oblique gusts in both sub-critical and supercritical ranges. kc = 2 n, M0 = 0.3.

applied instead as proposed by Roger & Moreau (2005) for the similar case encountered in trailing-edge noise modeling.

The Two-dimensional Incompressible Gust

Подпись: IS (k1,y1,t) Подпись: 2 po Uo w(k) The Two-dimensional Incompressible Gust Подпись: ■iu> t Подпись: (2)

The simplest physically consistent theory is two-dimensional Sears’ theory assuming incompressible flow (see for instance Goldstein (1976)). Though it only addresses parallel gusts, it is presented for historical interest and because it already contains major physical features which will also be included in more sophisticated approaches. The local instantaneous lift fluctuation per unit span is distributed as:

where y = 2 yi/c is the non-dimensional chord-wise coordinate with refer­
ence at mid chord and k* = ki c/2 the non-dimensional aerodynamic wave number of the incident fluctuation in the chord-wise direction. The theory applies to a given wave number and requires a Fourier analysis of the in­cident fluctuations. S* is Sears’ function, expressed with Bessel functions as

2

S*(k*) = — ([Jc(k*) – Yi(k*)] – * [Ji(k*)+ Yo(k*)])-i.

П ki

Integrating eq. (2) along the chord line leads to the total unsteady lift force per unit span for the wave number k* of the incident gust

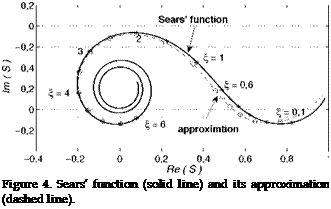
Подпись: Figure 4. Sears’ function (solid line) and its approximation (dashed line).

F(ki, t) = F(ki) в-іші = np0 cU0 W(k*) S*(k*) в-іші.

Подпись: S*(k*) The Two-dimensional Incompressible Gust The Two-dimensional Incompressible Gust

This result gives sense to the intuitively introduced transfer function T of section 2.2. Equation (2) shows that the lift fluctuations concentrate at the leading edge and decay to zero at the trailing edge. The center of action of the total fluctuating lift force is at the quarter-chord point. Sears’ function is plotted in Fig. 4. It does not depart so much from the approximation

The amplitude of Sears’ function decays as frequency increases. In that sense higher-frequency fluctuations correspond to lower aerodynamic effi­ciency.

Assuming incompressibility means that the sound speed is considered infinite in view of the time and velocity scales involved in the aerodynamic processes. This is acceptable if the time taken for the airfoil response to in­cident disturbances remains much smaller than the periods of oscillations. If the response to an event occurring at the leading edge involves transmission of information down to the trailing edge plus back-transmission upstream to the leading edge accounting for the effect of the Kutta condition, the condition reads

Подпись: 2c
Подпись: AA U0 ’

with в2 = 1 — M2, Mq = Uq/cq. In other words, since Aa = 2n/k1,

Mokt kc n

——— = ——- – C —

в 2 в2 2

The incompressible Sears and von Karman’s solution is therefore only valid if the chord is compact and if the Mach number is sufficiently small. As a result the effect of compressibility is important not only at high Mach number but also at high frequencies (Homicz & George (1974)). In many cases of interest the aforementioned condition is not fulfilled and a com­pressible solution is needed.