Category Noise Sources in Turbulent Shear Flows

Models for the Shock Cell Structure

From the model described in the previous section, it is clear that an accurate representation of the shock cell structure as well as the large scale turbulence structures is necessary for the prediction of broadband shock noise. When a supersonic jet is operated at an under-expanded condition, Pe/Po > 1, where pe and po are the exit and ambient pressures respectively, expansion waves occur at the nozzle exit so that the pressures inside and outside the jet can come into balance. In the overexpanded mode, oblique shock waves are set up in the plume. Tam and Tanna (1982) derived an expression for the fully expanded jet diameter Dj, which is larger than the physical nozzle diameter for the under-expanded case and smaller for the over-expanded case. Pack (1950), following Prandtl (1904), first provided a complete shock cell solution using a vortex sheet approximation to repre­sent the jet shear layer. This solution is valid only for slightly imperfectly expanded jets, and only close to the nozzle exit where the shear layer is thin. However, experimental evidence shows that the region of importance for shock noise generation is close to the end of the potential core, where the shear layer is no longer thin. Further, the effect of turbulence in reducing the shock strength and smoothing sharp discontinuities must be taken into ac­count. Tam et al. (1985) extended Pack’s linear solution to account for the slowly diverging mean flow using the method of multiple scales. The effect of turbulence was simulated through the inclusion of eddy viscosity terms. The most suitable value for the turbulent Reynolds number was determined by comparison of predictions with experimental data. They evaluated the contributions of the higher order terms to the non-parallel correction and concluded that only the first order correction term was significant. Thus, the simpler locally parallel assumption was shown to be adequate for the calculation of the shock cell structure.

Tam et al. (1985) demonstrated very good agreement between their predictions and measured data for a variety of jet operating conditions. Both the axial and radial variations of the pressure field, in terms of shock cell spacing and shock amplitude were well predicted for both over – and under-expanded jets. Morris et al. (1989) extended Tam’s vortex sheet shock cell model for jets of arbitrary geometry using a boundary element technique. Examples for circular, elliptic and rectangular jets were given. Bhat et al. (1990) included the effects of finite jet shear layer thickness and the dissipative effects of the fine-scale turbulence in a shock cell model for elliptic jets. They also concluded that the fundamental waveguide mode could be used as a good approximation for the shock spacing at the end of the potential core and that the higher order modes only contributed to the fine structure of the shock cells near the jet nozzle exit.

The linear shock cell model is valid only for weakly imperfectly expanded jets, with Mj – Mj < 1. Extensive plume surveys carried out at NASA Langley Research Center and reported by Norum and Seiner (1982a) indi­cated that as the degree of mismatch between the design and fully expanded Mach numbers increased, there was a dramatic change in the shock cell structure. At highly off-design conditions, the strength of the first shock cell increased tremendously while the rest of the shock cells remained reg­ular and quasi-periodic. That is, downstream of the first shock, the shock cell structure for the strongly off-design conditions resembled that of the slightly imperfectly expanded jet. Based on this observation and the fact that the first shock plays only a negligible role in noise generation as noted by Seiner and Norum (1980), Tam (1990) suggested that the linear solu­tion, suitably modified, could be used to model the shock cell structure of even moderately imperfectly expanded jets. Tam (1990) also developed a semi-empirical formula to estimate the initial amplitude of the linear shock cells for this situation.

The Noise Generation Mechanism

It is now well established that broadband shock-associated noise is gen­erated by the interaction of the large-scale structures that propagate down­stream and the quasi-periodic shock cell structure. The point-source array model proposed by Harper-Bourne and Fisher Harper-Bourne and Fisher (1974) was successful in explaining many of the observed noise character­istics. Tam and Tanna (1982) proposed an alternate theory based on the observed properties of the large-scale turbulence structures, which possess the important characteristics of being coherent and spatially quasi-periodic over several jet diameters. Thus the large-scale structures are wave-like when viewed as a whole. As these structures propagate downstream, they interact with the shock cell system established in the jet plume of an im­perfectly expanded supersonic jet. Tam and Tanna (1982) proposed a simple analytical model to explain the noise generation mechanism. They first expressed the pressure perturbation associated with the shock cells as a summation of the waveguide modes. Such a first order shock solution had been developed by Pack (1950), based on the work of Prandtl (1904).

In a cylindrical polar coordinate system centered at the nozzle exit, any perturbation associated with the shock cells can be expressed as,

OO 1 OO

Us = ^ Апфп (r) cos (knx) = – ^ Лпфп (r) (eiknx + e~lknx), (58)

n= 1 2 n=1

where Лп, фп(r) and kn are the amplitude, the eigenfunction, and the axial wavenumber of the n-th mode, respectively. The fundamental shock cell spacing L1 = 2n/k1.

The large-scale turbulent structures can be represented by a linear su­perposition of the normal wave modes of the flow with random amplitude functions. For a frequency f = ш/2п, the corresponding disturbance quan­tity can be expressed as

ut = R{B (x) ф (r) exp [i (kx – шЬ + тф)]} , (59)

where B(x), Ф(г), k, and m are the amplitude, the eigenfunction or radial distribution, the axial wavenumber, and the azimuthal mode number of the traveling instability wave, respectively. The wavenumber and frequency are related by uc = ш/k, where uc is the convection or phase velocity of the large-scale turbulent structure or instability wave.

The perturbations created by a weak interaction between the instability waves or large scale structures and the shock cell structure are given by the product of the Eqns. (58) and (59). The expression for the shock cell structure involves two summations corresponding to the different signs of the exponent. Tam and Tanna (1982) noted that the phase velocities of the terms associated with the shock cell component with the positive exponent, given by ш/^ + k„,), are less than those of the instability wave alone. They are usually subsonic relative to the ambient speed of sound and do not radiate. For the term involving the product with the component with the negative exponent, the interaction quantity is given by

R {2B (x) ф (r) Лпфп (r) exp [i(k – k^x – ішЬ]} . (60)

This expression represents a traveling wave with wavenumber (k – kn) and phase velocity equal to ш/^ – kn), if any amplitude variation B(x) is ig­nored. If kn is slightly larger than k, then the phase velocity is negative. This phase velocity could be supersonic relative to the ambient speed of sound even if the convection velocity of the large-scale structures them­selves, given by ш/k, is subsonic. These supersonic components would gen­erate Mach wave radiation mainly in the upstream direction. The direction

of radiation can be related to the phase velocity and ambient speed of sound

Подпись: ao The Noise Generation Mechanism Подпись: (61)

by

Подпись: n Подпись: uc Ln (1 + Mc cos ф) ’ Подпись: n = 1, 2, 3,... Подпись: (62)

where ф is measured from the jet inlet direction. This relation can be rewritten as an expression for the frequency as a function of angle as,

where Mc = uc/a is the convection Mach number of the large scale structures relative to the ambient speed of sound and Ln is the wavelength of the n­th Fourier mode of the shock cell structure. Li is the fundamental shock cell spacing. The peak frequency for a given angle of radiation would be close to but not exactly that given by Eqn. (62). The axial variation of the instability wave amplitude B(x), broadens the wavenumber spectrum, as shown by Tam and Morris (1980) and discussed in Section 3.2. This broadening produces a band of components with different supersonic phase velocities at frequency f. These components radiate at different angles, producing the observed directivity pattern at this frequency.

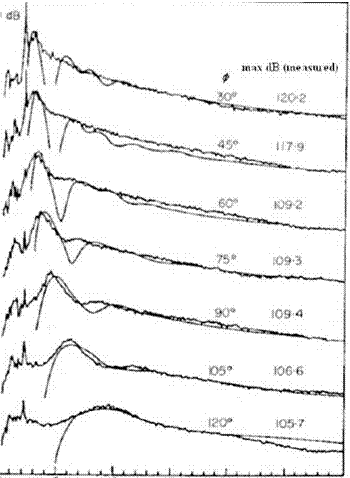
Since the shock cell system is composed of several waveguide modes, with different wavelengths, the interaction effects of the different waveguide modes are different. The principal direction of radiation and the spectral content of the noise are different for each mode. Thus, the far field noise that is made up of the superposition of the contributions from all the modes should exhibit multiple peaks and directional dependencies. These are pre­cisely the characteristics observed experimentally as shown in Figure 10. Since the amplitude of the broadband shock noise is directly proportional to the amplitude of the waveguide modes, and the amplitudes decrease rapidly with mode number, the spectral levels associated with the higher order modes are smaller than that of the fundamental. Even though multi­ple peaks are possible, they may not be easily observed. This explains why only a single dominant peak is often observed in the measured spectra.

Tam and Tanna (1982) also developed an expression for the intensity of broadband shock associated noise for jets operated at slightly off-design con­ditions |Mj – Mj| < 1, where Md and Mj are the design and fully-expanded Mach numbers of the jet respectively. The intensity is given by,

Is MMj – Mj)2. (63)

This expression, which is valid for both convergent and C-D nozzles, was shown to provide excellent agreement with measured data for both cold and
hot jets, and for over – and under-expanded modes of operation for the C-D nozzle. This expression is not valid when a strong shock, such as a Mach disc, is present in the plume.

Broadband Shock-Associated Noise

The characteristics of shock-associated noise were described in Section 2.2 Harper-Bourne and Fisher (1974) proposed a simple model, consisting of phased sources at regular intervals to represent the turbulence/shock cell system interaction. They inferred that the interaction of the spatially co­herent turbulence with the quasi-periodic point sources would be necessary to produce the observed noise characteristics in the far field. Tam (1995a) stressed that any shock noise model must incorporate these features and points out that prior and later studies on sound generation by the interac­tion of random turbulence with a single shock wave do not represent the generation mechanism of broadband shock-associated noise. This section describes the broadband shock-associated noise generation mechanism as well as models to predict its radiated noise.

Noise from Fine-Scale Turbulence

Traditional theories of aerodynamic noise and the development of their mathematical foundations were described in Section 3.1. These methods require a detailed knowledge of turbulence, which is then used as input for noise calculations. Therein lies the fundamental difficulty in these ap­proaches. Despite nearly a century of turbulence research, our understand­ing of turbulence and the development of accurate models for the turbulence statistics are still remote. Given this situation, it is perhaps not surprising that most existing methods[5], which make use of some model for the statis­tical properties of the turbulence, fail to capture the spectral characteristics of jet noise at all angles.

Tam (1995b) and Tam (1998b) have provided a different perspective on jet noise. As described in Section 3.2, Tam and Morris, among others, have had success in predicting the large-scale structure noise of circular and non-circular jets using an instability wave model. Following the arguments presented in the previous section that the turbulent mixing noise consists of two components. Tam and Auriault (1999) proposed a model, not formu­lated as an acoustic analogy, for the fine-scale noise component. Drawing an analogy with the kinetic theory of gases, they reasoned that the fine-scale turbulence exerts a pressure on its surroundings, which must be balanced by the pressure and momentum flux of the surrounding fluid. Since this pressure fluctuates in time, it will lead to compressions and rarefactions in the fluid, resulting in acoustic disturbances. They argued that the time rate of change of this pressure in the moving frame of the fluid would constitute the source of the fine-scale turbulence noise. They also argued that the propagation of the resulting sound waves through the jet flow can be de­scribed by the Euler equations linearized about the jet mean flow. It should be noted that, if the mean flow is taken to be parallel, the linearized Euler equations are equivalent to the propagator provided by Lilley’s equation. Tam and Auriault (1999) obtained the Green’s functions for the linearized Euler equations in terms of their adjoint solutions. Details of the use of the adjoint solution to calculate refraction effects in sheared mean flows are given by Tam and Auriault (1998). The method is quite novel, though it is not without difficulties. The cause of the difficulties is the presence of Kelvin-Helmholtz (K-H) instabilities. Both the physical problem and its adjoint have these convective instabilities. It is possible for these unstable solutions to dominate over and obscure the part of the solution associated with sound wave propagation. Tam and Auriault (1998) acknowledged their presence and, in order to avoid these instabilities, they introduced damping functions and damping regions to suppress them. Agarwal et al. (2004) have shown how the instability can be suppressed if a frequency domain formulation is used for the adjoint Green’s function.

Tam and Auriault (1999) showed how the pressure fluctuation outside the jet could be related to the convolution of the adjoint pressure and the

convective derivative of their source term. The formula for the pressure fluctuation is given by,

p (x, t) = J – J Pa (xi, x, u) exp [-iu (t – ti)] du


Noise from Fine-Scale Turbulence

(55)

where pa (x1, x, u) is the time harmonic adjoint pressure, qs = 2pks/2, and ks is the turbulent kinetic energy of the fine-scale turbulence per unit mass. An expression for the autocorrelation of the intensity can then be obtained and the far field spectral density is obtained using Eqn. (19).

As in noise prediction models based on the acoustic analogy, it is nec­essary to specify a mathematical expression for the noise source space-time correlation function. Tam and Auriault (1999) assumed that the source cor­relation had the same characteristics as the measured two-point space-time correlation of the fluctuating axial velocity in a jet. Morris and Farassat (2002) have shown that there is no essential difference between models based on the acoustic analogy and the predictive model developed by Tam and Auriault (1999) 5. The key difference in the resulting prediction formulas lies in the model used to describe the two-point space-time correlation of the source function. Tam and Auriault (1999) showed that the spectral density can be written,

Подпись: S(x,u) = 4nПодпись: A2q2j3 Ts Noise from Fine-Scale TurbulenceПодпись: Pa (x2, x,u)2Подпись: dx2exp [-u2£2s/ {u2 (4ln2)}] 1 + u2t2 (1 – u cos в)

(56)

where u is the local mean velocity and в is the polar angle relative to the downstream jet axis. This formula contains three parameters associated with the fine scale turbulence: a typical length scale £s, a time scale Ts, and a measure of the intensity of the fluctuating kinetic energy A2 q2, where q = 3 pk, p is the mean density and k is the turbulent kinetic energy per unit mass. Tam and Auriault (1999) used the modified k – є model of Thies and Tam (1996) to obtain these three characteristic parameters. Since the k – є model also includes the contributions from the large-scale turbulence, they proposed to extract the fine-scale turbulence contribution through the use of constants with values of less than unity. That is,

£s = в£ (k3/2/є), ts = cT (k/є) : в£ = 0.256, cT = 0.233

Though the modeling philosophy and details of the analysis are different.

where є is the viscous dissipation rate. The values of these constants, and a third constant to set the absolute level, were determined by a best fit of the predicted noise to measured data.

There are three major steps involved in this prediction method. First, the jet mean flow field and the turbulence properties к and є, are computed. In the second step, the adjoint Green’s function is evaluated using the jet mean flow field. Finally, the radiated noise is calculated by adding the noise contributions from each volume element in the computational grid.

Tam and Auriault (1999) show good agreement of the predicted noise spectra with measured data for cold jets at both subsonic and supersonic Mach numbers: however, there are some discrepancies at the very high frequencies. The ability of the model to predict the spectral variations with radiation angle for a Mach 2.0 isothermal jet is also demonstrated. This model also captures the effect of jet temperature on radiated noise. Finally, they show good comparisons of the peak spectral levels for a wide range of jet operating conditions. Tam et al. (2001) show additional test cases for cold jets embedded in a freestream, with good predictive capability. It should be emphasized that this theory makes absolute noise predictions; intensity, directivity, as well as the spectral characteristics of the measured data are reproduced. Of course this is a semi-empirical theory because of the three new constants in addition to the empirical constants inherent in the к – є turbulence model. Importantly, it should be noted that Tam and Auriault (1999) limit their predictions to angles close to 90° to the jet axis. They argue that noise at other angles, particularly in the peak noise direction at small angles to the jet downstream axis, depend on noise from the large-scale structures. So, fine-scale turbulence noise predictions would not be relevant at other angles. Similar findings were obtained by Morris and Farassat (2002) and Morris and Boluriaan (2004) using an acoustic analogy based on the linearized Euler equations.

This model is not without critics. Ribner (2000) questions the validity of the two similarity components and the approach adopted by Tam and Auriault (1999). However, it should be noted that there is a vast amount of experimental data that has established the presence of large-scale structures and their Mach wave radiation. In addition, examination of the expression for the spectral density, Eqn. (56), shows that the jet temperature does not appear explicitly in the integrand. Fisher (38) pointed out that since the dipole term that occurs in classical approaches based on the acoustic analogy is not included, this model should not be able to predict the noise from hot jets.

It should also be noted that there is no convective amplification of the fine-scale turbulence noise in the model of Tam and Auriault (1999). This is not a result of the use of the fixed frame of reference description of the source statistics. The result is independent of the reference frame for consistent source descriptions. Morris et al. (2002) show that if a Gaussian model is used to describe the source correlation in the Tam and Auriualt model, convective amplification appears: but, with only three inverse powers of the modified Doppler factor, rather than the five appearing in models based on the acoustic analogy, such as given by Eqn. (31).

Large Scale Structures and Instability Wave Model Theory

It is now generally recognized that the noise radiation from high speed jets in the peak noise direction is dominated by the noise generated by the large scale turbulent structures in the jet. Tam (1995a) provides an extensive review of the role played by the large scale structures in jet noise. Beginning with the experiments by McLaughlin and his research team at Oklahoma State University ( McLaughlin et al. (1975), McLaughlin et al. (1977)) numerous experimental observations of large-scale structures in both subsonic and supersonic jets at both high and low Reynolds number have been made.

The key observation of the large-scale turbulent structures in a high Reynolds number jet is that, though they occur in a non-deterministic fash­ion in space and time, any single occurrence is in the form of a train of structures of gradually increasing scale in the axial direction. The growth of the jet upstream of the end of the potential core, as in the case of the two-dimensional shear layer, is associated with the engulfment of ambient fluid and the ejection of high speed jet fluid induced by the large-scale struc­tures. The fact that the large-scale structures appear as a slowly-developing sequence suggests that they may be modeled in both a physical and math­ematical sense by a train of waves of gradually varying wavelength. If the growth and decay of the instability wave is included the large-scale struc­tures can be modeled as wavepackets. Tam (1971) was the first to demon­strate a direct link between the instability waves in the thin shear layers close to the jet exit and a radiating wave pattern. Chan and Westley (1973) also demonstrated the connection between the directional acoustic radiation from high speed jets and predictions based on a spatial stability analysis using a vortex sheet approximation to the jet flow. They showed good agree­ment between the computed and measured wavelengths and phase velocities of waves in the near fields of high speed helium jets.

In order to extend these ideas to jets with finite thickness, realistic jet profiles, several researchers used ideas originally proposed by Ko et al. (1970) who examined the development of finite amplitude instabilities in wakes. Chan (1974a), Chan (1974b), Chan (1975), Morris (1974), Mor­ris (1977), Liu (1974) and Tam (1975) predicted the evolution of fixed frequency instability waves in jet flows. Tam and Morris (1985) also used this general formulation to predict the development of tone-excited jets. The mean momentum and energy integral equations, with an eddy viscos­ity model to describe the dissipative action of the small-scale turbulence, were solved to describe the mean jet flow development. The local radial variation of the instability wave properties was obtained from a linear, in­viscid instability analysis, and the amplitude of the instability wave was determined by the integral kinetic energy equation for the wave.

Tam and Morris (1980) and Morris and Tam (1979) showed how the development of an instability wave could be coupled to the near and far sound fields of a two-dimensional shear layer and a jet respectively. The range of validity of these analyses was subsequently extended by Tam and Burton (1984). The local stability analysis of the jet flow that is used to describe the evolution of the instability waves, can be based either on a parallel mean flow approximation or some account can be taken of the effects of the relatively slow axial variation of the mean flow. The method of multiple scales (see Nayfeh (1973)) can be used for the latter purpose. In the method of multiple scales a series expansion is developed for the perturbations developing in the non-parallel mean flow. The expansion parameter є is a measure of the relative rate of change of the mean flow

in the axial to the cross stream directions. In a jet, є ~ dS/dx where S is a measure of the jet shear layer thickness. All the terms in the series expansion are required to have vanishing amplitude at large radial distances. However, Tam and Morris (1980) showed that the multiple scales expansion is not uniformly valid at large radial distances. A complete description of the unsteady field associated with the instability waves, including their acoustic radiation, can be obtained by the method of matched asymptotic expansions. The inner solution is given by the multiple scales solution. This solution involves an uneven stretching of the axial and radial coordinates to allow for the slow axial variation of the jet mean flow. However, there is no such preferred stretching required in the acoustic field. This implies that the coordinates should be stretched equally. The resulting series solution of the linearized equations of motion provides the outer solution. The matching of the two series solutions takes place in an intermediate region where both solutions can be used. For the jet case, the matching procedure is described by Tam and Burton (1984) and complete details are given by Dahl (1994). To lowest order, the pressure outside the jet is given by,

p (г, х,Ф, г) = f g (k) H^) [i (k) r] exp [i (kx + пф – wt)] dk, (45)

Large Scale Structures and Instability Wave Model Theory Подпись: (46)

where,

A0 (єx) is the slowly axially varying amplitude of the leading order term in the inner solution, © (єx) /є provides the corresponding rapid phase varia­tion, k is an axial wavenumber and g (k) represents the Fourier transform of the axial variation of the inner instability wave solution. n is the azimuthal wavenumber, w is the instability wave radian frequency, and нП1 [ ] is the Hankel function of the first kind and order n.

A (k) = (k2 – p0M2w2)1/2 with 0 < arg (A)<n/2 (47)

where p0 is the ambient density nondimensionalized by the jet exit mean density. The pressure in the far field can be obtained by replacing the Hankel function in Eqn. (45) by its asymptotic form for large argument, introducing spherical polar coordinates centered on the jet exit with the polar axis aligned with the jet axis, and evaluating the resulting integral by the method of stationary phase (see Tam and Morris (1980)). The
stationary point is given by

Подпись: (48)ks = p^Mj ш cos в

where в is the polar angle. The mean square pressure in the far field is then given by

D (в) = Е2 NR_ = 4 g (ks)2 (49)

Thus, the far field directivity is determined by the magnitude of the compo­nent of the instability wave’s axial wavenumber spectrum that has a sonic phase velocity in the direction of the far field observer. This condition ap­plies in general and must be met by any source spectrum for noise radiation to occur.

Large Scale Structures and Instability Wave Model Theory Подпись: (50)

Equation (49) is sufficiently simple that it provides an opportunity to examine the effect of the instability wave’s phase velocity and amplitude growth and decay on the far field directivity. Detailed calculations of the amplitude and phase evolution of a single frequency instability (see Tam and Burton (1984)) suggest that,

Подпись: A D (в) = —2 exp Подпись: w(1 - M c“в)2 Подпись: (51)

where A and a control the amplitude and its growth and decay rate respec­tively, xo is an arbitrary axial location for the wave’s maximum amplitude, and c is the nondimensional instability wave phase velocity (assumed to be constant). Then, from Eqn. (49) the far field directivity is given by,

where, Mc = cUj/ao. If the instability wave’s phase velocity is supersonic with respect to the ambient speed of sound ao, that is, Mc > 1, the far field directivity will have its peak amplitude at,

вреак = cos1 (1/Mc) . (52)

However, even if the instability wave travels at a subsonic phase velocity, relative to the ambient speed of sound, the instability wave or wavepacket can still radiate to the far field. In this case, the peak radiation direction will occur at 0 = 0. The amplitude is controlled by the value of a: the growth or decay factor of the wave amplitude. If a >> 1, D (в) varies slowly with 0. This is the case where either the growth or decay of the instability wave amplitude is very rapid. However, if a << 1, and the wave’s amplitude variation is slow, the far field sound pressure level would fall very rapidly with increasing в. Tam and Morris (1980) showed that if the growth and
decay of the instability wave is determined by linear theory, a is relatively small and the decrease in noise radiation levels with decrease in (shear layer) Mach number is very rapid. This suggests that the instability waves or large – scale structures are very inefficient noise radiators at convectively subsonic conditions. However, if the amplitude variation, most likely the decay of the large-scale structures, is controlled by a nonlinear process, then a rapid decay is possible and the radiation efficiency of the large scale structures would be significant. This issue is discussed again in Section 3.3.

So far, only a single frequency instability wave has been considered. At low to moderate Reynolds numbers, such as in the experiments by McLaughlin et al. (1975), McLaughlin et al. (1977), a single frequency or azimuthal mode number can be excited easily. At high Reynolds num­bers the jet turbulence has a broadband spectrum. Tam and Chen (1979) developed a stochastic model for the large-scale turbulent structures in a two-dimensional shear layer in terms of a random superposition of the shear layer instability waves. The spectrum and two-point statistics were shown to be dominated by the most unstable mode. As described in Section 4.3 below, Tam (1987) used this stochastic description of the turbulence to develop a prediction scheme for broadband shock-associated noise. Morris et al. (1990) also used a broadband excitation of instability waves in a shear layer to simulate the axial evolution of the shear layer growth rate and the turbulence spectrum. This model was able to predict the absolute value of the shear layer growth rate for a wide range of velocity ratios and Mach numbers, without the need to specify any empirical model constants. These ideas were extended to jets by Viswanathan and Morris (1992). All these models demonstrate that the turbulence spectrum at the largest scales is controlled by the large-scale structures. In addition, the models are weakly nonlinear: that is, there is no significant interaction between different fre­quency and azimuthal mode number components. Thus, the broadband noise spectrum can be considered as a random superposition of the contri­butions of individual frequency and azimuthal mode number components. In closing this discussion it is important to note that the noise radiation by the large-scale structures or instability waves is broadband, though its peak will be at relatively low frequencies, so it is not readily distinguished from the noise radiation by the fine-scale turbulence. However, the two mecha­nisms do generate different spectral shapes in the far field. This is discussed further in the next section.

3.3 Similarity Spectra and the Two Mechanisms of Turbulent Mixing Noise

Two mechanisms have been recognized in the generation of turbulent mixing noise. The first is associated with the large-scale structures in the jet. The second is related to the more random spatial and temporal behav­ior of the smaller turbulent scales. The prediction of jet noise radiation by the large scales can be determined within the framework of an instability wave model as described in Section 3.2. In very high speed jets there is a direct weakly nonlinear coupling between the flow disturbances created by the large-scale structures and the acoustic field they generate. At lower jet velocities, a strong nonlinear mechanism is likely to be needed for the spatial and temporal behavior of the large-scale structures to generate the wavenumbers necessary for noise radiation. However, at this time, no first principles theory exists for noise radiation by large-scale structures in con­vectively subsonic jets. On the other hand, the smaller-scale turbulence, when viewed in terms of its wavenumber and frequency content, is able to generate radiating components. But the energy-containing components of the turbulence are not efficient noise radiators in convectively subsonic jets. The theoretical description of this noise generation process is the one found in almost all models based on the acoustic analogy, described in Section 3.1, as well as the model proposed by Tam and Auriault (1999), to be described in the next section.

Since the radiation by the large-scale structures involves a direct con­nection between the jet turbulence and the acoustic field, this process does not experience mean flow/acoustic interaction effects. On the other hand, noise from fine-scale turbulence, being a more local process within the tur­bulent jet plume, is subject to refraction as the generated sound propagates through the sheared mean flow. Both mechanisms generate sound over a broad range of frequencies, though the large-scale structure noise is strongest at low frequencies and in directions close to the downstream jet axis.

In the mixing layer of a high Reynolds number turbulent jet, there is no intrinsic length scale. Furthermore, molecular viscosity is not important, except as an energy sink at the smallest scales. So high Reynolds number jets exhibit a dynamic, inviscid behavior. Hence, there is also no intrinsic time scale in this region of the jet. Experimental measurements have shown that the mean flow as well as the turbulence statistics exhibit self-similarity. Tam et al. (1996) contended that the noise from the fine scale turbulence is also generated in the same region of the jet, where the flow properties are similar. Based on these observations, they proposed that the noise spectra of both the large and small scale noise components should also exhibit self­similarity. They reasoned further that the absence of a time (or frequency)
scale implied that the frequency f must be scaled by fL, the peak frequency of the large turbulent structures noise spectrum or fF the peak frequency of the fine-scale turbulence noise spectrum.

Tam et al. (1996) expressed the jet noise spectrum S as a sum of the two independent noise components, in the following similarity form,

Подпись: S =(53)

F(f/ fL) and G(f/fF) are the similarity spectra associated with the large – scale and fine-scale turbulence, respectively and r is the radial distance to the observer from the jet exit. These spectrum functions have been normalized such that F(1) = G(1) = 1. A and B, the amplitudes of the two spectra, and the peak frequencies fL and fF are functions of the jet operating conditions and direction of radiation.

Tam et al. (1996) also recast this equation in decibel form as,

10bg)=10bg(£F(і>lG(і))-20bg(D) (54)

where pref is the standard reference pressure (2 x 10⁻⁵ N/m2) of the decibel scale. If this hypothesis is true, then this equation would be valid for any jet operating condition and radiation angle. At large aft angles where the large-scale structure noise is dominant, and in the forward quadrant where the fine scale structure is dominant, the above equation reduces to a simpler form with the measured spectra characterized by either the large-scale or fine-scale component, F or G.

Tam et al. (1996) investigated the jet noise database acquired with round nozzles, operated at supersonic Mach numbers, at NASA Langley’s Jet Noise Laboratory (JNL). This database consisted of narrow-band data with a 122 Hz bandwidth that covered a Mach number range of 1.37 to 2.24 and a total temperature ratio range of 1.0 to 4.9. From a selected subset of this database, they developed two empirical similarity spectrum functions and determined that the empirical spectra fitted the measured spectra over the entire range of Mach numbers and temperature ratios. Figure 16 shows the shape of these two similarity spectra, 10 log F and 10 log G, plotted on a decibel scale as a function of log (f / fpeak). The shapes of the two similarity spectra are very different. The spectrum associated with the large-scale structures (10 log F) has a narrow peak and drops off linearly, while the spectral shape associated with the fine-scale turbulence (10 log G) has a broader peak and a more gradual roll off away from the peak. The correct

Tam (1998a) also examined the supersonic noise data of Yamamoto et al. (1984) from a variety of round nozzles: convergent, C-D, conver­gent with a plug, C-D with a plug, and a 20-chute C-D suppressor. Good agreement between the similarity spectra and measurements for both static and wind-on conditions, was found. This study indicates that the turbu­lent mixing noise of supersonic jets from not-too-complex nozzle geometries consist of two components. In addition, the shapes of the noise spectra of supersonic jets are very similar regardless of the nozzle geometry.

More recently, Tam and Zaman (2000) carried out some simple experi­ments and measured noise from elliptic (AR=3.0) and rectangular (AR=3.0, 8.0) nozzles, a circular nozzle with 2 and 4 tabs, and a six-lobed mixer noz­zle. All the test points were restricted to unheated jets at subsonic Mach numbers. The results showed that, in general, turbulent mixing noise from
non-circular subsonic jets can also be described by the two similarity com­ponents. However, it should be borne in mind that the quality of this data set is questionable. One interesting result of this study is that the noise field of the lobed mixer was very different from those from the other simpler ge­ometries. The lobed mixer, designed to enhance perimeter mixing with the ambient fluid, divides the main jet into many thin sheets at the nozzle exit. As such, flow from this geometry does not apparently support large-scale structures comparable in scale to the equivalent circular diameter. The test results indicated that the noise spectrum at large aft angles, where the large-scale structure noise typically dominates, fitted the spectrum associ­ated with fine-scale turbulence. Tam and Zaman (2000) concluded that the nozzle geometry, by suppressing the development of large-scale structures, effectively eliminated the noise associated with this component. In the ab­sence of this component, the fine-scale noise component becomes dominant at all radiation angles.

In summary, there is strong evidence that two self-similar spectra can be used to characterize the radiated noise spectra for a wide range of jet operating conditions. This applies to supersonic jets, from both circular and other simple non-circular nozzle geometries as well as cold subsonic jets. The spectra at lower angles to the jet inlet from heated subsonic jets can also be characterized by the fine-scale similarity spectrum. At angles close to the jet downstream axis, the spectral shape changes at higher temperatures, as noted by Viswanathan (2004). An important point to remember is that all these experimental data are restricted to single stream nozzles. However, in closing this section, it should be noted that other explanations for the different spectral shapes between the sideline and large aft angles are available. For example, it has been argued that a combination of convective amplification, Doppler frequency shift, and mean flow/acoustic interaction effects, could result in the observed spectral changes with angle. This hypothesis is the basis for the jet noise model developed by Morfey and Szewczyk (1978) as well as the MGB and MGBK methods discussed in Section 3.1. It remains to be determined whether one or other of these descriptions of turbulent mixing noise generation, or a combination of the two, are valid.

Lighthill’s Acoustic Analogy

A general theory for sound generated aerodynamically was developed by Lighthill (1952). He chose to formulate the problem by comparing the full equations of motion with the equations governing density fluctuations in a uniform acoustic medium at rest. The differences were considered to be the effect of a fluctuating force field, acting on the uniform acoustic medium, which would be known if the flow were known. Such an approach has been called an acoustic analogy, as it replaces the physical noise sources by a distribution of equivalent sources. Lighthill’s equation was introduced in Chapter 1. Here it is written as,

– a2 d2P = дТ (3)

dt2 o dxidxi Oxidxj

Tij, known as the Lighthill stress tensor, is the instantaneous applied stress at any point given by,

Подпись: (4)Tij = pViVj + pij aopSij,

Подпись: pij = p$ij P Подпись: dvi dxj Подпись: dj dxi Lighthill’s Acoustic Analogy Подпись: (5)

where pij is the compressive stress tensor, given for a Stokesian gas by

p is the coefficient of viscosity and p is the thermodynamic pressure.

For low Mach number, unheated flows, Lighthill argued that Tij ~ poviVj where po is the constant mean density of the medium. It should be noted that the equivalent source term, d2Tijfdxidxj contains all physical effects such as convection and refraction. It is also important to note that vi is the instantaneous velocity: not a perturbation about a mean value. To over­come this problem to some extent it is possible to write the equations of motion in a frame of reference moving with the mean axial velocity, with the time derivatives replaced with convective derivatives and where the veloc­ities are perturbations about the mean velocity. Then the Lighthill stress tensor is nonlinear in the fluctuations. This generalization of Lighthill’s acoustic analogy for sources embedded in a uniform mean flow is described by Dowling et al. (1978). Alternatively, the average of the equation can be subtracted from its instantaneous form. This approach has been used in more recent acoustic analogies.

Подпись: P (x,t)-po = p (x,t) Lighthill’s Acoustic Analogy Подпись: (6)

In any event, the solution to Eqn. (3) can be obtained using the free space Green’s function for the wave equation,

where ті is the retarded time,

Подпись: (7)Ті = t — |x – y|/ao

Подпись: p (x,t) Lighthill’s Acoustic Analogy Подпись: (8)

In the far field where x = |x| >> |y|, Eqn. (6) becomes

Подпись: p (x,t) Lighthill’s Acoustic Analogy Подпись: (9)

If it is assumed that the velocity scales with the jet exit velocity Vj and that the time rate of change of the source term varies as Vj /£ where I is a characteristic length scale, it is readily shown that

where it has been assumed that t scales with the jet exit diameter dj and x ~ |x — y| in the far field. The far field intensity I (x), defined as the

Подпись: I (x) Lighthill’s Acoustic Analogy Подпись: (10)

Подпись: 1 (x,TlПодпись: (14)acoustic energy flux per unit area, is given by

where ( ) denotes the time average value and Ma is the acoustic Mach number: the ratio of the jet exit velocity to the ambient speed of sound. This gives Lighthill’s famous eighth power law, that the total acoustic power output is proportional to

PoVfMld] (11)

Since the total mechanical power of the jet is proportional to poV^dj, the acoustic efficiency is approximately

(12)

The constant of proportionality can be estimated to be very small (of the order 10-4) so, fortunately, the acoustic efficiency is very low.

Lighthill (1954) applied his general theory to the sound generated by turbulence. He related the sound intensity in the far field to the statistical properties of the turbulent sources. To account for the effects of convection of the turbulent eddies in the jet, the statistical properties were described in a moving reference frame. Ffowcs Williams (1963) provided a more complete analysis of the effects of convection as well as the effect of the relative motion of the jet exhaust and the observer. He also showed how to remove an apparently singular result that occurs when the sources convect at the speed of sound in the direction of the observer. These results are most clearly developed in terms of the source wavenumber frequency spec­trum. To see this, following Proudman (1952), the source component in the direction of the observer is introduced such that

T (xi – Vi)(xj – yj) T (13)

Txx = 2 1ij (13)

Iх – y|

This form is appropriate for isotropic turbulence. For statistically stationary turbulence the intensity can be obtained from the autocorrelation of the far field density in the form,

~ T +——— for |x| >> |y| (15)

Подпись: where the integrand is to be evaluated at * , |x - y| - Iх - y - Д| Подпись: Д • xaQ aQ x

Rf (y, Д ,t) is the cross correlation of the Lighthill stress tensor, given by

Rf (y, Д, т) = (Txx (y, Ti) Txx (y + Д, ті + T)) (16)

Подпись: Hf (y, к,ш) Lighthill’s Acoustic Analogy Подпись: If Rf (y, Д,т) exp [-i (шт + k • Д)] (1Д(1т Подпись: (17)

where Д is the separation distance between the two source locations. The superscript f indicates that the correlation is performed in a fixed reference frame. The wavenumber frequency spectrum of the sources is defined as the Fourier transform of the cross correlation function. That is,

here, k and ш are a wavenumber vector and radian frequency respectively. Also, the spectral density of the intensity at the observer S (x, y), where 7 is the observer frequency, is given by the Fourier transform of the intensity,

S (x, Y) = 2П f 1 (x, T*) exp (-ijr *) dr * (18)

Подпись: S(x,Y) Lighthill’s Acoustic Analogy Подпись: (19)

Then, it is readily shown that,

Equation (19) shows that the spectral density depends on an integral over the source volume of the frequency-weighted source wavenumber frequency spectrum. It is important to note that, for a given observer frequency y, only the wavenumber component of the source spectrum that has a sonic phase velocity in the direction of the observer contributes to the radiated noise. As discussed by Ffowcs Williams (1963), Crighton (1975) and Gold­stein (1984), among others, this means that only a small fraction of the wavenumbers present in the turbulence can contribute to the noise radia­tion for convectively subsonic jets (Ma ^ 1.4).

In the practically important case where the convection is in the axial direction, a new coordinate is introduced such that

Подпись: (20)5 = Д – Ucti

where i is the unit vector in the xi, axial, direction. Then the far field autocorrelation for the intensity is given by

I S’ S’ d4

I (x, T*)= 16n2p a5 J J |1 – Me cos 0|-5 dT4Rm (y, 5,t) d5dy (21)

where

Rf (y, A, r) = Rm (y, 5,t) (22)

The superscript m refers to a correlation in the moving reference frame and в is the polar angle of the observer relative to the downstream jet axis. The integrand in Eqn. (21) is to be evaluated at

Подпись: (23)5 ■ x/x + aoT* ao (1 – Mc cos в)

Подпись: Hm (y, к,ш)
Подпись: (24)

and Mc = Uc/ao. If the wavenumber frequency spectrum in the moving reference frame is defined by

Y4Hm (y, -^,ш) dy aox

Подпись: S(x,Y) Подпись: 2poa5x2 Подпись: (25)

then the spectral density is given by

with

ш = y (1 – Mc cos в) (26)

It is important to remember that 5 = 5 (t) in the differentiation in the integrand of Eqn. (21): see Ffowcs Williams (1963). Again the radiated noise is at a wavenumber that gives a sonic phase velocity in the direction of the observer at the frequency Y: but, the source spectrum is now evaluated at a Doppler shifted frequency, ш given by Eqn. (26).

Source Cross Correlation Function In order to make any noise predic­tions, based on the preceding formulas for the spectral density, it is necessary to provide a model for the source cross correlation function. In addition, though the introduction of the Proudman (1952) form of the correlation in Eqn. (13) simplifies the algebra, it conceals the individual contributions of the different components of Tj. Ribner (1969) derived expressions for the relative weightings of the individual source correlations to the far field intensity for an axisymmetric jet. He assumed that the correlation involv­ing the velocity fluctuations had a joint normal probability. This enabled {uiuju’ku’i) to be written in terms of the second moments (uiuj), etc.

Models for the source correlation function have been based on an as­sumption of isotropic turbulence (for example, Ribner (1969), Balsa and Gliebe (1977), Lilley (1995) and Lilley (1996)), axisymmetric turbulence (Khavaran (1999)), on measured two-point velocity correlations such as

‘ІХ 2 62 62

°1 , °2, °3 , , ,2 2 -( $ + <2 + <[3] + ^ T

Подпись: Rm (У, 6, T) =p2su4s exp Подпись: )] Подпись: (27)

those obtained by Davies et al. (1963) and Chu (1966), or based on Large Eddy Simulations (Karabasov et al. (2010)). For example, consider a source correlation in the moving reference frame with a Gaussian form2. That is,

ps, us, and us are density, velocity fluctuation, and frequency scales in the source region. < are the source length scales in the y directions. All these scales are functions of the source location У. It should be noted that this form is chosen for simplicity and is only a crude approximation to the actual cross correlation. So it should only be used to obtain estimates for the overall sound power radiated rather than detailed spectral densities and directivities. Lilley (1995) has argued that, though there may be large negative values in the longitudinal correlation in the fixed reference frame, the moving frame correlation is likely to be positive except at large separations. The wavenumber frequency spectrum corresponding to the correlation in Eqn. (27) is readily obtained and then Eqn. (25) yields the far field spectral density,

Подпись: (28)S (X y) ■ 32^2 I tll2<2(У ) exp (-If) <iy

(1 – Mc cos в)2 + (<2 cos2 в + <2 sin2 в)

<1 <2<3P2sUsU

Lighthill’s Acoustic Analogy

where Cg is referred to as the modified Doppler factor given by,

The source strength in the denominator of the integrand in Eqn. (30) is weighted by five inverse powers of the modified Doppler factor. This is called the convective amplification effect. In general terms, this results in an increased intensity for observer locations closer to the downstream jet axis. However, this directivity is modified by mean flow-acoustic interaction effects. These are described in the next section.

Mean Flow-Acoustic Interaction Effects Lighthill’s simplification of his equivalent source term to povivj is valid for low Mach number unheated jets. Detailed measurements of jet noise spectra and directivity over a range of operating conditions by Lush (1971) and Ahuja and Bushell (1973), in­dicated that the theoretical predictions embodied in Eqns. (28) and (30) did not match the experiments: particularly at angles close to the down­stream jet axis and at high frequencies. Atvars et al. (1965) had performed experiments with point sources embedded in a jet flow and showed that refraction effects by the jet flow were important. These experimental ob­servations complemented attempts to extend Lighthill’s acoustic analogy to include the effects associated with the equivalent sources being surrounded by a moving, sheared flow. Phillips (1960) developed an acoustic analogy that included the effects of a uniform mean flow. However, it was Lilley (1972), Lilley (1973) who argued that the Phillips’ acoustic analogy still in­cluded mean flow acoustic interaction effects in its equivalent source term. Lilley developed an acoustic analogy such that the equivalent sources acted on a parallel shear flow. Lilley (1972), Lilley (1973) originally followed Phillips (1960) by first developing a convected wave equation for the loga­rithm of the pressure.

The equations of continuity, momentum and energy, and the equation of state for a perfect gas can be rearranged in the form

Dn dvi Dt dxi ’

(31)

and

where,

Dvi 2 dn Dt dxi, ’

(32)

П = bn (P) ,

Y Po /

(33)

and

D _ д d Dt dt j dxj

(34)

po is the mean static pressure that is assumed to be constant and a is the speed of sound that may vary. Phillips’ equation is obtained by elimination of the divergence of the velocity from Eqns. (31) and (32), giving

D2n d ( 2 dn ) dvj dvi

Dt2 dxi ( dxi) dxi dxj

If the variables in Eqn. (35) are decomposed into fluctuations about the mean thermodynamic properties and a parallel mean flow of the form ui =

Do [ D2n’ Dt Dt2

dV d2n’

dxa dxdxa

Подпись: where a = 2,3, and Lighthill’s Acoustic Analogy Подпись: = r, Lighthill’s Acoustic Analogy

V (x2,x3) 5ц is introduced, where the overbar denotes a time average, the term on the right hand side of Eqn. (35) is found to contain terms that are linear in the perturbations. Lilley (1972), Lilley (1973) argued that only terms that are second order in the fluctuations should be considered as equivalent sources, as linear terms describe propagation effects. If the con­vective derivative operator, Eqn. (34) is applied to Eqn. (35), the variables are again decomposed, and only linear terms are retained on the left hand side, Lilley’s equation is obtained,

The source term Г is at least second order in fluctuations of velocity and temperature and some terms are multiplied by the mean shear and tem­perature gradients. In the limit of infinitesimal fluctuations, the equation reduces to a homogeneous form first derived by Pridmore-Brown (1958) to describe sound propagation in a duct containing a nonuniform mean flow. It is also known as the compressible Rayleigh equation.

In general, solutions of Lilley’s equation must be obtained numerically. However, asymptotic solutions at low frequency were developed by Mani (1976) who used a vortex sheet approximation for the jet. A solution for a cylindrical vortex sheet representation of the jet mean flow was also given by Dowling et al. (1978). High frequency solutions have been obtained by Balsa (1976) and Goldstein (1982). Solutions based on ray acoustics are given by Durbin (1983).

The general characteristics of solutions to Lilley’s equation are explained most simply by considering a two-dimensional mean flow with V = V (y) as discussed by Lilley (1972). For simplicity, the speed of sound is assumed to be constant. If solutions of the form[4]

П ~ f (y) (1 – kM) exp [ik (kx – aot)], (38)

are introduced into Lilley’s equation, where M = V/ao, the equation takes the form

d2 f

df + q (y) f = r (y), (39)

Подпись: q (y) = k2 [к2 -(1 - KM)2] Lighthill’s Acoustic Analogy Подпись: (dM2] 2к I )  dy ) Подпись: (40)

where,

and r (y) is representative of the source distribution. The turning points of Eqn. (39) correspond to q (yc) = 0. For q (y) > 0 the general solutions are periodic and propagation will occur. For q (y) < 0 the solutions decay exponentially. At high frequencies q (y) is dominated by the first term. Now, к = kl/k = cos в is the angle of radiation relative to the downstream jet axis. It is readily shown that the turning points correspond to

Подпись: (41)вс = 1/(1 + M)

For в < вс the sound experiences exponential decay away from the source while for в > вс the sound waves are able to propagate. вс is the boundary of the zone of silence of geometric acoustics. This is equivalent to Snell’s law in optics.

Since, in a real jet, the flow is not truly parallel, but develops slowly in the axial direction, вс also changes with axial distance. Also, a sound wave may only experience exponential decay for a portion of its propagation path before radiating. Finally, the simple result of Eqn. (41) is only true at very high frequencies. All these factors result in a zone of silence that is not completely silent. The greatest attenuation and refraction occurs for the highest frequencies and low frequencies are relatively unaffected.

Noise Prediction Models Based on the Acoustic Analogy In spite of the considerable effort expended on theoretical developments arising from the acoustic analogy, actual noise prediction methods are scarce. At the simplest level some general scaling laws have been developed. These are well summarized by Ribner (1964) and Lilley (1995). An example is the ‘slice-of-the-jet’ method in which contributions to the overall radiated power from axial slices of the jet are estimated. For example, Eqn. (30) can be integrated over all angles, with the convective amplification effects neglected for simplicity, to give the radiated power from a volume element of the jet as,

dP – ^ dV (42)

a,%

Here, it has been assumed that the source length scales are all proportional to £s, that the source density is equal to the ambient density, and that us ~ us/£s. In the annular mixing region of the jet, us ~ Uj, dV ~ Djxdx,
and £s ~ x. In the developed region of the jet, us ~ UjDj/x, dV ~ x2dx, and £s ~ x. So that,

dP f (poUjDjfa50) in the annular mixing region

dx (p0UjDj/a0o) (x/Dj) 7 in the developed jet

Thus, the contribution to the radiated power from each axial slice of the jet is constant in the annular mixing and then decays rapidly beyond the end of the potential core. If these expressions are integrated with respect to x, the eighth power law given by Eqn. (11) is obtained. Since us ~ us/£s, the characteristic source frequency scales as Uj /x in the annular mixing region and as Uj Dj /x2 in the developed jet. Then the spectral density of the acoustic power is given by,

Подпись:dP dP dx df dx df

(44)

Thus, the acoustic power spectrum is predicted to scale as f 2 at low fre­quencies (generated predominantly in the developed jet) and f -2 at high frequencies(generated near the jet exit in the annular mixing region). These results give an indication of the regions of the jet responsible for sound gen­eration and provide an overall picture of jet noise scaling and are useful for preliminary design estimates. But they do not predict absolute amplitude and mean flow/acoustic interaction effects are not included.

The first method to attempt to predict both the aerodynamic and acous­tic properties of jets was the Mani-Gliebe-Balsa (MGB) prediction scheme (see Balsa et al. (1978)). In this method the jet aerodynamics were predicted using the turbulence model of Reichardt (1941) in which the jet plume is synthesized by a summation of elemental jets each with a Gaussian velocity profile. Comparisons of the aerodynamic predictions with measurements are given by Gliebe and Balsa (1978) as well as Gliebe et al. (1995). To obtain the characteristic frequency and length scales needed to describe the acous­tic sources, such as those in Eqn. (28), two models were used. Balsa and Gliebe (1977) assumed that ш ~ (r/p)1/2/£ with I ~ (x/u)(r/p)1/2. Here, т is the magnitude of the Reynolds shear stress that is given by Reichardt’s turbulence model and U is the mean axial velocity. Gliebe and Balsa (1978) assumed that ш was proportional to the local mean velocity gradient and £ ~ u’/ш, where u’ is the local turbulence intensity. Mean flow acoustic interaction effects were modeled using solutions to Lilley’s equation [Eqn. (36)] with the multistream jets modeled as cylindrical vortex sheets. Sim­ilar solutions had been obtained by Mani (1976) and Balsa (1975). The
relative contributions from the individual components of the source term were based on the quadrupole correlations developed by Ribner (1969) that assumed isotropic turbulence in a moving reference frame. Some compar­isons between predictions and measurements are given by Balsa and Gliebe (1977) and Gliebe and Balsa (1978). The agreement between predictions and measurements is generally reasonable, though significant discrepancies are evident in the directivities at higher frequencies and the individual 1/3 octave spectra at different angles.

A different prediction methodology developed from the noise source and propagation model is described by Tester and Morfey (1976). The empha­sis of this study was on the prediction of the mean flow/acoustic interaction effects on the sources described by Lilley’s equation. They derived both high frequency (Geometric Acoustics) and low frequency solutions to Lil – ley’s equation. This analysis led to the notion that if the noise spectra at 90 degrees to the jet axis were known then the noise spectra at any other angle could be predicted using their acoustic model. Morfey and Szewczyk (1977a), Morfey and Szewczyk (1977b) used a large database of experimen­tal data and removed all amplitude scaling factors and mean flow/acoustic interaction effects as described by a high frequency solution to Lilley’s equa­tion. This enabled them to construct two master spectra representing the spectral shapes at 90 degrees to the jet axis. They needed two spectra to be able to correlate the spectra for hot, low speed jets, where sources associated with the temperature fluctuations in the jet were argued to be important. However, as discussed by Viswanathan (2004), and shown in Figure 15, the change in spectral shape at low Mach numbers can be asso­ciated with a Reynolds number effect. Morfey and Szewczyk (1978) give a summary of their predictions for noise radiation outside the zone of silence. Predictions within the zone of silence, described by Morfey and Szewczyk (1977b) were less satisfactory, particularly for very high speed jets. How­ever, no account of the noise radiation by the large-scale structures was included in their model, so this result is perhaps not surprising. It should be emphasized that this model was purely acoustic in that it didn’t attempt to predict any turbulence properties to be used to model the noise source characteristics. Any changes in the jet turbulence, perhaps by the addition of a noise reduction device, would not be reflected in the noise predictions as the master spectra were developed for an unmodified single jet. Morris and Tanna (1985) were able to adapt the model to predict the noise radiated by coannular jets with the core stream faster than the fan stream. They did this by dividing the jet into three equivalent jets to represent the inner and outer shear layers and the developed region of the jet. Good agreement with experiment was obtained using reasonable assumptions for the properties of
Подпись: 23 25 27 29 31 33 35 37 39 41 43 45 47 49 Band number 0.2 0.5 1.25 3.15 5 12.5 20 50 80 Frequency, KHz

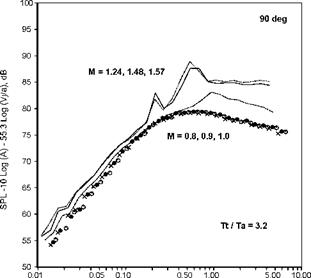
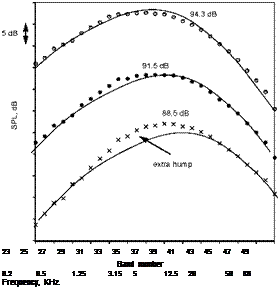
Figure 15. Comparison of measured spectra with fine-scale similarity spec­trum. M = 0.7, Tt/Ta = 3.2, ф = 90 degrees. x, D = 3.81 cm; •, D = 6.22 cm; O, D = 8.79 cm.(From Viswanathan (2004), with permission).

the separate jets.

In an effort to improve the generality of the aerodynamic component of the MGB code, Khavaran et al. (1994) replaced Reichardt’s turbulence model with a к – є model. This revision and its extensions are known as the MGB-Khavaran (MGBK) model. The acoustic formulation in terms of source description was unchanged but the mean flow/acoustic interaction effects were based on high frequency solutions of Lilley’s equation by Balsa (1976). The length and frequency scales required to define the source spec­tral characteristics were written in terms of к and є such that I ~ к3/2 /є and ш ~ є/к. Flow and noise predictions were made for a single C-D nozzle with Mj = 1.4 and Tt/Ta = 3.3 The variation of overall SPL was predicted reasonably well: but 1/3 octave spectra predictions, particularly away from the peak noise direction, were less satisfactory. Two additional changes were reported by Khavaran (1999). Firstly, rather than using an isotropic description of the acoustic sources, an axisymmetric turbulence model was
incorporated. In such a model, the axial turbulence intensity is assumed to be greater than the other two components that are equal. This is a better representation of the measured anisotropic properties of the turbulence in the jet. Noise and flow predictions were made for a dual stream nozzle. The primary and secondary Mach numbers and total temperature ratios were Mp ~ 1.0, Ttp/Ta = 2.7 and Ms ~ 1.0, Tts/To ~ 1.0. Khavaran examined the effects of the ratio of the axial and lateral turbulence intensities on the radiated noise as well as the contributions of “self” and “shear” noise. The predictions showed an improvement over the previous ones ( Khavaran et al. (1994)), particularly for the 1/3 octave spectra. However, the revisions in the source description permitted two more empirical factors to be assigned: the ratios of the turbulence intensities and the length scales in the axial and lateral directions.

Viswanathan (2001) describes a comparison of predictions of single stream jet noise with measurements, using both the MGBK method and the fine-scale turbulence mixing noise model by Tam and Auriault (1999). This latter model, as well as additional recent prediction models, is de­scribed in Section 3.4 below. The predictions were made without any prior access to the experimental data. In general, the spectral predictions with the Tam and Auriault model were superior to those made with the MGBK method. However, as discussed further in Section 3.4, the fine-scale turbu­lence model does not provide predictions in the peak noise direction. Tam and Auriault (1999) argue that the noise radiation in this direction is domi­nated by noise from the large-scale turbulent structures. The mechanism by which this noise generation and radiation process occurs and its modeling are described in the next section.

Turbulent Mixing Noise

Experiments and analysis of turbulent mixing noise have been ongoing for fifty years. For most of this period, the acoustic analogy, proposed by Lighthill (1952), Lighthill (1954), and its extensions, have dominated anal­ysis and predictions. In the 1970’s, it was recognized that large-scale tur­bulent structures in the jet mixing layer are very efficient noise radiators in high-speed jets. In addition, with recent increases in computational power, Direct Numerical Simulations (DNS) and Large Eddy Simulations (LES) have shown their potential to provide a complete three-dimensional, time – dependent prediction of both the flow and noise of jets.

In Section 3.1 the early acoustic analogy models and their subsequent extensions to include the effects of source convection and mean flow re­fraction are described. Jet noise prediction schemes based on the acoustic analogy are also introduced. Section 3.2 describes the mechanism of noise generation by large-scale turbulent structures, modeled as instability waves. The associated analytical and numerical predictions are also introduced. A recent empirical correlation of turbulent mixing noise directivity and spec­tra is described in Section 3.3. Finally, the model of Tam and Auriault (1999) for noise generation and radiation by fine-scale turbulence, as well as more recent improvements in acoustic analogy-based models, are described in Section 3.4.

Forward Flight Effects

The effects of forward flight on aircraft noise are difficult to quantify for a variety of reasons. Even the measurement of this effect poses a signifi­cant challenge; validated predictions of the effects of flight are consequently harder. Flight testing of aircraft is very expensive and time-consuming. Sev­eral factors such as multiple engine noise sources, multiple engine configura­tions, engine installation effects and non-uniform flow around the engines, atmospheric propagation effects, varying weather conditions over very long propagation distances, ground reflection, and ground absorption at shallow grazing angles render even the interpretation of the measured data very difficult. Given this level of complexity, it is not surprising that there is no consensus on what constitutes a flight effect for individual engine noise components. Since the early seventies, many experimental techniques have been developed that attempt to simulate a real aircraft flyover. These have consisted of a jet embedded in a wind tunnel, a jet mounted on tracked ve­hicles on land, a jet mounted on a whirling rotor arm, and taxiing aircraft. Crighton et al. (1976) provide a critical evaluation of the different tech­niques and the advantages and disadvantages associated with each. They highlighted some fundamental issues regarding the necessity to preserve the dimensionless parameters at the model-scale and the importance of the de­tailed nature of the noise source and its acoustic environment, in evaluating the direct effect of flight on source strength.

Nowadays, flight effects are usually assessed by embedding a jet simu­lator in a free jet wind tunnel of much larger diameter, in a large anechoic chamber. Von Glahn et al. (1973), Cocking and Bryce (1975), Bushell (1975), Packman et al. (1975), and Tanna and Morris (1977) carried out some of the earliest studies. In wind tunnel tests, the microphones are located either in the tunnel flow or in the static environment outside the tunnel flow. The latter case of out-of-flow measurements are the easiest to perform and true far field measurements can be made. However, correc­tions are needed for the propagation of sound through the tunnel jet shear layer. Some of the factors that need to be considered in the development of these corrections are: the finite thickness of the tunnel shear layer; the axial spreading of the tunnel shear layer in the downstream direction; mul­tiple reflections of sound waves between the jet and tunnel shear layers; the scattering of sound by turbulence in the tunnel shear layer; the background noise of the tunnel shear layer; any near field interaction of the jet and tunnel shear layers if the wind tunnel is not large enough; and a few other issues such as the possible excitation of the tunnel flow by the jet. The other major issue concerns the distributed nature of the jet sources. If there is a rapid variation of the correction factor with angle, it is necessary to place the microphones at a large distance from the tunnel shear layer so as to be able to invoke the assumption that the jet acts as a point source. The con­flicting requirements of a very large wind tunnel to prevent the interaction of the jet flow with the simulator shear layer and a large anechoic chamber to ensure far field observer locations pose a tremendous problem and these requirements are not met by many facilities.

In-flow measurements avoid problems with propagation through the tun­nel shear layer. However, the tunnel may not be perfectly anechoic. The problem of the tunnel flow over the microphones is also an issue. However, the biggest concern is the requirement for a very large tunnel to ensure that the microphones are in the far field, especially for a large source region.

Out-of-flow measurements are generally favored. Many of the issues men­tioned above with this type of arrangement have been investigated. Amiet (1975) developed analytical expressions for the calculation of the refraction from the shear layer assuming that the tunnel shear layer could be rep­resented by a vortex sheet. Morfey and Szewczyk (1977a) examined the various issues and recommended some guidelines for the proper choice of tunnel size, jet and tunnel operating conditions, to assure good quality of data. The scattering of sound by the turbulence of the tunnel shear layer was shown to be negligible. This proposed correction procedure was used by Tanna and Morris (1977) to interpret their data. Amiet (1978) evalu­ated the various correction procedures and the validity of the assumptions made in their derivations. All these methodologies attempt to convert the measured wind tunnel data to equivalent flyover conditions. Based on these ideas, the aircraft and engine companies have developed procedures to ex­trapolate the wind-on model scale data to full-scale flyover conditions. One of the biggest differences in these methods is the prescription of the source location for a given frequency. Empirical relations for source distributions have been derived based on theoretical considerations, acoustic mirror mea­surements, microphones located at multiple sideline arrays, and a combina­tion of in-flow and out-of-flow microphones. In the multiple sideline array technique, data from each array are extrapolated to a common larger dis­tance, with an assumed source distribution. Through proper modification of the source locations, the difference between the two sets of extrapolated data is driven to an acceptable tolerance. However, when a novel suppressor nozzle is tested, this process has to be repeated since the source distribu­tions could be very different. Not unexpectedly, the same data processed by different procedures yield slightly different noise estimates. This is not to say that there are fundamental problems with these methods; rather, that the complexities are addressed and treated in different ways.

Norum and Shearin (1988) made extensive measurements of the far field acoustic characteristics and the plume fields of supersonic jets in an open wind tunnel with a tunnel Mach number range of 0.0-0.4. Their study indicated that there were three effects of flight on broadband shock noise. There was a lowering of the peak frequency with flight Mach number. Also, the spectral peak became narrower and several higher-order peaks became prominent with increasing flight speed. Norum and Brown (1993) extended the range of tunnel Mach number by using a free jet of diameter 0.30 m, and performed detailed aerodynamic and acoustic measurements from small convergent and C-D nozzles (Dj = 1.90 cm). The Mach number of the free jet was as high as 0.9. They noticed that the plume characteristics could be altered significantly when the free jet Mach number was increased to higher values. Even for the C-D nozzle at its design Mach number, weak shocks were observed at a flight Mach number of 0.6. With further increase in freestream Mach number, the strength and extent of the shock-containing region increased dramatically. Norum and Brown attempted to isolate the effects of source strength modification, convection due to the freestream and refraction by the shear layer as the flight speed was increased. They reported that the change in source strength for the shock noise was minimal, while the convection effect was very strong. A decrease in peak frequency of broadband shock noise was also observed with increasing flight Mach number. Finally, the effect of flight on turbulent mixing noise showed a monotonic decrease in amplitude with increasing flight Mach number at all frequencies.

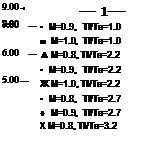
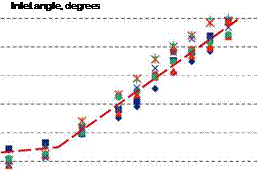
The effects of forward flight on the OASPL is usually characterized in terms of the flight velocity parameter к = 10log10 [Vj/ (Vj – Vt)] where Vj is the jet velocity and Vt is the tunnel or flight velocity. Early studies by Tanna and Morris (1977) and Michalke and Michel (1979) suggest an ex­ponent of 5 to 5.5, especially at 90 degrees. This was argued by Tanna and Morris (1977) to be consistent with the reduction of the turbulence inten­sity with forward flight as measured by Morris (1976). This value has been

Forward Flight Effects

Figure 14. Variation of the relative velocity exponent with radiation angle; various jet conditions (From Viswanathan and Czech (2011)).

used in noise prediction methods to account for the effect of forward flight: for example the ARP876 by SAE (1994). However, recent measurements by Viswanathan and Czech (2011) show a lower value of velocity exponent at sideline angles with a steadily increasing value from inlet angles of 110 degrees. Figure 14 shows this variation of velocity exponent with radiation angle for various jet operating conditions. The reason for this difference could be contamination by the free jet noise and facility noise in the previ­ous experiments: particularly at low jet exit velocities. Viswanathan and Czech (2011) removed any spectra that showed evidence of these effects in determining the velocity exponent. However, this lower exponent is not con­sistent with the measured reductions in turbulence intensities with forward flight. This remains a question to be resolved by both measurements and simulations.

Screech Tones

Powell (1953b), Powell (1953c) was the first to perform detailed in­vestigations of screech tones from model scale supersonic jets. Powell’s experiments from convergent nozzles revealed that the wavelengths of the screech tones increased with increasing NPR and that the tone radiated preferentially in the upstream direction. A two-dimensional nozzle exhib­ited a smooth variation of screech wavelengths with pressure ratio, while an axisymmetric nozzle had discontinuous frequency (and corresponding wavelength) jumps with increasing NPR. He attributed the tone generation phenomenon to a feedback mechanism. Davies and Oldfield (1962) showed that the various screech modes of an axisymmetric nozzle were not dis­joint but actually overlapped, indicating that several modes could co-exist or that the preference for a particular mode switched randomly back and forth. Many investigators have studied the screech phenomenon since then. For example, Hammitt (1961), Westley and Woolley (1969), Westley and

Screech Tones

110

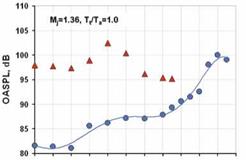
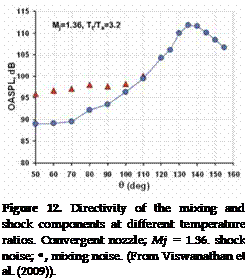
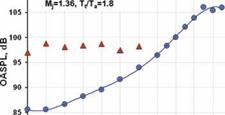
Подпись: Figure 12. Directivity of the mixing and shock components at different temperature ratios. Convergent nozzle; Mj = 1.36. shock noise; •, mixing noise. (From Viswanathan et al. (2009)).

Screech Tones

80 —– 1— 1— 1— 1— 1— 1— 1— 1— 1— 1— 1

Woolley (1975), Rosfjord and Toms (1975), Sherman et al. (1976), and researchers at the NASA Langley Research Center, including Norum (1983) and Seiner (1984), are just a few references. Raman (1998), Raman (1999) has provided an extensive list of references.

The discrete screech tones can be of high intensity depending on the nozzle operating conditions and geometry. Usually, these tones are more pronounced for cold jets, with the amplitude of screech decreasing with increasing jet temperature. As the jet temperature is increased at a fixed Mach number, the screech frequency increases. The frequency of screech is independent of observer angle, indicating that the source of screech is spatially stationary. Simultaneous multiple screech modes are generally observed at most jet operating conditions. Figure 13, from Seiner (1984), shows the screech modes as a function of jet Mach number. This figure is a compilation of various experimental measurements of screech tones obtained with a convergent nozzle and an unheated jet. The round jet exhibits a staging phenomenon when the Mach number is increased, with jumps in the screech frequency. Optical observations have revealed that the different screech modes are associated with different oscillatory modes of the jet plume. These are either toroidal or helical mode instabilities. At lower Mach numbers, the toroidal large-scale instabilities are dominant, while the helical modes become dominant above a Mach number of approximately 1.3. Flow visualizations by Seiner et al. (1986), among others, have shown that the left and right hand helical disturbances are excited simultaneously, causing the jet to flap up and down. However, the azimuthal orientation of the flapping plane is not constant and has been found to precess for as yet unknown reasons. As seen in Figure 13, more than one mode may be present at a given Mach number. However, these tones are not harmonics of each other. As the jet Mach number is increased, the wavelength of the screech increases until a critical value is reached, beyond which a marked jump in wavelength occurs. For the Mach number range of 1.1 to 1.8, more than five modes or stages, labeled A1, A2, B, C, D and E in Figure 13 have been observed. These tones are very sensitive to the details of the experimental facility and not all modes are observed in any individual facility.

In summary, the screech generation mechanism is strongly dependent on upstream geometry. In commercial engines, the nozzle geometry is seldom perfectly axisymmetric. For realistic hot engine flows, screech is not consid­ered to be a problem at all. However, high tone levels have been measured in military aircraft with closely spaced engines. For such aircraft (F-15 and the B1-B), sonic fatigue and structural failure of upstream aircraft com­ponents is a concern. The early work of Hay and Rose (1970) showed clearly that significant noise amplitudes around the screech frequency could

Screech Tones

Figure 13. Variation of fundamental screech tone wavelength with Mach number for various stages of screech. Convergent nozzle and unheated flow. (From Seiner (1984), with permission).

be present for some engine conditions and geometries. As the flight altitude increased, the nozzle operated at supersonic conditions due to the decrease in ambient static pressure. Consequently, high tone levels were observed at cruise. Prolonged exposure to the high dynamic loads, when there was a matching of the screech frequency and that of the structural modes caused structural damage. Seiner et al. (1987) investigated the screech character­istics and the plume dynamics of twin supersonic jets using axisymmetric C-D and rectangular nozzles. The study revealed that when two adjacent supersonic nozzles have a centerline spacing less than two nozzle diameters, the axial evolution of each nozzle plume’s preferred shear layer instability wave was coupled. This coupling process stimulated an axially synchronized and enhanced growth of each plume’s preferred spatial instability. Under these conditions, the dynamic pressure in the inter-nozzle region was found to be significantly higher than would be expected from two uncoupled su­personic jets. In some instances, the amplitude was found to exceed the design loads for the structure. This study also showed that the staging phe­nomenon observed for the convergent nozzle was not as prevalent as for the single C-D nozzle. Even when several modes existed simultaneously, only one mode was dominant, with a significantly higher amplitude. At lower Mach numbers, when the nozzle was operated in an overexpanded state, the axisymmetric screech mode was dominant. In the underexpanded state (higher Mach numbers), the helical mode was found to be dominant.

Broadband Shock-Associated Noise

A convergent nozzle operated at supercritical pressure ratios always pro­duces expansions and shocks in the plume. This results in the appearance of shock-associated noise. The same situation occurs when a convergent – divergent (C-D) nozzle is operated at off-design conditions. Shock-associated noise generally consists of discrete tones and broadband components. Though it is possible to design a shock-free C-D nozzle for laboratory investigation, C-D nozzles in commercial and military applications are usually constructed with straight conical sections, so some level of shock noise is present even at

Broadband Shock-Associated Noise

Strouhal number

Figure 8. Normalized spectra from heated jets at 90°. Tt/Ta = 3.2, D = 1.5 in. Symbols: subsonic Mach numbers; lines: supersonic Mach numbers. Velocity exponent n = 5.53. (From Viswanathan (2006))

the supposed design conditions. Harper-Bourne and Fisher (1974) were the first to provide a comprehensive experimental study and model of broad­band shock-associated noise. They operated a convergent nozzle at super­critical pressure ratios and at ambient reservoir temperatures, and observed a dramatic increase in noise in the forward quadrant. They identified this noise source as being associated with the quasi-periodic shock cell struc­ture in the jet plume. From an examination of their cold data, together with hot jet data from Rolls-Royce, they showed that the intensity of shock noise is only a function of nozzle pressure ratio and is nearly independent of jet reservoir temperature and hence jet velocity. Subsequently, Tanna (1977), Seiner and Norum (1979), Seiner and Norum (1980), Norum and Seiner (1982a), Norum and Seiner (1982b), Tam and Tanna (1982), Seiner (1984), Seiner and Yu (1984), Yamamoto et al. (1984) and, more re­cently, Viswanathan et al. (2009) have carried out extensive studies that have formed the basis for our understanding of shock-associated noise.

Broadband Shock-Associated Noise

Figure 9. Extracted components of turbulent mixing noise and broadband shock-associated noise from total measured noise. M = 1.24, Tt/Ta = 3.2, inlet angle = 70°. Solid: shock noise; dashed: mixing noise; symbols and dotted line: total noise. (From Viswanathan (2006))

The experiments conducted at NASA Langley Research Center by Seiner, Norum and Yu included measurements of the aerodynamic characteristics, as well as the near and far field acoustics of shock containing plumes in order to uncover the physical mechanisms responsible for the generation of shock noise. Both convergent and C-D nozzles were tested. Whereas a convergent nozzle can only be operated supersonically at underexpanded conditions (pe/pa > 1), where pe and pa are the exit and ambient pressures respec­tively, a C-D nozzle can be operated at either overexpanded (pe/pa < 1) or underexpanded conditions.

Figure 10 from Norum and Seiner (1982a) shows typical narrowband noise spectra from a C-D nozzle with design Mach number of 1.5 at a fully expanded Mach number of 1.8 (NPR=4.72), and unheated. Several spectra are shown that cover polar angles from 30° to 120°. Also shown are pre­dictions by Tam (1987): see Section 4.3. This figure displays all the three noise components. A screech tone is clearly visible in all the spectra, with its amplitude more than 10 dB above the broadband noise in the forward angles. The distinct peak to the right of the screech tone is the broadband shock-associated noise. The broadband noise contains one dominant peak, with a secondary peak sometimes evident, and the peak frequency of the radiation increases with angle from the inlet. The half-width of the broad­band spectral peak widens as the radiation angle increases and in the aft quadrant the peak is very broad. The broadband shock noise component is dominant in the forward quadrant. The peak to the left of the screech tone is the turbulent mixing noise, which is most easily identified at 120°. The peak frequency of the broadband shock noise increases with angle. The spectral level of the shock noise is nearly unaffected by jet temperature at a fixed Mach number. Though recent experiments by Viswanathan et al. (2009) and Kuo et al. (2011) show that the addition of small amounts of heating increases the peak levels, but then the levels become effectively independent of jet temperature.

The intensity of shock noise depends on the degree of mismatch between the design Mach number, Md and the fully expanded Mach number, Mj. Figure 11, from Seiner and Yu (1981), shows the variation of noise inten­sity obtained with a C-D nozzle of design Mach number 1.5 operated over a range of fully expanded Mach numbers. The jet was operated unheated and the radiation angle shown is 30°. Also shown on this plot (denoted by dark circles and solid line) is the turbulent mixing noise obtained by operating the three nozzles at their design Mach numbers of 1.0, 1.5 and 2.0. The dif­ference between the open circles (and dashed line) and the dark circles (and solid line) is an estimate of the shock noise contribution. When the Mach number of a C-D nozzle is progressively increased from subsonic to slightly supersonic conditions, the flow is highly overexpanded with strong shocks in the plume. Depending on the degree of overexpansion, a Mach disc may be present in the plume. The total noise of the jet in the forward quadrant increases with contributions from shock noise. As the Mach number is in­creased from unity, the noise level increases until the Mach disc disappears. This Mach number is denoted by point C. At higher Mach numbers, there is a decrease in noise due to the weakening of the shock strength and the minimum noise occurs at the design point A. With a further increase in Mach number, the nozzle is operated at underexpanded conditions and the shock noise again begins to increase following the trend AB. When the flow is highly underexpanded, normal shocks appear again and a Mach disc is formed, point B. The spectral level reaches a peak at approximately this condition and any further increase in Mach number results in a slight de­crease initially and then no further change in the noise level. The diameter

Broadband Shock-Associated Noise
Подпись: <Н1» 1>'":Ч 'll or “! I.IS

Figure 10. Narrow band noise spectra for a convergent-divergent nozzle operated at Mach numbers of 1.67. Design Mach number = 1.5. D = 5.08 cm. (Adapted from Norum and Seiner (1982a) and Tam (1987)).

Broadband Shock-Associated Noise

Figure 11. Variation of noise intensity with Mach number at 30° to the inlet axis. Design Mach number = 1.5. O, Imperfectly expanded jet; •, perfectly expanded jet. (Adapted from Seiner and Yu (1981)).

and the downstream location of the Mach disc increases with the degree of underexpansion. Seiner and Norum (1980) recommended that a distinc­tion should be made between plumes with strong shocks and plumes with weak expansion and compression waves. In the latter case the flow is super­sonic while in the former case there are mixed supersonic and subsonic flow regimes, due to the presence of the normal shocks. These strong shocks reduce the extent of the supersonic flow and weaken the strength of the downstream shocks.

These experiments also showed that though the first shock cell has the greatest strength, the downstream shocks are responsible for shock noise production. The main region of shock noise production was found to occur near the end of the potential core for both underexpanded and overexpanded supersonic jets. Flow and near-field acoustic correlations indicated a spatial coherence of several shock wavelengths, with the shock noise appearing to originate from the vicinity of each oblique shock wave. These results sug­gested strongly that broadband shock noise is produced by the interaction of turbulent flow structures with the periodic shock cell system.

The relative importance of broadband shock-associated noise and turbu­lent mixing noise is a strong function of radiation angle and jet operating conditions. For a fixed Mach number, the turbulent mixing noise level increases as the jet temperature is increased, while the amplitude of the broadband shock noise remains nearly unaltered. Hence, the magnitude of the shock noise over the mixing noise is a maximum for cold jets, as seen in Figure 10. The shock noise radiation is fairly omnidirectional, whereas the mixing noise radiates principally in the aft directions. The jet temperature then sets the relative levels of the two components. Figure 12 shows the effect of total temperature ratio on the OASPL from a convergent nozzle operated at a fully-expanded Mach number of 1.36 (underexpanded). The shock noise is see to be relatively omindirectional for each temperature ra­tio. The increase at some angles near 90 degrees in the unheated case is due to the presence of screech tones. The mixing noise is highly directional and dominates the shock noise in level for large angles to the inlet axis. In the unheated case, the peak levels of the shock and mixing noise are similar (within 5 dB when the screech tones are neglected). At the highest temper­ature ratio the peak mixing noise OASPL is approximately 15 dB higher than the shock noise.