Category Noise Sources in Turbulent Shear Flows

Turbulent Mixing Noise

The noise from a high-speed jet is intimately related to the turbulence characteristics of the jet. Both fine-scale turbulence and large-scale tur­bulence generate noise. It is important to note here that the terms fine – scale and large-scale turbulence noise are very imprecise and confusing. As discussed in Section 3.3, the terms are used in these notes to distinguish between different noise generation mechanisms. The fine-scale turbulence mechanism is taken to be associated with relatively compact sources and involves the propagation of the sound, once generated, through the moving, sheared mean flow. Thus mean flow/acoustic interaction effects such as re­fraction, described in Section 3.1, are important for this noise source. The large-scale noise mechanism is associated with a direct connection between the turbulent structures in the jet shear layer and the acoustic field. An example is given by the instability wave model discussed in Section 3.2. Both mechanisms are broadband in nature, though the large-scale noise ra­diation is expected to dominate at low frequencies and small angles to the jet downstream axis. The relative contributions of these two noise mecha­nisms depend on the jet Mach number, jet temperature, and the radiation angle. For subsonic jets, especially at low and moderate temperatures, the large turbulence structures propagate downstream at subsonic speeds rela­tive to the ambient speed of sound. For these jets, the fine-scale turbulence is probably the dominant noise source at most angles. However, at angles close to the jet axis, including the peak noise radiation angles, the contri­bution from large-scale structures could be significant. For supersonic jets, and subsonic jets at high temperatures, as in practical jet engine applica­tions, the large-scale structures convect downstream at supersonic speeds relative to the ambient speed of sound. As such, they are efficient gener­ators of noise and constitute the dominant noise sources, especially in the downstream direction.

Jet noise depends on the jet operating conditions: Nozzle Pressure Ratio (NPR) pt/Pa and Total Temperature Ratio (TTR) Tt/Ta, the nozzle exit area (related to the fully expanded jet diameter Dj), the distance of the observer from the nozzle exit, ambient conditions, and the polar direction of radiation ф. 1 Usually, the origin of the reference coordinate system is located at the center of the nozzle exit, with the noise emission angle measured from the inlet axis. Unless otherwise stated, this convention is followed throughout this set of class notes. However, theoretical analysis usually uses the angle 9, which is the polar angle measured from the jet downstream axis. Jet noise was typically measured in 1/3-octave bands until the late nineteen eighties. The bandwidth that corresponds to a par­ticular 1/3-octave band center frequency, increases as frequency increases. In the last few decades, high quality narrow band spectra have been mea­sured. These narrow band data shed more light on the noise characteristics and have been used by researchers in the development of noise prediction

1For noncircular jets the noise is also a function of the azimuthal location, though this effect is generally small unless the aspect ratio of the nozzle is very large.

Turbulent Mixing Noise

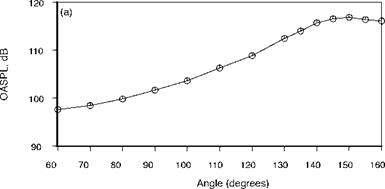
Figure 1. Overall Sound Pressure Level of typical mixing noise from a round nozzle corrected to a polar distance of 100 diameters. D = 8.79 cm, Mj = 0.86, Tt = 811K.

methods. However, the metric for the calculation of aircraft or engine noise is the effective perceived noise level (EPNL), which is based on octave or 1/3-octave spectra. In computing the EPNL, the measured spectrum at each observer angle is converted to a single number based on a set of formu­lae or a table, with the octave band center frequencies weighted differently. The heaviest weighting is given to frequency bands to which the average human listener is most sensitive. For aircraft certification, the computed perceived noise level at each angle (or time) is integrated to account for the duration effect, and an effective perceived noise level is calculated. The ap­proved procedure for noise certification has been established by the Federal Aviation Authority, see code of federal regulations, part 36. The procedure for aircraft noise certification is described by Peart et al. (1995). It is clear from the above description that these regulations have profound implica­tions for noise reduction strategies. Though it would be desirable to reduce the noise level at all frequencies, any noise reduction concept should target those frequencies that reduce the perceived noise level.

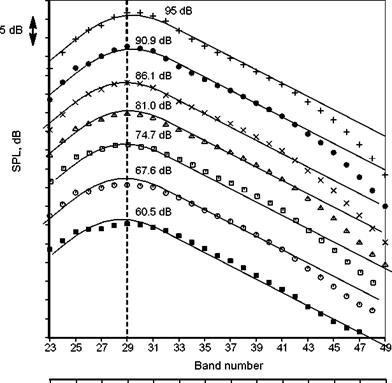
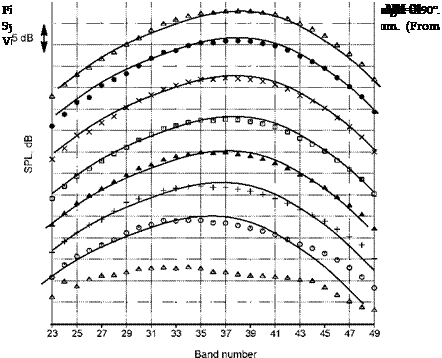
Figure 1 shows the typical noise characteristics of a hot subsonic jet with Mj = 0.86 and Tt = 811 K at a polar distance of 100 diameters. The Overall Sound Pressure Level (OASPL) increases gradually with observer angle from the inlet and reaches a peak at approximately 150 degrees. The spectra at 90 degrees to the jet are shown in Figure 2 from Viswanathan (2004). This figure also shows the effect of increasing Mach number. It should be noticed
Turbulent Mixing Noise
that all the spectra have the same broad, flat shape, which is characterized by the fine-scale similarity (FSS) spectrum of Tam et al. (1996). This is discussed in more detail in Section 3.3 below. At the lowest Mach number the jet noise spectra are contaminated by facility noise and do not conform to the FSS spectral shape. The spectral shape at larger inlet angles is much more peaked with a faster roll-off at both high and low frequencies. This is shown in Figure 3 from Viswanathan (2004) for several subsonic Mach numbers and an unheated jet at 160 degrees. Also shown in the figure are curves representing the Large Scale Similarity (LSS) spectrum from Tam et al. (1996): see Section 3.3. The agreement is very good. Also notice that the peak frequency is independent of jet Mach number.

The acoustic analogy by Lighthill (1954) provides a scaling formula for

Turbulent Mixing Noise

0.2 0.5 1.25 3.15 5 12.5 20 50 80

Frequency, KHz

Figure 3. Comparison of spectra from unheated jets. D = 2.45 in., inlet angle = 160°. Symbols: ■, M = 0.4; O, 0.5; □, 0.6; △, 0.7; x, 0.8; •, 0.9; +, 1.0. Lines: LSS spectrum. (From Viswanathan (2004), with permission)

Turbulent Mixing Noise

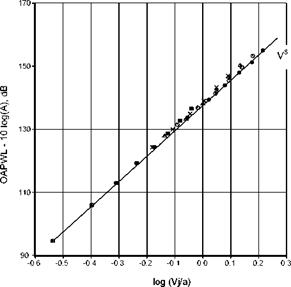
Figure 4. Comparison of spectra from unheated jets. D=2.45 in. Symbols: V8.m. ■. Tt/Ta = 1.0; x. 1.8; △ . 2.2; O, 2.7; • . 3.2. (From Viswanathan

(2004), with permission)

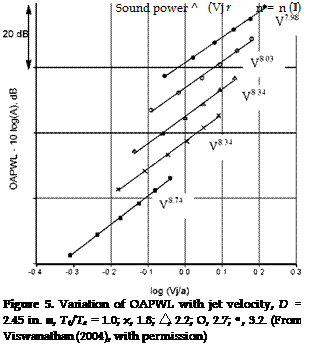
the power radiated by a low Mach number. unheated jet that varies as the eighth power of velocity (see Section 3.1). The variation of the Overall Power Level (OAPWL)for a range of jet Mach numbers from 0.5 to 1.0 and total temperature ratios of 1.0 (unheated) to 3.2 is shown in Figure 4 from Viswanathan (2004). Also shown is a line representing the V8 varia­tion. The agreement is good. However. as shown by Viswanathan (2004) a closer look at the effect of temperature shows that each total temperature ratio follows its own power curve with a slightly different exponent for each temperature. This is shown in Figure 5 from Viswanathan (2004). Notice that the unheated jet has an exponent that is very close to the eighth power scaling.

Viswanathan (2004) also showed that the effect of heating on jet noise at a fixed jet velocity was different for lower velocity jets than at higher velocities. At lower velocities. heating at a fixed velocity increased the noise and at higher velocities. heating decreased the levels. The transition occurs
Turbulent Mixing Noise Подпись: (1)

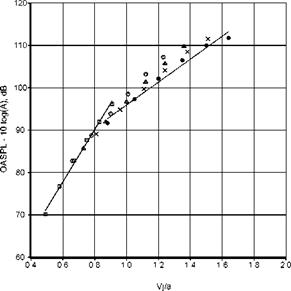
at an acoustic Mach number Vj/a of approximately 0.8. The variation of OASPL at different angles was also shown to depend differently above and below this acoustic velocity. For example, Figure 6 shows the variation of OASPL at an inlet angle of 160° for different acoustic Mach numbers and temperature ratios. The value of the velocity exponent decreases from 9.67 for the unheated case to 7.67 for the highest temperature case. Note that the data fall in clusters with the highest temperature giving the lowest level at the higher acoustic velocities. On the basis of the database generated in the Boeing Low Speed Aeroacoustic Facility (LSAF) Viswanathan (2006) developed scaling laws to identify the different components of jet noise. He argued that the jet total temperature was an important parameter and that,

Turbulent Mixing Noise

Figure 6. Variation of OASPL with jet velocity, D = 2.45 in. Inlet angle = 160°. □, Tt/Ta = 1:0; O, 1.8; △, 2.2; x, 2.7; •, 3.2. (From Viswanathan (2004), with permission)

In addition, the OASPL can be scaled by,

(

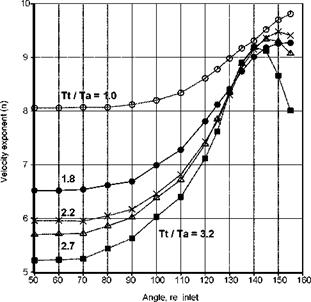
The variation of the velocity exponent with inlet angle and temperature ratio is shown in Figure 7 from Viswanathan (2006). The exponent is rel­atively uniform for lower inlet angles and then rises rapidly in the peak noise radiation direction. At 90° the exponent falls monotonically with in­crease in temperature ratio, being approximately 5.6 for the highest temper­ature. An example of the collapse of the spectra at 90° is shown in Figure 8 from Viswanathan (2006)). All the spectra for the subsonic cases collapse very well. The lines show the spectra for supersonic cases where broadband shock-associated noise becomes evident (See Section 2.2). If it assumed that the mixing noise spectra would also continue to collapse if the supersonic cases were ideally expanded, then the scaling laws and spectral shapes not only provide a method for noise prediction (see Viswanathan (2007)), they

Turbulent Mixing Noise

Figure 7. Velocity exponent for various angles and jet stagnation temper­ature ratios. (From Viswanathan (2006))

also provide a means for the separation of mixing and broadband shock – associated noise. An example is shown in Figure 9 from Viswanathan (2006). The mixing noise dominates at lower frequencies and is of the same order of magnitude as the shock noise at high frequencies. In the mid-frequencies, the spectrum is dominated by broadband shock-associated noise. Shock noise is described in the next section.

Jet Noise

Philip J. Morris* and K. Viswanathanf Department of Aerospace Engineering, The Pennsylvania State University, University Park, PA 16802, USA ^ The Boeing Company, Seattle, WA 98124, USA

Abstract This chapter provides an overview of the present un­derstanding of jet noise from both an experimental and analyti­cal viewpoint. First, a general review of experimental observations is provided. Only single axisymmetric jets are considered. Then a historical review of theoretical contributions to jet noise under­standing and prediction is provided. The emphasis is on both the assumptions and shortcomings of the approaches, in addition to their successes. The present understanding of jet noise generation mechanisms and noise predictions is then presented. It is shown that there remain two competing explanations of many observed phenomena. The ability of the different approaches to predict jet noise is assessed. Both subsonic and supersonic jets are considered. Finally, recent prediction methods and experimental observations are described.

1 Introduction

The advent of the jet engine as the preferred propulsion system, first for mili­tary aircraft and then for commercial aircraft, highlighted the problem of jet noise. The extremely high noise levels of the small military jets of the Sec­ond World War needed to be reduced significantly before larger jet-powered aircraft could be introduced into civilian service. In the early 1950’s letters began appearing in the Times of London complaining about “the screaming of jet fighters” at seaside towns in England on the weekends and a Presi­dential Commission identified noise as the “principal nuisance factor,” for people who live near airports (see Bolt (1953)). Initially, research was ex­perimental. In England, jet noise studies were being conducted at Cranfield by Westley and Lilley (1952) and in Southampton by Powell (1953a). In the United States, von Gierke (1953) at Wright-Patterson Air Force Base and Hubbard and Lassiter (1953) at Langley Field were also conducting jet and propeller noise measurements. Powell (1954) provided a survey of jet

R. Camussi (Ed.), Noise Sources in Turbulent Shear Flows: Fundamentals and Applications, CISM International Centre for Mechanical Sciences, DOI 10.1007/978-3-7091-1458-2_3,

© CISM, Udine 2013

noise experiments conducted to that time. The seminal theoretical contri­butions were made by Lighthill (1952), Lighthill (1954). In addition, the introduction of his Acoustic Analogy provided a framework for the correla­tion of experimental data. For example, the theory resulted in scaling laws such as the “eighth power law” for the radiated power as well as the high and low frequency dependencies of the spectrum. A review of this theory and its subsequent extensions is given in Section 3.1.

These notes are not intended to be a comprehensive review of jet noise research over the last fifty years. There have been several excellent reviews during this period. These include (among others); Lighthill (1963), Ribner (1964), Goldstein (1976), Ffowcs Williams (1977), Lilley (1995), Goldstein (1995) and Tam (1995a). A good reference for an overview of aircraft noise is given by Smith (1989). Here we have emphasized key theoretical and experimental studies and the latest developments. These notes represent our opinions, not always unanimous, and we apologize in advance for any omissions.

2 Experimentally Observed Characteristics of Jet Noise

There are three principal jet noise components. These are the turbulent mixing noise, broadband shock-associated noise, and screech tones. The latter two components are present only for supersonic jets and only when the nozzle is operated at off-design conditions. The relative importance of the three components is strongly dependent on the noise radiation direc­tion. Turbulent mixing noise is dominant in the aft direction, while the shock noise is dominant in the forward direction for round nozzles. Most commercial jet engines have fixed nozzle geometry, with the jet Mach num­ber being subsonic during takeoff. During climb and at cruise, the ambient pressure is much lower than at sea level and the nozzle is often operated at supersonic conditions, generating shock noise. Several experimental studies since the seventies have investigated the characteristics of the three noise components. First the salient experimental results are presented.

Dimensional Analysis

A rapid analysis is proposed in this section to assess both parts of the loading-noise term for a compact segment of lifting surface, keeping in mind that similar principles could be applied to other source terms. The kine­matics of interest is that of a blade segment rotating at constant speed U at some radius R0, so that the characteristic velocity scale is U0 = U R0. The corresponding centripetal acceleration is Гі = Uq/R0. The chord length is c and the spanwise extent is assumed of the same order of magnitude. Steady­loading noise involves the steady-state aerodynamic force which scales ac­cording to F0 ^ CL c2 p0 Uq /2 (see chapter 5 for justifications). In contrast the fluctuations around the mean value F0 arise from time variations of the relative flow velocity on the segment; the velocity disturbances of amplitude w are in most cases proportional to the mean-flow speed, leading to some disturbance rate w/U0 which is assumed constant in the present analysis. According to simple unsteady aerodynamic arguments, typically Sears’ the­ory outlined in chapter 5, the fluctuating force amplitude is evaluated as F ^ n p0 c2 wU0 and its time derivative as

Подпись: dF dt7

Dimensional Analysis
Подпись: Fi = - J Pi dSv ,

Ж npo c2 wUg2/Rg,

Подпись: IS Ж Подпись: Po c4 U08 R2 c0 R2 (1 - Mg)6 ’ Подпись: 2 po (w/Ug)2 c4 UQ RO cO R2 (1 - Mg)4 ’

where n stands for a multiple of the rotational frequency (R0/U0 is taken as the relevant time scale). Furthermore dMr/dt’ <x U2/(c0 R0). Finally, in­troducing the acoustic far-field intensities IS and Iu associated with steady­loading noise and unsteady-loading noise respectively leads to the dimen­sional evaluations

MO = Ug/cg being the characteristic Mach number and R the distance to the observer. This is made irrespective of possibly different constant scaling factors. Unsteady-loading noise intensity is found to scale with the sixth
power of a characteristic flow speed and to include the fourth power of the Doppler factor in the denominator. This is typical of dipoles in translating motion and is generally retained as the scaling law of dipole sources in aeroacoustics. In contrast steady-loading noise scales like the eighth power of flow speeds with the sixth power of the Doppler factor in the denominator, similarly to what is obtained for translating quadrupoles (see section 3.4). Comparing both contributions is achieved by forming the ratio

Is _! f 4s Y f Mo Y

Iu ^ n2 w ) Y – Mo)

to be considered with the rate of unsteadiness w/40 as parameter. It ap­pears that the flow Mach number strongly determines which contribution dominates. At low to moderately subsonic Mach numbers and for a signifi­cantly disturbed oncoming flow, steady-loading noise can be neglected. The fluctuating forces on the moving bodies are the most efficient sound sources. This holds especially at higher frequencies. Conversely, at high Mach num­bers, and more precisely at lower frequencies, steady-loading noise is the dominant mechanism, even with effective unsteadiness in the flow. But unsteady-loading noise must be considered anyway.

For constant rotating motion thus constant centripetal acceleration, the dipole part of thickness noise in eq. (27) would be found to behave like steady-loading noise. Without going further into the details, the same sim­ple developments also suggest that quadrupole sources associated with flows around a body become efficient at transonic speeds.

Finally the dimensional analysis justifies that preferred attention is paid to unsteady loading noise in most applications. This is not only true for the broadband noise of bodies in translating motion but also for subsonic ro­tating blade segments. As a consequence all predictions methods developed in chapter 5 will hold for low-speed fans as well, even though the rotating motion will not be explicitly taken into account. Now once recognized as the primary source of sound, the unsteady loads on moving surfaces must be known as a first step to enable any prediction of the radiated sound field based on the acoustic analogy. This makes aeroacoustic predictions gener­ally more challenging than classical aerodynamic predictions for engineer­ing applications. Simulating steady-state aerodynamics is clearly affordable with modern computational tools; but it is more specifically related to the performances and mechanical efficiency of a system (fan, propeller, turbo­fan engine…). Acoustic predictions require the description of all kinds of unsteadiness in the flow, which is a much more demanding task in terms of resources. Moreover flow unsteadiness is often not intrinsic to the system

but rather depending on the environment or the installation of the system.

6 Concluding Remarks

The acoustic analogy has been presented in this chapter as a theoretical background for the analysis of aerodynamically generated sound. Once the equations of gas dynamics are reformulated as a linear wave equation, all flow features responsible for sound production are grouped in equivalent source terms. This mathematical statement makes the radiated sound field easily expressed from the sources, provided that the latter are previously determined accepting some simplifications. In that sense the analogy is an indirect approach. The flow must be first described assuming that it de­velops independently of its acoustic signature, and the sound calculation appears as a post-processing step. The equivalent sources are moving with respect to the observer and/or the surrounding medium. Therefore atten­tion has been paid to emphasize all effects of motion in the formal solution, classically expressed by the Green’s function technique. The most crucial point for practical sound predictions is the description of the sources. Ap­plications to lifting surfaces are presented in chapter 5.

Compact Sources in Motion

Подпись: Tv > Подпись: L co [1 - Mr ] ’ Подпись: L [1 - Mr] Подпись: (28)

For both numerical implementation issues and deeper insight into the general solution, the possibility of reducing the extended source region to a single point source or to a discretized set of sources involves the property of source compactness. A source region is said acoustically compact when retarded time variations over it are negligible in comparison with a charac­teristic period Tn. This condition is simple for stationary sources but more subtle for moving sources. It reads

where L is the extent of the source region and 1 — Mr an average value of the Doppler factor.

A simple example is detailed below to illustrate this key notion. Consider an emitting segment of length L moving at some subsonic speed V0 = M0 c0, as depicted in Fig. 15. At time t the segment is between two points (A, B) but the sound received at observer comes from retarded locations between the points (A’, B’) that are the retarded locations of (A, B) and that define the ’acoustic image’ of the segment. Because the propagation distances from

Подпись: p'(x,t) Compact Sources in Motion Подпись: dn.

all retarded locations are different, the length of the acoustic image differs from L. It is longer if the segment is approaching the observer and shorter if it is leaving. Motion artificially induces spatial stretching of any source distribution. Because compactness must be evaluated on the acoustic image, a given source region is more compact when leaving the observer and less compact when approaching. Assuming dipoles on the segment, the general expression of the acoustic pressure is provided for instance by the second term of Ffowcs Williams & Hawkings’ solution specified as the line integral

Подпись: p'(x,t) Compact Sources in Motion Compact Sources in Motion Compact Sources in Motion Подпись: dn,

For simplicity consider a uniform distribution of identical dipoles with axis aligned along the segment direction ei. The strength of the dipoles is P = P (t) e1 = Ae гші e1. At the origin of time the center of the segment will be at observer’s location, so that the times of interest are negative. The observer is assumed in the acoustical and geometrical far field, in front of the segment and on its trajectory. In these conditions the general formula reduces to

where the retarded time is a function of (x, n, t). At any time t’ the center of the segment is distant from the observer of —M0 c01’ and the element of the segment of coordinate n is at distance — (n + M0 c0t’) . Therefore te(n) = (t + n/co)/(1 — Mo). Furthermore in the far field 1/Re(t) — 1/R0(t) where R0(t) is the retarded distance of the center of the segment. It is worth noting that the parameters involved in the far-field assumptions must be evaluated at the retarded time and position. Therefore the condition of geometrical far field reads Re(t) ^ L/(1 — M0) and involves the length of the acoustic image of the segment. The acoustic pressure is finally written as

Подпись: —ikAe-iut/(1-Mo') p(x,t) - 4* (1 — Mo)2 Ro(t) Подпись: L/2 e-ikv/( 1-Mc) dn -L/2

_ —ikAe-iut/(1-M°) L sin [kL/(2 (1 — M0))]

= 4n (1 — M0) R0(t) 1 — M0 kL/(2(1 — M0)) ‘

The result for a stationary segment with the same source distribution would be obtained by putting M0 = 0. The expression involves the sine – cardinal function which approaches 1 at very low frequencies such that kL/(1 — M0) ^ 1. Under this condition the acoustic pressure is pro­portional to the length of the segment, because the distributed sources are identical and perfectly in phase in the example, and the whole segment is said compact. When the argument is a multiple of n, the function is ex­actly zero and no sound can be heard in the conditions of the example: all sources interfere in such a way to produce a complete cancellation. The crucial point associated with source motion is that the Mach number now enters the definition of the argument. Typically at kL = n assuming source compactness for the stationary segment remains acceptable, whereas for the approaching segment at Mach number 0.5 the same frequency corresponds to a total extinction of the sound.

It is worth noting that the length of the acoustic image of the segment extends to infinity if the segment approaches the observer at exactly the speed of sound. In such conditions the solving procedure has been recog­nized as no longer valid. More generally the sonic singularity also means that any discretization cell of the source domain will not fulfill the compact­ness condition, leading to possible issues for numerical implementation.

Going back to the general result the assumed dominant loading-noise term for a compact surface in Ffowcs Williams & Hawkings’ solution sim­plifies to

Compact Sources in Motion±_ [ Ri д f Pi

4 n JS |_c0 R2(1 — Mr) dt’ V1 — Mr)

where the total aerodynamic force induced by the fluid on the surface F is introduced and where the over-bar, omitted in the following, stands for an average value over the surface. This simplified expression is the basis of the dimensional analysis proposed in the next section.

Far-Field Noise Radiation

c0 R3 (1 – Mr) dt’ V1 – Mr dt’ V1 – Mr

c0 R3(1 – Mr) dt’ І1 – Mr dt’ 1 – Mr

Подпись: 1 P (x,t) = 4“ 4 n
Подпись: Ve
Подпись: + 44 n 1 + — 4 n
Подпись: 'Vi
Подпись: RiRj
Подпись: д
Подпись: 1
Подпись: d ( Tij
Подпись: Ri
Подпись: d
Подпись: Pi
Подпись: Vi Far-Field Noise Radiation Far-Field Noise Radiation

In usual applications the observation point x is in the acoustic far – field, for which the general solution must be specified. This is achieved by applying commutation rules between the space derivatives and the retarded­time operator and only retaining the terms with the spherical attenuation (see Goldstein (1976) and Ffowcs Williams & Hawkings (1969)). Because the acoustic pressure is defined as p’ = c0 p’ eq. (26) is changed in

This formula shows that unsteadiness is a necessary condition for noise to be heard in the far-field. Because dipoles are fundamentally more ef­ficient sources than quadrupoles, on the one hand, and because thickness noise is expected of secondary importance for thin surfaces on the other hand, loading noise is very often dominant and never negligible. This is why the emphasis is put on the loading-noise term to highlight the role of unsteadiness. Writing

д_ ( Pi = 1 P _ Pi д (1 – Mr)

dt’ V1 – Mr) 1 – Mr dt’ (1 – Mr)2 dt’

indicates that far-field noise has two origins, namely the intrinsic unsteadi­ness of the source terms, considered in the moving frame of reference at­tached to the surface, and the unsteadiness due to source motion expressed by the Doppler factor. Furthermore,

d(1 – Mr) = Mi (V(o) _ RjRj V(o) ____ Ri г

dt’ = R i R2 j ) Rco i ’

thus in turn the Doppler unsteadiness splits into two contributions. The second one results from the acceleration of the source; the first one also exists for non-accelerated motion but must be neglected as a near-field term in the far-field approximation. An important conclusion is that a steady force does produce sound if accelerated. This is a well-known contribution to the tonal noise radiated by high-speed rotating blades. In contrast a body in uniform translating motion produces sound in the far field only by virtue of unsteady aerodynamics, and variations of the denominator can be ignored to evaluate that noise.

Подпись: p'(x,t) Far-Field Noise Radiation Far-Field Noise Radiation

When applied to the first term of Ffowcs Williams & Hawkings’ equation the same analysis yields the simplified statement

useful for a preliminary understanding of the mixing noise from jets: far-field sound of translating quadrupoles arises from the second time derivatives of Lighthill’s stress tensor. In fact the result is just an extended version of the point-quadrupole formula derived in section 3.4.

Solution of Ffowcs Williams & Hawkings’ Equation

4.1 Formal Solution

Solution of Ffowcs Williams &amp;amp; Hawkings’ Equation Solution of Ffowcs Williams &amp;amp; Hawkings’ Equation Подпись: (24)

Since the solid surfaces responsible for sound generation are replaced by equivalent sources, the wave equation of the analogy as stated by Ffowcs Williams & Hawkings is solved in an unbounded medium at rest by making use of the free-space Green’s function. The formal solution is described below for the standard application with integration on the solid surfaces. After making use of the general properties of convolution products and performing the change of variable y ^ n where n is the source coordinate vector in the reference frame attached to the surfaces, the acoustic pressure fluctuation at point x and time t is expressed as

with Rn = |x — y(n, t’)|. Note that the surfaces are assumed rigid.

Note that here the summation required for the two possible roots of the retarded-time equation in supersonic motion is not written for simplicity. In eq. (25) P is the net force on the fluid from each surface element, Vn is the normal velocity field on the surfaces for a normal unit vector pointing inwards, M is the Mach number of the sources, corresponding to the velocity in the stationary frame of reference, 1 — Mr with Mr = M • R/R is the Doppler factor related to the projected motion on the line from the source to the observer, and the squared brackets mean that the embedded quantity is to be evaluated at the retarded time. Equation (25) clearly separates the contributions of source motion with respect to the stationary axes, and source physics described in the moving axes, leading to generality the simple arguments introduced with translating point sources in sections 3.2 and 3.4.

Solution of Ffowcs Williams &amp;amp; Hawkings’ Equation Solution of Ffowcs Williams &amp;amp; Hawkings’ Equation

Though exact the result involves a surface distribution of monopoles whereas the total mass is constant for rigid surfaces. There is only fluid dis­placement induced by the passage of the surfaces. In fact the instantaneous balance of monopoles is exactly zero and sound is radiated only because of retarded-time differences between the monopoles. For this reason an alter­native and mathematically equivalent form of the result has been proposed by Ffowcs Williams & Hawkings (1969) and Goldstein (1976) as

introducing volume integrals of equivalent dipoles and quadrupoles over the inner volume Vi of the surfaces. Note that the volume and surface bound­aries do not depend on time anymore. Notations (V(0), Г) stand for the absolute velocity and acceleration fields defining the solid-body motion of the surfaces. All quantities are now defined in the sense of ordinary func­tions. Finally the noise radiated by flows and surfaces in arbitrary motion can be thought of as produced by dipoles and quadrupoles only. Moreover, when the inner volume of the surfaces tends to zero, as in the case of thin airfoils or blades of compressors, the noise from the third and fourth source terms in eq. (26) is expected negligibly small. This justifies the terminology of thickness noise. Both formulations are singular at the sonic radiation angle for which the denominator vanishes. The physical meaning of the sin­gularity has been discussed in section 3.2. As shown by Ffowcs Williams &

Hawkings (1969) and Farassat (1983), it is removable at the price of other so­phisticated solving procedures, not detailed here. The present expressions hold away from the singular condition, for either subsonic or supersonic regimes. For simplicity the subsonic regime is retained later on.

The Half-Plane Green’s Function

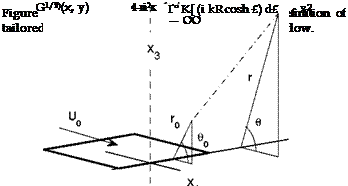
The emphasis is put here on the Green’s function of the space limited by a rigid half-plane with zero thickness, known as the half-plane Green’s function for the Helmholtz equation, because of its applications in aeroa – coustics, for instance in the analytical modeling of trailing-edge noise or high-lift device noise. Initially derived by Macdonald (1915) in spherical coordinates for a stationary medium, the expression is easily transposed in cylindrical coordinates for a source point x0 = (r0,d0,z0) and an observer at point x = (r, в, z), with the z axis along the edge and в being n along

The Half-Plane Green’s Function Подпись: (20)

the half-plane and zero in its continuation (Fig. 13). It reads

Подпись: —i к + 4 n2Mi

I K (i kR cosh £) d£,

— CO

Подпись: sinh £0 The Half-Plane Green’s Function Подпись: sinh £1 The Half-Plane Green’s Function

where K is the modified Bessel function of the first kind and where the upper bounds are given by

R is the distance from the source to the observer R = [r2 + r2 + (z — z0)2 — 2rr0 cos(e — в0)]1/2, and the similar expression for the distance from the image point to the observer R holds with cos(e + в0). Equation (20) is the basis for deriving the radiated field of arbitrary source distributions accounting for the diffraction by the edge. The acoustic field of a point
dipole of force P is finally given by the scalar product P • VGu/2 and that of a quadrupole of strength Q by the double scalar product Q : VVg!,1/2).

The Half-Plane Green’s Function

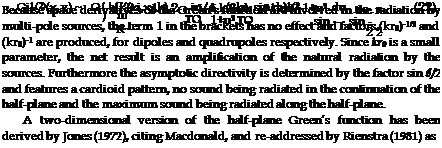
Most reported applications, such as the trailing-edge noise analysis pro­posed by Ffowcs Williams & Hall (1970), are based on the asymptotic form of the Green’s function for far-field observer and sources very close to the edge in terms of acoustic wavelengths. The asymptotic form reads

where the quantities r12 and ^1j2 are just deduced from the equivalent parameters in eq. (20) by putting z = z0 = 0.

A useful transformation can next be introduced to extend the preceding Green’s functions in a stationary medium to the case of a uniformly moving medium, provided that the fluid motion is along x1. The transposition formula reads

GM/2)(xbx3,k) = 1 Gi1/2)(Xbx3,K) e—iKM0 (Xi—Yi), (23)

where (X1,Y1) = (x1,y1)/e, K = k/в and where corrected angles ac­counting for flow convection are considered in original expressions. The transformation holds for two-dimensional and three-dimensional spaces, and
stretches the coordinate along the direction of the flow. In the two-dimensio­nal case of a trailing edge, thus positive Mach number, a correction account­ing for the Kutta condition has been proposed by Jones and re-addressed by Rienstra (1981). This condition has a noticeable effect at Mach numbers exceeding 0.5 and/or for sources located very close to the edge (see Roger & Moreau (2008)). It is ignored in the present discussion for conciseness.

Подпись:

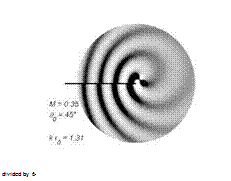
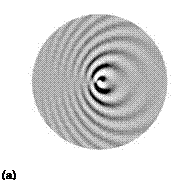
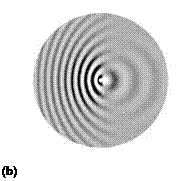
Подпись: Figure 14. Sample wave patterns produced by the same point quadrupole either at some distance (a) or very close to a trailing edge (b), featuring the asymptotic regime. Source angle 45°, flow from left to right.

(a)

(b)

Exact two-dimensional radiation patterns obtained for the same point lateral quadrupole located at two different distances from a trailing edge are plotted in Fig. 14. The Mach number is 0.35, the source angle is 90 = 45° and no Kutta condition is applied. For the first plot (Fig. 14-a) the re­duced distance to the edge is kr0 = 1.31 and the same spiral pattern as in free field is recognized. At same distance but at 90 = 135°, a shadow zone would be observed in the bottom part of the map because the half­
plane would act as a screen. For the second plot (Fig. 14-b) at the reduced distance kr0 = 0.131 the asymptotic regime is reached and the radiation has the typical cardioid directivity imposed by the Green’s function, with wavefronts in phase opposition on both sides. The same would be found for other source angles at the same distance. This regime is accompanied by a strong amplification since the gray-scale has been artificially damped by a factor 6 in order to make both plots comparable. An even stronger amplifi­cation would be found imposing a Kutta condition. The asymptotic regime is typical of trailing-edge noise from attached turbulent boundary-layers. Indeed Lighthill’s interpretation followed by Ffowcs Williams & Hall (1970) involves quadrupoles remaining very close to the surface and the trailing edge in terms of acoustic wavelengths for all frequencies of interest. In contrast quadrupoles located farther away from the edge are amplification – free. From this fundamental result it is expected that attached turbulent flows over a trailing edge are much more efficient sound generators than small-scale vortical patterns developing, for instance, in the separated shear layers on stalled airfoils. According to Roger & Moreau (2008) the asymp­totic regime is typically entered below kr0/fi ~ 0.4 for quadrupoles and below кг0/в ~ 0.2 for dipoles. As a result turbulence convected along a wall far from a singularity must be a poor source of sound. More pre­cisely, classical results about the relationship between trailing-edge noise and wall-pressure statistics (see chapter 5) make the cut-off frequency of the sound spectrum expected around u5/U0 ~ 3 for loaded airfoils, where 5 is the boundary-layer thickness within which the quadrupole sources are distributed. A rough estimate of the condition for amplification associated with the asymptotic cardioid regime up to that frequency therefore reads 3(М0/в) r0/5 < 0.4. It appears that the condition is more easily satisfied at low speeds.

The asymptotic half-plane Green’s function also explains the directivity of the vortex-shedding sound emitted as a von Karman vortex street is formed in the near wake of a thin airfoil or plate with blunted trailing-edge. The roll-up of vortices features quadrupole sources that are scattered by the edge and the sound produced is again cardioid-like, with phase opposition on both sides of the plate. Because the shedding frequency is 0.2U0/h where h is the trailing-edge thickness and because the shorter expected edge-vortex distance is around h, now кг0/в ~ 0.4 n M0/fi is likely to be lower than 0.4 at low Mach numbers for the closest vortices. Despite the fact that they result from fundamentally different mechanisms, both trailing-edge noise and vortex-shedding noise have the same characteristic radiation properties imposed by the Green’s function. Oppositely a laminar separation bubble at leading edge is sometimes observed on thin airfoils, triggering a turbulent
reattached flow. Since the bubble free shear layer is initially laminar, it is a possible source of noise only if its first oscillations take place at a leading-edge distance below the threshold kro/в < 0.4, and if the favorable condition is fulfilled by frequencies effectively covered by the instabilities.

Tailored Green’s Functions – The Rigid Half-Plane

Exact tailored Green’s functions which remain tractable for analytical modeling are very few in mathematical wave theory. Some of them can be generated from the free-space Green’s function by the method of im­ages, taking advantage of the fact that reflecting plates can be removed provided that the symmetric images of the primary sources are introduced (the principle has already been used in Fig. 4). The half-space bounded by an infinite, either soft or rigid wall, and the quarter-space defined by two perpendicular planes, can be treated this way. Similar is the case of the channel limited by two parallel planes, if the infinite set of sources corre­sponding to the successive reflections is considered. However the channel is better considered as a waveguide, and the Green’s function expressed as a combination of the so-called acoustic modes of propagation (see for in­stance Goldstein (1976) for sound propagation in ducts). Other tailored Green’s functions useful when formulating open-air radiation problems are also available for the space limited by a wedge of arbitrary angle, the half­plane being the special case of wedge with external angle 2 n (Macdonald (1915)). Quite obviously, deriving tailored Green’s functions for more com­plicated shapes can be as difficult as solving the full problem and is often accessible only through numerical implementations of the wave equation or of the Helmholtz equation. Therefore approximate Green’s functions are an interesting alternative when they can be defined, for instance by removing the observer at very large distances. A class of such approximations, not discussed here, is provided by Howe’s so-called compact Green’s functions (Howe (2003)), often addressing sources very close to compact solid bodies and observers in the acoustic far field. Since the tailored Green’s functions rely on source and/or observer distances scaled by the acoustic wavelength, they are more specifically associated with the Helmholtz equation and the frequency-domain approach.

The Convected Wave Equation

Подпись: і DV C0 Dt2 Подпись: S, Подпись: D Dt Подпись: d dt + Uo V Подпись: (12)

Most problems in aeroacoustics involve stationary sources radiating in a uniformly moving medium instead of moving sources radiating in a medium at rest. This configuration is referred to as convection problem. The distinction has to be made because sound is always analyzed with the point of view of the observer. Noise radiated by helicopter rotors in forward flight by means of microphones embedded on an aircraft flying with the same velocity, aeolian tones emitted by wires in the wind and sound radiation by mock-ups in wind-tunnels are typical examples of convection problems. Because the source and observer are stationary in a moving medium of velocity U0 = |Uo|, the acoustic field is a solution of the convected wave equation:

and by convention the first coordinate xi of unit vector ei is in the direc­tion of fluid motion, assumed lower than the propagation speed. The result can be deduced from the invariance of the general equations in a change of Galilean frame of reference, noting that the classical wave equation applies in a frame of reference moving with the propagating medium. The free – field Green’s function for eq. (12), say Gc, differs from G0. However, the

Подпись: Re ~R The Convected Wave Equation

development of wavefronts in the convection problem is similar to that of a source moving with the same velocity U0 in the opposite direction in a medium at rest. The source-to-observer relationship is depicted in Fig. 10 in terms of emission and reception coordinates, to be compared to Fig. 7. Due to wavefront convection, the exact (or geometrical) coordinates (R, 9) do not coincide with the coordinates of emission (Re,9e). The latter are apparent coordinates for the observer. A geometrically equivalent config­uration of moving source can be defined, in which the observer receives the same signal at time t as if the source was at the retarded location (Re(t),9e(t)), whereas the actual location is the current one (R(t),9(t)). If this configuration is considered at that precise time when both sketches can be geometrically superimposed, the same relationship holds between (Re(t),9e(t)) and (R(t),9(t)), on the one hand, and between (Re,9e) and (R, 9) on the other hand. Both the retarded coordinates in Fig. 7 and the apparent coordinates in Fig. 10 are emission coordinates; in the same way the current coordinates in Fig. 7 and the exact coordinates in Fig. 10 are reception coordinates. The passage formulas for the problem of convection are directly obtained from eqs. (10) and (11) as

Подпись: Gc(x,t/y,t) Подпись: 5(t' -1 + Re/c0) 4n Rs Подпись: (15)

The only difference with the case of the moving source is that eqs. (13) and (14) do not involve time as a parameter. Consequently, no Doppler effect occurs, so that the frequency at observer is exactly the same as the proper frequency of the source. This points two key features out. Doppler frequency shift occurs because of relative motion between source and ob­server. In contrast, convective amplification occurs in both problems, since it is a consequence of relative motion between source and propagating medium. This formal identity also provides a straightforward determina­tion of the free-space Green’s function for the convected wave equation by specifying an impulse source in the general retarded-potential formula. The expression follows as

with Rs = Re (1 — M0 cos 9e) = R^J 1 — M0 sin2 9, 9 being defined ac­

cording to the sketch of Fig. 10. Changing for Cartesian coordinates in the

The Convected Wave Equation
Figure 10. Stationary source radiating in a moving medium.

Подпись: Gu(x/y) The Convected Wave Equation

The formal identity also holds for the convected Helmholtz equation stating about harmonic signals. In this case the Green’s function reads

It has been first addressed by Garrick & Watkins (1954).

3.3 Specific Properties of Acoustic Sources

Convective amplification and Doppler frequency shift associated with source motion have been introduced for an elementary point source specified

Подпись: Ap' Подпись: 1 d2p' c ~w The Convected Wave Equation

in the wave equation. They are characteristics of all waves fields, for instance also encountered in electromagnetism and water waves. Additional features are found when addressing acoustic sources, and more especially the source terms of the wave equation deduced from the acoustic analogy, rewritten symbolically as

The Convected Wave Equation Подпись: po q(t) S(x — Uo t),

This equation involves monopole, dipole and quadrupole-like source densi­ties, so called because of the derivatives involved in their definition. The sources are moving in the applications but result from different fundamental mechanisms. Consider again the subsonic rectilinear motion as an illustra­tive example and the case of the monopole. Because the moving monopole is actually a moving source of mass as long as no combustion process asso­ciated with entropy variations is considered, the motion must be specified in the continuity equation, as

yielding the corresponding wave equation for the acoustic pressure

1 d2p’ d

Ap’ — c; – JL = – po – [q(t) <Kx – Uot)]

different from the canonical form considered in previous section. Introducing the acoustic potential ф restores the canonical form for ф leading to eq. (9), from which the formal solution is derived for the acoustic pressure as now
Подпись:d ________ q(tej )_________

0 dt 4 n Rej 11 — M0 cos 0ej |

Подпись: p'(x,t) Подпись: po q'(te) 4 n Re (1 — Mo cos ee)2 ’ Подпись: (17)

The derivative of the denominator generates an extra factor 1/Rej and corresponds to the near field of the moving monopole. As long as the acous­tic far field is only of interest and the source is in subsonic motion, the solution reduces to

where q’ stands for the time derivative of the mass injection. The Doppler

factor now appears twice in the denominator. In fact one factor arises from the shifted wavefront structure inherent to any source motion and the second one comes from the time derivative in the definition of the monopole. For this reason the monopole is better defined as different from the elementary source of mass, the former appearing as the time derivative of the latter.

The same procedure can be applied to sources of higher polar orders, by means of suited changes of variables. For a dipole of strength Fj in the ej direction, which is defined as two elementary sources of mass very close to each other and in phase opposition, the far-field pressure is found as

Подпись:P0 Fjj(te) [ej • (R/R)]

4 n c0 Re (1 — M0 cos 9e)2 ’

with no summation on j. Sound is again resulting from the time derivative of the source function. The convective amplification is the same but it has a different physical reason. One Doppler factor is due to the wavefront shift, and the other one is produced by virtue of a modified retarded-time difference between the two elementary sources of the dipole.

Подпись: p'(x,t) Подпись: P0 Qj (te) [e • (R/R)] [ej • (R/R)] 4 ncg Re (1 — M0 cos 9e)3 Подпись: (19)

For a quadrupole of axes ej and e* the same procedure leads to the far-field term

involving the second time derivative of the quadrupole strength Qj, again without index summations. Convective amplification is found stronger for the quadrupole. This is important at high speeds and is determinant in the physics of mixing noise from jets. It is also noticeable that convective am­plification induces additional directivity. Finally the nature of the moving acoustic sources cannot be ignored to analyze the far field.

Typical wave patterns of point dipoles are illustrated on the plots of Fig. 11, valid for both a moving source in a stationary medium and vice versa provided the reference frame is attached to the source. Convective amplification makes the radiation of a dipole parallel to the relative fluid motion stronger upstream (Fig. 11-b). Such a source will be called a drag dipole. The same holds for the case of a monopole, not shown here. In contrast radiation remains symmetrical for a lift dipole (Fig. 11-a). The total radiated power is enhanced for all types of sources, as shown below.

Power criteria for moving point sources Assessing the total acous­tic power radiated by moving sources is made questionable by the need for

Подпись: (a)
Подпись: (b)

Figure 11. Wavefront patterns of moving lift and drag dipoles, respectively normal (a) and parallel (b) to the relative flow direction, from left to right. Mach number M0 = 0.5.

extending the usual definitions of acoustic intensity and power. For station­ary sources the power is provided by integrating the instantaneous flux of the intensity vector over a control surface embedding the sources. If the surface is a sphere centered on the source, the intensity is of magnitude I = < p’2 > /(po co) along the radial direction. But for a moving source issues are related to the different retarded positions of the source for recep­tion of simultaneous signals at different points on the observation sphere. Equivalently the source and the control surface can be assumed stationary and the surrounding medium moving uniformly in the opposite direction. Now the only issues are related to the effect of fluid motion: the integration requires the extended definition of acoustic intensity in a uniformly moving fluid, which is a well-accepted notion (see for instance Goldstein (1976)).

As an alternative the far-field formulas derived for moving point sources and transposed to stationary sources in a moving medium by virtue of the equivalence discussed in section 3.3 can be used directly. Indeed they pro­vide the acoustic intensity I as a function of both the emission angle 9e and the effective propagation distance Re. Therefore integrating over all emis­sion angles for a constant value of Re provides an acoustic-power indicator. When the expressions for the acoustic intensity are scaled by the source strength, the reduced expressions follow for a monopole, a parallel dipole and a perpendicular dipole, respectively, as

Im(9e’) = R2 (1 – M0 cos 9e)4 ’

The Convected Wave Equation The Convected Wave Equation The Convected Wave Equation

where ф is the complementary angle between the projection of the distance vector in the plane ве = 0 and some direction normal to the relative flow direction. For the monopole and the parallel dipole the radiation is axisym – metrical and a simple integral over ве is performed with the sphere element 2 n R2 sin ве йве. The corresponding power criteria follow as

the factors 4 n and 4 n/3 standing for the classical values of stationary monopoles and dipoles. A double integral is needed in the case of the perpendicular dipole, leading to

Подпись: nd2(Mo)4n 1 з (1 – M2)2 •

Подпись: Tm(Mo) Подпись: 1 + MO / 3 (1 - M02)3 ’ Подпись: Tdi(Mo) Подпись: 1 + 3M02 (1 - M02 )3 ’

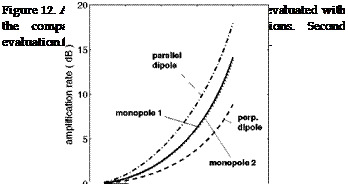
The result is substantially different for that dipole because it involves the squared amplification factor (1 – M0) instead of the power 3 for the other two. Finally amplification rates are obtained by just forming the ratios of acoustic powers for the moving and stationary sources, as

Td2(Mo) (1 – M02)2 •

These ratios characterize the effect of source motion assuming that the motion itself keeps the sources unchanged. They are plotted in Fig. 12 as functions of the source Mach number M0. Obviously the lift (perpendicular) dipole is found much less sensitive to motion in the sense that its amplifi­cation is much weaker. This is essentially because the direction of motion relative to the fluid, for which the Doppler factor induces the strongest am­plification, coincides with the extinction of the dipole radiation, whereas in the direction of maximum radiation the Doppler factor is just 1. For obstacles or bodies in a flow, the induced fluctuating aerodynamic forces are recognized as the dominant sources. They are precisely equivalent to quasi-perpendicular dipoles in most situations of interest, such as the cir­cular cylinder in a flow (Fig. 1-a), thin airfoils with moderate camber and

so on.

Evaluating the acoustic power according to the aforementioned extended definition in a uniformly moving fluid requires quite tedious derivations, not detailed here. For instance, in the case of the monopole, the alternative expression of the amplification rate could be derived as

Подпись: 1 Mo (1 - M02)2 '

The Convected Wave Equation

M0 1. /1 + M0

(1 – Mo2)3 + 2 n 1 – Mo

Though mathematically different, the result is very close to the first evalu­ation for any reasonably subsonic Mach number, as shown in Fig. 12. It is found that globally source motion has a weak effect on sound power at Mach numbers typically below 0.3 or 0.5 depending on the source type, whereas the amplification is very significant at higher Mach numbers, characteristic of aeronautical applications.

It must be noted that the present simple developments do not hold any­more at source speeds approaching the speed of sound because the com­pactness needed for the definition of quasi-point sources cannot be ensured anymore.

Moving Sources

Подпись: F(x,t) Подпись: q(tej ) 4 n Rej 11 — M0 cos 0ej I ’ Подпись: (9)

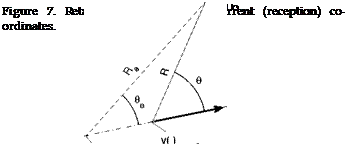
Retarded-potential formula, eq. (8) is a description in terms of station­ary sources. In order to address separately features related to source physics and source motion, going back to eq. (7) and specifying the motion in the source distribution S is more appropriate. In this section, we consider an el­ementary point source of strength q moving at constant speed U0 = |Uo| in rectilinear motion (Fig. 7). Then S(y, t’) = —q(t’) S(y — U0t’). Performing first the volume integral and then the time integral, and using properties of the delta-function (Jones (1972)) yields the simple expression

where the index e refers to quantities evaluated at the emission time and where M0 = U0/c0 is the Mach number. Indeed in a moving-source con­text the source continues its motion along its path during the propagation towards the observer. The received information at (x, t) is naturally ex­pressed as a function, not only of the source strength at the corresponding emission time but also of the retarded location ye = U0te, different from the current location y = U0t. The summation means that more than one retarded position is able to provide a contribution at (x, t) depending on the value of the Mach number. Using eq. (9) requires passage formulas be­tween both sets of current and retarded coordinates. This is achieved by solving the retarded-time equation t’ = te(t) or equivalently by geometrical considerations on the sketch of Fig. 7. The result is

Rty = в (M0 cos e(t) ± /M° cos2 в(і) + в2) , (10)

cos ee(t) = M0 + R(jl cos 0(t) , (11)

Re (t)

with fi = J1 — M2.

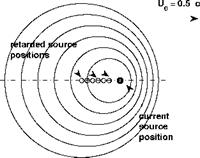
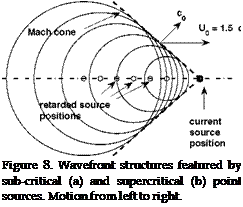
Equations (9) to (11) imply key features of the radiation process. First the Doppler factor 1 — M0 cos 9e in the denominator of eq.(9) causes aniso­tropy in the field, referred to as convective amplification. This is clearly understood from the instantaneous pattern of wavefronts emitted by the source at successive time steps, shown in Fig.8. For sub-critical motion (M0 < 1) all wavefronts get closer to each other in front of the source and spread away from each other behind. The quantity delivered by the source in the forward (resp. rearward) direction distributes in a smaller

Moving Sources

(resp. larger) volume between adjacent wavefronts, with respect to the case of a stationary source. The injection per unit volume is increased (resp. decreased), precisely in the ratio 1 — M0 cos ве.

Secondly, since Re(t) must be real and positive, the retarded-time equa­tion always has a single root given by the sign + in the formula when M0 < 1, and has zero or two roots depending on the angle в for the su­percritical regime M0 > 1 because both signs are acceptable. In this case the series of wavefronts intersect each other with a conical envelope called the Mach cone (Fig.8-b). As long as the observer is external to the Mach cone he cannot receive any signal, whereas once inside he always receives two signals from two different retarded locations.

Finally, if the source function is assumed monochromatic with strength q(t’) = q0 в-гШе l, the received signal cannot be monochromatic anymore. However performing a Taylor expansion of the solution around a reference time within a characteristic period of oscillation would restore an instanta­neous frequency at observer ш = ше/(1—M0 cos ве). The received frequency is higher (resp. lower) than the emitted frequency for an approaching (resp. retreating) source. This frequency shift is known as Doppler effect. Again it is understood from Fig.8: an observer located in front of (resp. behind) the source receives wavefronts at a frequency higher (resp. lower) than the frequency emitted by the source, in the ratio of the Doppler factor.

For supercritical moving sources this factor has a singularity for the crit-

(a)

Moving Sources
Подпись: Figure 8. Wavefront structures featured by sub-critical (a) and supercritical (b) point sources. Motion from left to right.

(b)

ical angle 0e = sin-1(1/Mo) encountered when the observer is exactly on the Mach cone attached to the source, at which the formalism breaks down. In order to give sense to the singularity, the supercritical moving elementary source can be simulated thanks to the identity with a linear distribution of stationary phased sources, provided that finite time and space scales are associated to the sources. This is illustrated in Fig. 9 in a discretized form with a series of impulses emitted by a linear array of sources, similarly to

Figure 9. Formation of a focused wave on the Mach cone of a supercritical source, synthesized by 17 Gaussian spots. Simulated Mach number M0 = 2, motion from left to right. From (a) to (d), successive time steps, gray scale updated for clarity.

what happens with Christmas electric garlands. Gaussian impulses which are solutions of the wave equation in spherical coordinates are used, ac­cording to the wave pattern y>(r, t) = [(r — c0 t)/r] e – a (r-c° t’) , where a is a parameter. Seventeen stationary sources are taken in the example to simulate a motion at Mach number 2 and the waves are superimposed at different time steps to produce the plots of the figure. The signal is found to focus as a spot on the Mach cone whereas it is rapidly attenuated in other directions. A closer look at the solution would exhibit a decay like the inverse square root of the propagation distance in the direction normal to the cone. Therefore the Doppler singularity is interpreted as a focused cylindrical wave in three-dimensional space (see Ffowcs Williams (1993)). When this happens with acoustic sources, sound propagates at much larger
distances than what is expected from simple spherical spreading. In aeroa- coustics, such focused waves are encountered in supersonic jets because of supersonically convected quadrupoles. The mechanism is known as ’Mach – wave radiation’. Advancing blade tips of high-speed helicopter rotors also produce equivalent waves because of quadrupole sources onset within the air beyond the tip radius and moving supersonically.

It is worth noting that for a supersonically flying aircraft, the Mach cone of the acoustic sources is hidden by the shock wave structure attached to the aircraft. The shock wave is a non-linear, compressible aerodynamic feature, whereas the Mach cone is a linear wave envelope, but the both of them have the same angle.

All preceding features refer to the wave equation and can be observed as well in particle physics and in water waves. For instance the formation of a Mach cone for supercritical particles in the high atmosphere is known as the Cerenkov effect, and a similar pattern is generated when making ducks and drakes on water surface with a flat stone. Further aspects of source motion in aeroacoustics accounting for space and time correlation scales are discussed by Crighton (1975).