Category Principles of Helicopter Aerodynamics Second Edition

Effect of Airfoil Shape on Hitching Moment

The effect of the airfoil shape on the pitching moment characteristics is of utmost concern for the design of helicopter rotors. As mentioned earlier, experiences with cambered airfoils on early autogiros resulted in significant blade twisting and high control loads. For

Table 7.4. Variation in Center of Pressure for Example Airfoil

Подпись: 10 0.256 AoA (deg.) -2 0 2 4 6 8

xCD 0.146 0.500 0.298 0.273 0.264 0.259

Effect of Airfoil Shape on Hitching Moment

Effect of Airfoil Shape on Hitching Moment

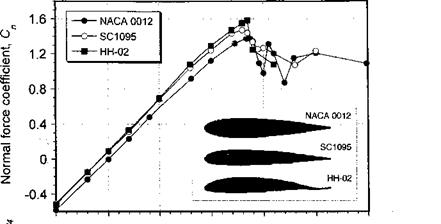
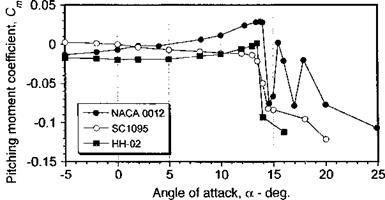
Figure 7.24 Comparison of lift and pitching moments on symmetric and cambered airfoils at Moo = 0.3. Data source: McCroskey et al. (1982).

many years, this led to the exclusive use of conservative, low pitching moment (symmetrical) sections on nearly all helicopters. Today, blades are torsionally stiffer because they are made of composite materials and control systems can also be made stiffer without a weight penalty. This has allowed the better high lift capabilities of cambered airfoils to be utilized on modern helicopter blades.

Figure 7.24 shows lift and pitching moment results for a NACA 0012 in comparison with two cambered helicopter rotor airfoils, one with a relatively small amount of camber (the SC 1095) and one with a larger amount of camber (the HH-02). Both the NACA 0012 and SC 1095 airfoils have relatively low zero-lift pitching moments, Cmo, whereas the HH-02 has a higher pitching moment. The actual moments that can be tolerated on a given rotor blade depends on structural and other requirements, as well as the type of hub and control system. Traditionally, various individual airfoils have been developed based on the minimization of Cmo. But by allowing radially varying airfoil sections on the blade, pitching moment limits placed on the airfoil section itself can be relaxed somewhat; the main requirement is that the resultant moment that is reacted by the blade and control system be minimized as much as possible. As described in Chapter 6, this is sometimes accomplished by using a reflex cambered airfoil at the inboard sections of the blade where the need for a high maximum lift coefficient is not as stringent.

The effect of camber and chordwise position of maximum camber can be readily studied using the thin-airfoil theory (see Section 14.8 for the equations). The NACA four-digit airfoils have a camberline that can be conveniently expressed in terms of two parabolic arcs that are tangent at the position of maximum camber. The camberline is defined by

Подпись: (7.71) (7.72) m _ _2

Ус = —т(2px — x ) for x < p,

P

in

Ус = j.——– ~r[(l -2p) + 2px – x2] for x > p,

(1- Pr

Effect of Airfoil Shape on Hitching Moment Effect of Airfoil Shape on Hitching Moment

where m is the maximum camber and p is the position of maximum camber, both as fractions of the chord. For example, the NACA 2412 airfoil has 2% camber at 40% chord with a thickness ratio of 12%. To use the thin-airfoil theory, the slope of the camberline is required. Differentiating the expressions for yc gives

Effect of Airfoil Shape on Hitching Moment

The thin-airfoil theory gives the pitching moment about the 1 /4-chord as C; —7t(A] — Af)/4, where

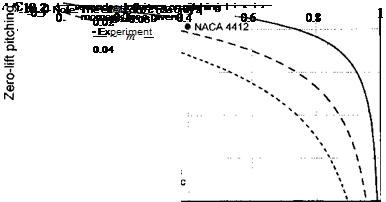
The results are summarized in Fig. 7.25 where the zero-lift pitching moment coefficient is plotted versus the point of maximum camber, p. Notice that forward camber has a much smaller effect on the pitching moment compared to camber applied near the trailing edge of the airfoil. Generally, the thin-airfoil theory will tend to slightly overpredict the pitching moment because of viscous effects, but the trends are correct.

Effect of Airfoil Shape on Hitching Moment

Chordwise position of maximum camber, p

Figure 7.25 Effect of chordwise position of maximum camber on pitching moment for the NACA 4-digit airfoils. Data source: Abbott & von Doenhoff (1949).

Center of Pressure

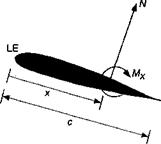
As shown previously by means of Fig. 7.15, the net aerodynamic loads on an airfoil may be represented by a normal force, an axial force (leading edge suction or chord force), and a pitching moment. For each value of the normal force a single point can be determined about which the pitching moment is zero. Therefore, the loading on the airfoil can be replaced only by normal and axial (chord) forces acting at this point, which is called the center of pressure. The aerodynamic center is a fixed point on the airfoil at a given Mach number and below stall, but the center of pressure moves to different locations on the chord with changes in AoA. For example, we may find the center of pressure, xcpj on an airfoil using the normal force and pitching moment about the 1/4-chord. Using Fig. 7.20 with xa = с/4 and x = xcp, we take moments about the leading edge to obtain

Подпись: (7.64)Подпись: (7.65)Mie = (Mi/4 — Л/) – = —Nxcp, and in coefficient form this becomes

— С ( I – jc

‘m i/4 — ‘-‘и ^ лср

Подпись: XCP - 4 Center of Pressure Подпись: (7.66)

so that the center of pressure is given by

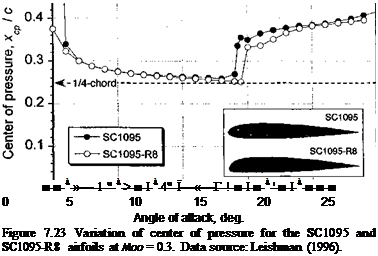
The coefficient Cmi/4 is generally negative, so that the center of pressure will be behind the aerodynamic center. This effect is shown in Fig. 7.23, where it will also be noticed that the center of pressure moves forward and approaches the aerodynamic center (which is near 1 /4-chord) for higher values of Cn, but below stall. After the airfoil stalls, the center of pressure stabilizes and approaches mid-chord. This reflects the form of the pressure distribution over the upper surface of the airfoil, which is much more uniform when the flow is separated.

Подпись: ■ ■ 1 »—-1 " 1 > ■ I 1 4" Ї—«—Г-! ■ I ■ 1 ' ■ I 1 ■ ■ ■ 0 5 10 15 20 25 Angle of attack, deg. Figure 7.23 Variation of center of pressure for the SC1095 and SC1095-R8 airfoils at Moo = 0.3. Data source: Leishman (1996).

0.5

Подпись: Table 7.3. Variation in Lift and Moment Coefficients for Example Airfoil AoA (deg.) -2 0 2 4 6 8 10 Q -0.16 0.06 0.28 0.50 0.72 0.94 1.16 г *-'"4/3 -0.03 -0.01 0.01 0.03 0.05 0.07 0.09

Consider an example to illustrate the forgoing concepts of aerodynamic center and center of pressure. If the results of the lift coefficient and the pitching moment about 1/3-chord as a function of AoA are given in Table 7.3 then it is possible to determine the position of the aerodynamic center and the variation of the center of pressure as a function of AoA. In addition, it is possible to determine the lift-curve-slope, the zero-lift AoA and the zero-lift pitching moment.

By inspection, we see that the lift-curve-slope, C/a, is exactly 0.11 per degree. We can write a simple linear relationship for the lift-coefficient that Ci = C/a(a — ao) where a0 is the zero-lift angle. It is easy to determine ao from any known value of Q. For example, when a = 0 then from the table Q = 0.06 so that ao = —0.06/0.11 = —0.45°. By inspection, the slope of the Cm,/3 by a curve is exactly 0.01 per degree. We can find the zero-lift pitching moment coefficient by using the equation

Сч = С"”і-(‘^£)(“"“»>• (767)

Using the result, for example, that СШ|/3 = —0.01 when a = 0 gives that

CmQ = -0.01 – 0.01(0.0 – (-0.45)) = -0.0145. (7.68)

The position of the aerodynamic center can be found from the lift and pitching moment about any known point using Eq. 7.62. In this case, we use the equation

Подпись: (7.69)1 ZdCmi/3 1 ґ<1СтиЛ (da “ 3 ~~ V dci / 3 ~~ V da )dCi)

Center of Pressure Подпись: r K'm i/3 Cl ’ Подпись: (7.70)

Substituting in the appropriate values leads to xac = 0.333 — 0.01/0.11 = 0.242. Finally, the center of pressure can be found from the equation

the results from which are given in Table 7.4. Notice again that the center of pressure comes closer to the aerodynamic center for larger values of Q (but below stall).

. Pitching Moment and Related Issues

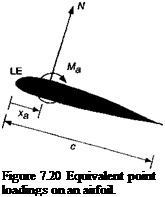
Because the pitching moment can be sensitive to small changes in the chordwise pressure distribution, its variation with AoA can be difficult to compute accurately. It may be estimated experimentally by direct measurement from a balance or by the integration of chordwise pressure about some reference point, as described previously. In either case, the pitching moment coefficient depends on the reference point chosen. For helicopter work, the 1 /4-chord point is normally used. Converting from one reference point to another uses the rules of statics. For example, assume the normal force and pitching moment are known at a point a distance xa from the leading edge of the airfoil and it is desired to find the pitching moment about another point, say at a distance x behind the leading edge (see Fig. 7.20). Taking moments about the airfoil leading edge in each case gives

Подпись: Figure 7.20 Equivalent point loadings on an airfoil.
. Pitching Moment and Related Issues

Mx = Ma + N(x – xa). (7.57)

Converting to coefficient form by dividing by |poo V^c2 gives

Подпись: (7.58)Cmx — Cn ( X Xq^ .

As an example, if the known pitching moment is about the leading edge, CmLE, then xa = 0 and the above equation becomes

Подпись:Сщх — CW££ -f xCn

Подпись: 7 7 1Л, єfqdynamic Сєнієг

There is one special point on an airfoil for which it is found that Cm is constant and independent of the AoA. This point is called the aerodynamic center. For angles of attack up to a few degrees below the stalling angle it is a fixed point on the chord and is relatively close to 1/4-chord. For a flat-plate airfoil in inviscid, incompressible flow, the aerodynamic center is theoretically on the 1 /4-chord axis. However, the thickness of the airfoil and viscous effects because of the development of a boundary layer usually cause the aerodynamic center to move a few percentages further forward or aft of the 1 /4-chord.

The aerodynamic center on an airfoil can be found with a knowledge of the normal force coefficient and the moment coefficient about any other known point. If the aerodynamic center is assumed to lie at a distance xac behind the leading edge, then

Cm. = cm„ + С» (j – ^f) = cm„ + C„ (xa – xac). (7.60)

Подпись: dCma dCn Подпись: dCma dCn Подпись: + (xa xac). Подпись: (7.61)

Differentiating the above equation with respect to Cn gives

Подпись: Xnr — Xn Подпись: dCma dcn Подпись: (7.62)

By definition, the aerodynamic center is that point about which the moment is independent of C„ and so the first term on the right hand side is zero. Therefore,

We can obtain dCma/dCn by using the result

Подпись: (7.63)dP^wia dCfna dot

dCn da dCn

or if Cma is plotted versus Cn and the slope of the best straight line is found, then the aerodynamic center can be determined by using Eq. 7.62.

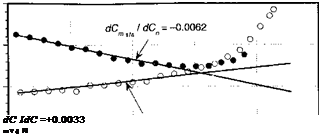
Representative results are shown in Fig. 7.21. In the attached flow regime, the data lie on a straight line, the slope of which gives the offset of the aerodynamic center from the 1/4-chord axis. For the SC1095 airfoil at this Mach number and Reynolds number, the aerodynamic center is located at approximately 25.6% chord, and for the SC1095-R8 the aerodynamic center is at 24.7% chord.

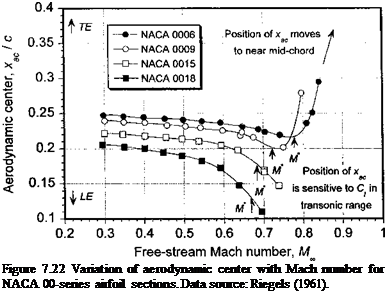
The effects of compressibility tend to move the aerodynamic center further aft of the 1 /4-chord, and for supersonic flow the aerodynamic center is situated near 50% chord. The measured behavior of the NACA 00-series airfoils is shown in Fig. 7.22, where it is apparent that the aerodynamic center initially tends to drift slightly forward with increasing Mach number. The explanation for this behavior lies in the effects of the pressure distribution on the developing boundary layer. Higher Mach numbers tend to form a pressure distribution

0

Подпись:. Pitching Moment and Related IssuesПодпись:5 -0.01

є

0

0 -0.02

о

CD

8 – о. оз

С

0)

J -0.04

Подпись: I ' 1 > і ■ і 1 1 ■ 1 і-0.05

-0.5 0 0.5 1 1.5 2

Normal force coefficient, C

’ n

Figure 7.21 Variation of C„,l/4 with C„ for SC1095 and SC1095-R8 airfoils at = 0.3.

Data source: Leishman (1996).

Подпись: Figure 7.22 Variation of aerodynamic center with Mach number for NACA 00-series airfoil sections. Data source: Riegels (1961).

that resembles one about an airfoil with a higher thickness ratio. Thin airfoils, such as the NACA 0006, tend to have an aerodynamic center that remains close to the theoretical flat-plate value of 1 /4-chord. Also, because of the higher critical Mach number of thin sections, the onset of shock waves is delayed and so the aft movement of the aerodynamic center occurs at relatively higher subsonic Mach numbers. When shock waves do occur (see Fig. 7.9), the movement of the aerodynamic center is dictated by the relative position of the upper and lower surface shock waves. Because these positions will be a function of both airfoil shape and AoA, a simple generalization of the aerodynamic center position in the transonic regime is usually not possible.

Representative Force and Moment Results

The data plotted in Fig. 7.18 show the low speed lift force coefficient, 1/4-chord pitching moment coefficient, and drag coefficient variations as functions of AoA for the

Angle of attack, a – deg.

Representative Force and Moment Results
Подпись: 0.5
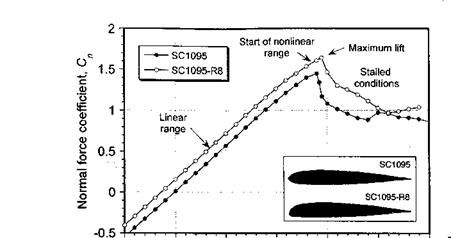
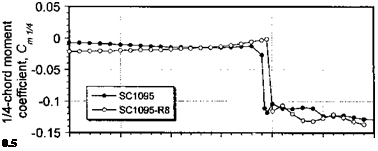
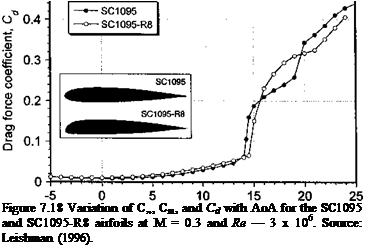
Подпись: Figure 7.18 Variation of C„, Cm, and Cd with AoA for the SC1095 and SC1095-R8 airfoils at M = 0.3 and Re — 3 x 10⁶. Source: Leishman (1996).

SC1095 and SC1095-R8 airfoils at M = 0.3.[26] The results are shown over an extended AoA that ranges from fully attached flow, where the lifting characteristics of an airfoil below stall are not substantially influenced by the presence of the boundary layer, to the fully stalled conditions where the flow has detached from the upper surface of the airfoil.

Below stall the resultant pressure forces on the airfoil are only slightly affected by the thickness and camber of the airfoil (provided they are small) and this is usually the case for most rotor airfoils. The lift on the airfoil section is proportional to its AoA and the local dynamic pressure. The lift per unit span of the blade can be written as

where Cia is the lift-curve-slope and is measured in per degree or per radian AoA. In coefficient form then

Подпись: (7.54)Q = Cia {a — «о) in the low a range,

where «о is the AoA for_zero lift or the zero-lift angle. The above relation comes under the category of linearized aerodynamics. For a real fluid, the lift varies linearly with AoA and is within about 10% of the above relation up to an angle of about 10-15°, depending on the Mach number and Reynolds number. Figure 7.18 shows that above a certain angle, the lift decreases and the pitching moment becomes increasingly negative (nose-down). This is a result of the onset of flow separation on the upper surface of the airfoil, which moves the center of pressure aft on the chord.

Подпись: Cla(Moo) Подпись: 2 TV Подпись: 2JT T' Подпись: (7.55)

The effects of compressibility manifest as an increase in the effective AoA, which in­creases the lift on the airfoil. In other words, the effects of increasing Mach number appear as an increase in lift-curve-slope. In linearized subsonic flow, this increase in lift-curve – slope is given mathematically by the Prandtl-Glauert or Glauert rule [see Glauert (1927, 1947)1, where

where 2tt is the lift-curve-slope in incompressible flow and the Glauert factor is f = л/і — M^, with Mqo as the free-stream Mach number. The Glauert correction factor is found to give good agreement with experimental measurements of the lift-curve-slope of airfoils of thin to moderate thickness-to-chord ratio, and will be a sufficiently accurate correction to apply in practice. An example is shown in Fig. 7.19 where the lift-curve-slope for several airfoils in the NACA 00-series is plotted versus Mach number. The agreement with the Glauert factor is generally good for thinner airfoils (in accordance with its derivation) and/or up until the critical Mach number, M*. Beyond this, the developments of shock waves and their interactions with the boundary layer produce a reduction in the lift-curve- slope throughout the transonic range.

Kaplan (1946) suggests an improvement to the Glauert correction using the rule

Подпись: 27Г (tjc) 1 + (t/c)Representative Force and Moment ResultsПодпись: (7.56)2n

CiSMoo) = —— +

p

where the second term represents the effects of thickness-to-chord ratio t/c. The Kaplan rule, however, tends to overpredict the magnitude of C/a(Moo) when compared to measurements and suggests a small further increase in Qa with increases in airfoil thickness. In practice the theoretical value of the lift-curve-slope can replaced by 2пгц (where r]i can be viewed as an efficiency factor) to account for such effects.

Pressure Integration

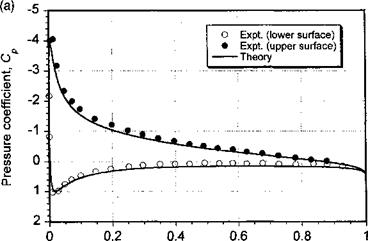
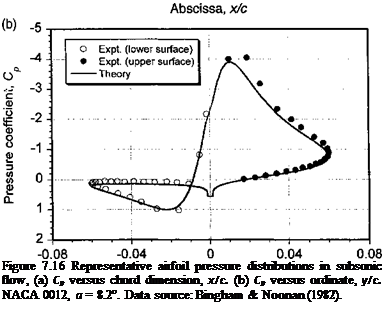
The accuracy with which the values of Cn, Ca, and Cm can be measured (or com­puted) depends on the number and location of the pressure points over the airfoil surface. A typical subsonic pressure distribution is shown in Fig. 7.16 and is compared to theory based on a standard panel method solution. The agreement is good, and any slight differences can likely be attributed to experimental uncertainty and wind tunnel interference effects. For subsonic flows, the suction peak and high adverse pressure gradients occur near the leading edge, so that there must be a bias of pressure points in the leading edge region to minimize

Pressure Integration

Подпись: Figure 7.16 Representative airfoil pressure distributions in subsonic flow, (a) Cp versus chord dimension, x/c. (b) Cp versus ordinate, y/c. NACA 0012, a = 8.2°. Data source: Bingham & Noonan (1982).

Ordinate, y/c

Pressure Integration

Transformed chord position, x/c

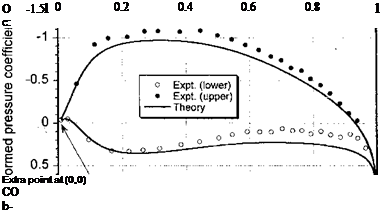
Figure 7.17 Transformation of chordwise pressure distribution to aid in numerical inte­gration. NACA 0012, a = 8.2°. Data source: Bingham & Noonan (1982).

errors in the integration process to find the forces and moments. At higher subsonic speeds and when transonic flow develops over the airfoil, the largest pressure gradients occur down­stream of the leading edge, usually near any shock waves. Therefore, the pressure points must be relocated to this region to adequately resolve the pressure distribution and maintain the accuracy in the calculation of the integrated loads. While numerically this can be easily done by respecifying the locations where Cp is to be calculated, in an experiment this is not usually possible because relocating pressure instrumentation on a wing or airfoil section can be expensive or impractical. Note from Fig. 7.16(b) that the integration with respect to airfoil thickness becomes particularly difficult if the suction peak and pressure gradients are not adequately resolved.

Подпись: ICpyfxJc and x* jc = yjx/c, Подпись: (7.51)
Pressure Integration

Special interpolation methods can sometimes be used to maintain accuracy in the calcu­lation of total forces and moments from discrete pressure points, as long as this is done with caution. One way of improving the accuracy with sparse numbers of points in the leading edge region is to apply a transformation to the measured or computed pressure distribution. One such transformation is

Pressure Integration

which is used by St. Hillaire et al. (1979) and McCroskey et al. (1982). The transformed variables C* and x*/c are then plotted in the conventional way. This transformation has the effect of providing a better definition of the leading edge pressure peak, as shown by Fig. 7.17, and also generating an additional point at (x*/c, C*) = (0,0). The coefficients Cn and Cm[E are given in terms of the transformed variables by

Aerodynamics of a Representative Airfoil Section

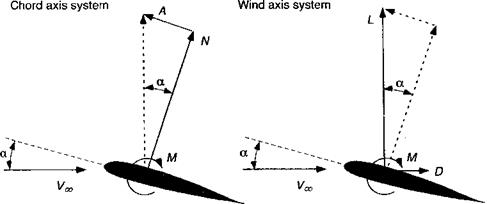
The resultant forces and moments acting on a typical section of the blade are the net result of the action of the distributed pressure and viscous shear forces, as shown schematically by Fig. 7.14. These forces and moments are obtained by integrating the local values of pressure and shear stress acting normal and parallel to the surface around the airfoil. The forces can be resolved into a wind-axis system (lift and drag) or a chord-axis system (normal force and chord force), as shown in Fig. 7.15. The lift force per unit length, L, acts normal to the velocity, Vqo, and the drag, D, is parallel to Vqo – Alternatively, this lift force can be decomposed into the sum of two other forces as shown in Fig. 7.15: the normal force, N, which acts normal to the airfoil chord, and the leading edge suction force or axial chord force, A, which points upstream and acts parallel to the chord.

7.6.1 Integration of Distributed Forces

Surface shear contributions to the normal force and the pitching moment are small and can usually be neglected. For the axial and drag forces, the shear stress contribution has a measurable effect and should always be included. If we consider the pressure forces

Aerodynamics of a Representative Airfoil Section

Figure 7.15 Decomposition of distributed surface pressure into resultant forces and mo­ments on an airfoil.

alone, then on the upper surface

dNu = —pudsu cosви, and dAu — —pudsu sm6u, (7.38)

where 6 is the local surface slope. On the lower surface

dNі = pidsi cos9u and dAi — pidsi sinfy. (7.39)

Integrating gives the normal and leading edge suction (axial) forces, respectively

Подпись:pi cos в dsi, (7.40)

pi sin 0 dsi, (7.41)

and the moment about the leading edge by

pTE pTE

Mle = I (pux cos 0 + piy sm9)dsu — I (—pix cos 9 + puy sin 9)dsi.

Jle Jle

(7.42)

The lift and the pressure drag are obtained by resolving the chordwise (axial) and normal forces through the AoA a to give

Подпись: (7.43) (7.44) L = N cos a + A sin a,

D — N sin a — A cos a.

Aerodynamics of a Representative Airfoil Section Aerodynamics of a Representative Airfoil Section Aerodynamics of a Representative Airfoil Section Aerodynamics of a Representative Airfoil Section Aerodynamics of a Representative Airfoil Section

The corresponding force and moment coefficients are defined as

(7.45)

Aerodynamics of a Representative Airfoil Section

where c is the airfoil reference chord. For a thin-airfoil this gives the normal, suction, and moment coefficients in terms of the pressure coefficient Cp:

The normal force coefficient can generally be used interchangeably with the lift coef­ficient in the low AoA regime. This can be seen by resolving the normal force and axial chord forces in the lift direction, that is

Подпись: (7.49)Ci = Cn cos a + Ca sin a.

Also, for 2-D potential flow we notice that Ca = Cn tan a (which follows from the fact that Cd — 0), so that

Подпись: (7.50)Ci = Cn cosa + Cn tana sina = C„ cosa + 0(a2) « C„.

For low to moderate angles of attack (i. e., for angles of attack less than 15°) С/ and Cn have almost the same numerical values.

Measurements of Chordwise Pressure

Representative measurements of chordwise pressure distributions about an airfoil at various angles of attack below stall in a subsonic flow are shown in Fig. 7.12. Although there is a stagnation region over the lower leading edge region where Cp is positive, over most of the airfoil Cp is negative. Note that as the AoA is increased from zero, the pressure reduction on the upper surface increases both in intensity and extent. The high adverse pressure gradients downstream of the leading edge make the boundary layer thicker, and ultimately when the adverse pressure gradients become too large, the boundary layer will separate from the surface causing stall.

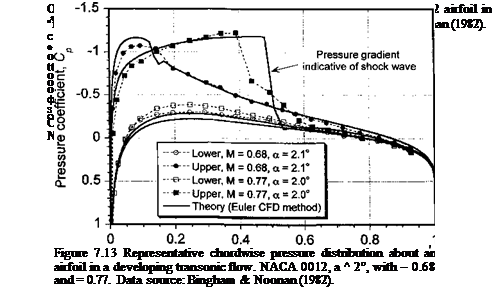
With the formation of regions of supercritical (locally supersonic) flow, such as found toward the tip of a rotor blade, the airfoil pressure distribution changes considerably. Mea­surements of the pressure distribution about an airfoil in a developing transonic flow are

Measurements of Chordwise Pressure

plotted in Fig. 7.13 for a condition where the flow is just supercritical (M^ = 0.68) and also for a supercritical condition (M^ = 0.77). The large adverse pressure gradients found near the leading edge in the subsonic case now move further aft to near the mid-chord of the airfoil, which is a result of the formation of a supersonic flow region and a shock wave. The adverse pressure gradients near the shock wave make the boundary layer on the surface – more susceptible to thickening and separation, resulting in higher drag. When the shock wave becomes stronger, flow separation will occur at the foot of the shock and the airfoil will ultimately stall if the AoA is increased any further.

Chord position, x/c

Pressure force, dp ds

Measurements of Chordwise Pressure

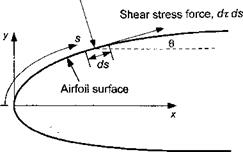
Figure 7.14 Pressure and shear forces acting on an element of the airfoil surface.

Synthesis of Chordwise Pressure

The ideas of synthesizing the distribution of chordwise pressure on the basis of contributions from camber and thickness envelopes are discussed by Abbott & von Doenhoff (1949). The velocity distribution about the airfoil, v/ V^, can be considered to be composed of three separate and independent contributions that are combined subsequently by linear superposition. These components of loading are: 1. A distribution of velocity vtfV00 cor­responding to that of the basic thickness form at zero AoA. 2. A distribution of velocity vc/ Voo corresponding to the camberline when operating at its ideal AoA. The ideal AoA corresponds to — «о, where «о is the AoA for zero-lift. 3. A distribution of chordwise load-

Подпись: ■сіНгІЇ+ігм'їаІ’* ІлоЯіпгг і» / f .I.V/U.44.I.XA£ IJ(XI rO Подпись:T c 1 глагііnгт р1пср1; олітаспапЛс tA tbp tV»in_oi Tfnil

11UJ IVUUUlg VIVJVl j VVU. VJ^/VUUJ tv VilV tllill Ull X VXi result for a flat-plate at AoA, although Abbott & von Doenhoff give tabulated values of Va/Voo for airfoils with finite thickness as obtained from other theoretical methods.

The local loading is equal to the difference in velocity between the upper and lower surfaces of the airfoil. In accordance with the principles of vortex sheets and thin-airfoil concepts, the velocity increment on one side of the airfoil surface is equal to the velocity decrement on the other surface. Therefore, the pressure coefficient can be obtained from

Synthesis of Chordwise Pressure(7.35)

Values for vt and vc can be read directly from the tables in Abbott & von Doenhoff (1949). Values of vc will be tabulated for a specified design lift coefficient. The additional loading is a function of airfoil thickness, and is usually tabulated for a lift coefficient of 1.0. Because the results will usually be required for lift coefficients other than 1.0, they must be scaled by multiplying the values of the additional loading va by f(a) where

Да) = C’~Q|, (7.36)

C/o

and where Q. is the ideal lift coefficient, Q is the desired lift coefficient, and C/0 is the lift coefficient for which the values of va were tabulated.

The perturbation velocity distributions for a large number of camberlines and thickness envelopes are tabulated by Abbott & von Doenhoff (1949), and the method of superposition offers a simple and convenient way of constructing estimates of chordwise pressure for any derived airfoil shape. More importantly, however, the technique provides key elements for

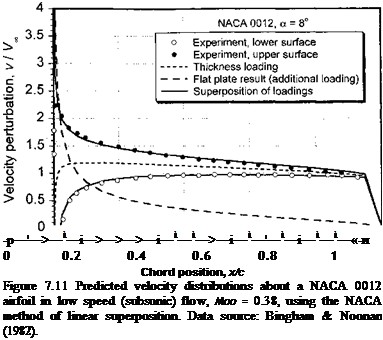
Подпись: -p—'—>—1—і—>—>—>—i—1—1—>—і—1—'—1—i—1—1—«-и 0 0.2 0.4 0.6 0.8 1 Chord position, x/c Figure 7.11 Predicted velocity distributions about a NACA 0012 airfoil in low speed (subsonic) flow, Moo = 0.38, using the NACA method of linear superposition. Data source: Bingham & Noonan (1982).

the understanding of how airfoil shape affects the aerodynamic characteristics. An example of the technique is shown in Fig. 7.11, where the velocity distribution across the chord of a NACA 0012 airfoil is plotted in terms of the constituent parts. We see that the technique gives good agreement with the measurements. However, the technique is obviously restricted to low (subsonic) speeds and low angles of attack where the assumption of linearity can be justified (see also Question 7.4).

In the first instance, the effects of compressibility on the pressure distribution can be predicted using the Glauert rule, which gives the pressure distribution at any Mach number CPm in terms of the incompressible value CPi using

CPU = (7.37)

which is restricted to conditions below the critical Mach number where linearity in the airloads can be assumed.

Airfoil Pressure Distributions

7.5.1 Pressure Coefficient

In measurements or calculations of the flow about airfoils, the surface pressure data are conventionally presented in terms of the pressure coefficient Cp. In incompressible flow, the definition of Cp follows from Bernoulli’s equation, that is,

Airfoil Pressure Distributions Подпись: 2 y(M*)2 Airfoil Pressure Distributions Подпись: (7.33)

then substituting into Eq. 7.28 gives

Подпись: Г — C '-'PM — '-Pi Airfoil Pressure Distributions Подпись: -1 Подпись: (7.34)

Note that C* is the pressure coefficient at the point on the airfoil when sonic conditions are first achieved, that is, M00 = M*. This point is generally not known a priori and is usually predicted on the basis of the minimum pressure coefficient found from incompressible flow. For this, the well-known Karman-Tsien relation [see Abbott & von Doenhoff (1949)] can be used where the compressible value CPM is related to the incompressible value CPi using

Airfoil Shape Definition

The importance of the airfoil shape on the rotor behavior was well known to Juan de la Cierva – see Cierva & Rose (1931). Cierva originally used a symmetric airfoil section on his Autogiros, but he later changed the airfoil to a highly cambered 17% thick section for better performance. While having a higher stalling AoA, this airfoil also had a higher pitching moment, which resulted in blade twisting and control problems and finally led to a crash of a Cierva Model C-30 Autogiro – see Beavan & Lock (1939). This event, and the generally low torsional stiffness of early wood and fabric helicopter blades, led to the almost universal use of symmetric airfoil sections on helicopters produced prior to 1960. Although symmetric airfoils offered a reasonable overall compromise in terms of maximum lift coefficient, low pitching moments and high drag divergence Mach numbers, they were by no means optimal for attaining maximum performance from the rotor. However, it was not until the early 1960s that a more serious effort came about to improve airfoil sections for use on helicopters.

As early as 1920, a number of different research institutions had begun to examine the characteristics of various airfoils and organize the results into families of airfoils, basically in an effort to determine the profile shapes that were best suited for specific applications. In the United States, NACA conducted a comprehensive and systematic study of the effect of airfoil shape on aerodynamic characteristics. Existing cambered airfoils such as the Clark-Y and Gottingen 398 sections were known from early experiments to have good aerodynamic characteristics. These airfoils were used by NACA as a basis and were found to have geometrically similar shapes when the camber was removed and the airfoils were reduced to the same thickness-tcbchord ratio. NACA then followed a procedure where a

given airfoil could be constructed of a thickness shape that was distributed around a camber line. This allowed the systematic construction of several families of airfoil sections. The use of linearized methods such as thin-airfoil theory also enabled the chordwise aerodynamic loading associated with camber and thickness to be studied, allowing means of designing airfoils to meet specific purposes. The various families of airfoils developed by NACA were then tested in the wind tunnel to document the effects of varying the important geometrical parameters on the airfoil lift, drag, and pitching moment characteristics as a function of AoA, Reynolds number, and Mach number. Variables found to have important effects on the airfoil characteristics included the maximum camber and its distance aft of the leading edge and the leading edge nose curvature (nose radius) of the airfoil. A summary of the results are documented in considerable detail by Abbott et al. (1945) and Abbott & von Doenhoff (1949).

Two of the most popular airfoils used on many early helicopters were the symmetric NACA 0012 and NACA 0015 sections. These airfoils were found to have low pitching moments about the 1 /4-chord and good low-speed as well as high-speed (transonic) per­formance, giving a relatively high maximum lift and a high drag divergence Mach number. Because these airfoils were also relatively thick, the stiffness of the blade could be main­tained while keeping blade weight to a minimum. The upper and lower surfaces of the NACA four-digit symmetrical sections (or thickness envelopes) are described by the polynomial

± — = y, = 5F[0.29690V* – 0.12600* – 0.35160*2 c

+ 0.28430*3 – 0.101503c4], (7.18)

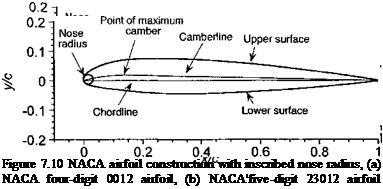
where t/c = t = maximum thickness as a fraction of chord. For example, for the NACA 0012 airfoil t = 0.12. The corresponding leading edge radius of the airfoil is rt = 1.101912. The center for the leading edge radius is found by drawing a straight line through the end of the chord at the origin of the axes and moving a distance along the x axis that is equal to the leading edge radius. The nose radius is then inscribed and faired onto the upper and lower surfaces of the airfoil. The resulting shape is shown in Fig. 7.10(a). The analytic form of the construction lends itself easily to computer generation of the airfoil coordinates – see, for example, Ladson et al. (1995).

A similar approach is used for cambered airfoils, but the mean line (camber line) is used for laying out the airfoil shape. The camberline can be specified as yc — yc(xc). If the slope of the camberline makes an angle в with the chord line, then the airfoil shape is obtained by plotting the thickness distribution at right angles to the slope of the camberline. This will give the upper (jc„, y„) and lower coordinates (xi, yi) of the airfoil:

xu = x — yt sin# and yu = yc + yt cos в, (7.19)

*; = X + у, sin в and у/ = yc — у, cos в, (7.20)

where в = ta. n~l(dyc/dxc). In effect, the shape is being defined as a tangent to a series of circles of radius y, with centers on the camberline. For cambered airfoils, the center for the leading edge radius is found by drawing a straight line through the end of the chord at the origin of the axes but with slope equal to the slope of the camberline at * = 0.005, and then moving along this line a distance that is equal to the leading edge radius. Because of the form of the geometric construction of cambered airfoils, the leading edge part of the nose radius protrudes very slightly forward of the origin at jc =0. As with the symmetric airfoils, the nose radius is then inscribed and faired onto the upper and lower surfaces.

x/c

Various series of mean lines were developed by the NACA, and some of the resulting sections (and derivatives) can be found on modem helicopter blades. Many mean lines, such as the three-digit mean lines, are defined by two equations derived to produce shapes having progressively decreasing camber line slope from the leading edge to the trailing edge. The slope of the camberline is zero at the point of maximum camber (denoted by p) and is constant aft of point m over the trailing edge. The equations for these mean lines are

Подпись:

Airfoil Shape Definition

yc = ^k[ [x3 — 3mx2 + m2{3 — m)x from x = 0 to x = m,

_ A <3 _

Ус = ~km (1 — x) from x = m tox = 1. 6

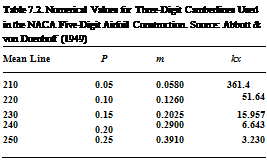
Values of p were selected to give five positions of maximum camber, and values of k were selected to give a design lift coefficient of0.3. The various values of p, m, and&i forthe three – digit camberlines are given in Table 7.2. Figure 7.10(b) shows the graphical construction of the NACA 23012 section, which has been used as a baseline for many modem helicopter airfoil sections. It is derived from the 230 mean line plus the 0012 thickness distribution, and it has a maximum camber at 15% chord and a thickness-to-chord ratio of 12%.

Modifications to the four-digit and five-digit series of NACA airfoil sections include reflex camber to produce zero pitching moment [see Jacobs & Pinkerton (1935)] and changes in the nose radius and position of thickness to improve C/max capability [see Stack

Подпись: Table 7.2. Numerical Values for Three-Digit Camberlines Used in the NACA Five-Digit Airfoil Construction. Source: Abbott & von Doenhoff (1949) Mean Line P m kx 210 0.05 0.0580 361.4 220 0.10 0.1260 51.64 230 0.15 0.2025 15.957 240 0.20 0.2900 6.643 250 0.25 0.3910 3.230

& von Doenhoff (1934)]. The latter sections have seen some use on helicopter rotor and are denoted by a two-digit suffix, such as the NACA 0012-64 and NACA 23012-64. The first integer after the dash indicates the relative magnitude of the nose radius, with a standard nose radius denoted by 6 and a sharp radius by 0. The second digit indicates the position of maximum thickness in tenths of chord.

An early series of special helicopter sections was designed at NACA by Tetervin (1943) and Stivers & Rice (1946). These airfoils, which have NACA 3-H-00 through NACA 10- H-00 series designators, were designed to have lower overall drag over a useful range of lift coefficients but still retain relatively low pitching moments. These airfoils are also discussed by Gessow & Myers (1952).

Another set of NACA airfoils that has seen some use in helicopter applications is the six-digit series. These airfoils were designed to achieve lower drag, higher drag divergence Mach numbers, and higher values of maximum lift. The shapes of these airfoils is such that they are conducive to maintaining an extensive region of laminar flow over the leading edge region and, thereby, lowering skin friction drag, at least over a range of AoA that is limited to low lift coefficients. This is achieved by using camberlines that have a uniform loading from the leading edge to a distance x = a, and thereafter the loading decreases linearly to zero at the trailing edge. The favorable pressure gradients tend to give the airfoils lower drag compared to other airfoils, but these characteristics are easily spoiled by surface contaminants or other transition causing disturbances. There are many designator combinations used in the six-digit number system. For example, consider the NACA 64з – 215 a = 0.5 section. In this case, the number 6 denotes the airfoil series, and the 4 denotes the position of minimum pressure in tenths of chord for the basic symmetric section. The 3 denotes the range of lift coefficient in tenths above and below the design lift coefficient for which low drag may be obtained. The 2 after the dash indicates a design lift coefficient of 0.2, and 15 denotes a 15% thickness-to-chord ratio. These and many other airfoil designators are explained by Abbott & von Doenhoff (1949).