Category Theoretical and Applied Aerodynamics

Rapid Prototyping

Rapid prototyping is a process by which the airplane main lifting component, the wing, can be sized and its weight estimated. For a composite wing, given the span and the chord, the weight depends on its volume, and the density of the foam used to build the wing core, and its surface area, and the density of the carbon fiber/glass fiber materials to make the wing skin. The weight of the other components, fuselage, tail and landing gear are also estimated, and by subtraction from the gross weight at take-off, the payload prediction is obtained and a flight raw score calculated. This code is a “cookie-cutter” for the wing as it estimates the best chord size for a given span and wing profile lift characteristics. The following assumptions are made to simplify as much as possible the analysis:

(i) rectangular wing with span b and chord c

(ii) elliptic circulation (the lower the aspect ratio AR, the more appropriate it is)

(iii) drag coefficient defined by

CL

Cd — Coo + ^ (11.24)

n eAR

(iv) engine thrust T(V) — T0 – KV

(v) rolling friction is neglected (although it had been implemented when taking-off from grass field)

The aspect ratio is defined as AR = b2/S where S is the wing area and reduces to AR = b/c for a rectangular wing. The zero-lift drag coefficient CD0 is estimated from the airplane wetted area and parasitic drags (landing gear primarily). The efficiency factor, e, is close to unity (e = 0.9) for a wing of medium aspect ratio, AR = 10 or so, but could be closer or even larger than one with winglets. The lift coefficient CL depends on the setting angle of the wing on the fuselage which determines the wing incidence during the rolling phase. The propeller is selected to match the engine and to produce a high static thrust T0 in (N) at high nominal rpm, measured with a fish scale. As the airplane accelerates, the thrust decreases. For simplicity, we use the actuator disk theory to estimate T(V) at low speeds. A more accurate approach would be to measure the thrust of the propeller placed in a wind tunnel or to use a propeller code (if the engine power were known as a function of rpm). Let Ub be the average axial induced velocity at the rotor, then power and thrust are given by

P = 2np R2(V + Ub)2Ub (11.25)

T = 2npR2(V + Ub)Ub, ^ T0 = 2npR2Ub2 (11.26)

Assuming that the power remains constant at low speeds, the condition dP = 0 reduces to

Подпись: (11.27)Подпись:dUb 2Ub

~dV = – V + 3Ub

On the other hand, the change in thrust at low speeds reads

dT 2 ( dUb 2 V + Ub

= 2np R2 Ub + (V + 2Ub) b =-2np R2 b-Ub

dV dV V + 3Ub

Upon elimination of Ub one finds

dT


Rs/pT


(11.29)


dV


Rapid Prototyping

with T0 and K, the model can be further developed. Newton’ second law reads

d2x dV dV dx dV 1 2

M 2 = M = M = MV = T0 – KV –pV2ArefCo (11.30)

dt2 dt dx dt dx 2

The last term corresponds to the total aerodynamic drag, i. e. viscous drag and induced drag, D = 1 p V2 ArefCD. One can separate the variables and write

MVdV

T0 – KV – 1 pArefCDV2

Подпись: V1,2 Подпись: —K ± УK2 + 2pArefCoT) P ArefCo Подпись: (11.32)

Let У1 and V2 be the roots of the quadratic equation for V

The positive root, V2, corresponds to the maximum velocity obtained as asymp­totic limit over an infinite rolling distance (V1 has no physical significance). The equation can now be written as

VdV 1 V1 V2 1 dx

(V — V1)(V — V2) V1 — V2 V — V1 V — V2 2PAref D M

(11.33)

Upon integration from V = 0 for a finite rolling distance (say, L = 55 m = 180 ft to allow for rotation before take-off) one finds

VT—Vi (V2‘n(— V‘ln(^)) = 1PV2ArefCoM (1134)

Подпись: V(n+1) = V2 Rapid Prototyping Подпись: exp Rapid Prototyping

This is an implicit equation for the take-off velocity V. It can be solved itera­tively as

(11.35)

where n = 0, 1,… is the iteration index. An initial guess is V(0) = V2.

Подпись: в Подпись: T (V) — D Mg Подпись: (11.36)

Given a maximum lift coefficient CLmax for the wing at take-off, the drag D at take-off is known and the climb angle в can be calculated as

The wing span being given (and changed if the rules allow), the code performs a loop on the wing chord by steps of 1 cm. For each chord size, the wing weight is calculated and the gross weight of the airplane estimated. The take-off velocity is then calculated, using the above iterative formula. Finally the climb angle is obtained and the loop on the chord is terminated when the climb angle is в > 3°. This value is chosen to allow the airplane to clear the runway, but also to account for uncertainties. The flight score is predicted from the payload.

Fine tuning of the configuration is carried out with the next level of modelisation.

Aerodynamic Coefficients for the Fuselage

According to slender body theory, the fuselage does not contribute to lift.

The drag coefficient, CDf0 is calculated with the flat plate formula at Reynolds number Ref = pUlref! r, where lref is the fuselage length. The plate width is estimated to be hf such that the fuselage wetted area is approximately hflref.

The fuselage moment coefficient is now obtained. In slender body theory, the lift of a truncated body of revolution, with base area A = n R2 as reference area, is given by

Cl = 2a (11.12)

A truncated fuselage that extends from the nose to x will have a lift force given by

12

L =-pU2A(x) 2a (11.13)

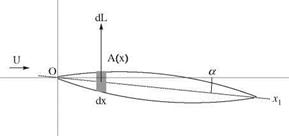
A small section of the fuselage from x to x + dx will have a lift force dL (see Fig. 11.3)

dL = pU2a A'(x)dx (11.14)

that will contribute to the pitching moment as

z

Aerodynamic Coefficients for the Fuselage

Fig. 11.3 Moment of a body of revolution at incidence


Подпись: 2 lref , M,0f — — pU a A (x)xdx 0 Подпись: pU 2a Подпись: [A(x) x]0ef Подпись: lref A(x)dx 0

The minus sign is due to the convention of a positive nose up moment. The integration yields

(11.16)

In the integration by parts, the first term cancels out since the fuselage has zero area at its extremities, and the integral term represents the fuselage volume й f. Hence the fuselage moment reduces to

M, of — pU2 й f a (11.17)

In dimensionless form, using the maximum cross section area A f as reference area, one gets

2й f

Cm, of = — a (11.18)

Aflref

Note that the fuselage moment slope dCMof /da is positive, which is a destabi­lizing moment. In general, the fuselage contribution to the moment is small.

11.2.2 Global Aerodynamic Coefficients for the Glider

The aerodynamic coefficients for the complete configuration cannot be obtained by summing the individual coefficients of each component of the glider, since the reference areas and reference lengths are different. But forces and moments can be summed, and not accounting for the dynamic pressure, one can write

ArefCo — AmCom + At Cot + AfCof (11.20)

Arefl refCM, o — AmcamCM, om + AtcatCM, ot + Aflre fCM ,of (11.21)

The global aerodynamic model for the lift and moment coefficients, is linear. If one chooses as area of reference the sum of the wing and tail areas, the global lift coefficient becomes

Подпись: (11.22)AmCL m + AtCLt
Am + At

Aerodynamic Coefficients for the Fuselage Подпись: (11.23)

and the global moment coefficient

It is easy to see that the lift and moment slopes are thus combinations of the wing, tail and fuselage slopes and do not depend on the tail setting angle tt. But the a — 0 coefficients of lift and moment depend on tt.

Linear Model for the Tail

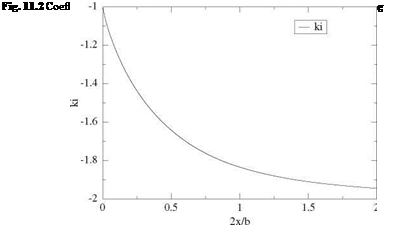
With the classical configuration, the tail is influenced by the downwash of the main wing. The downwash varies from ww at the wing (x = 0) to wT = 2ww in the Trefftz plane (x = +ro). The coefficient of downwash, ki = wt/ww| at the tail location is between -1 and -2. A study of the downwash induced by the vortex sheet of an elliptically loaded wing, provides a quantification of this effect, as shown in Fig. 11.2.

One also assumes a rectangular tail with an elliptic loading. This is a valid approx­imation since the tail has a low aspect ratio ARt = bt /ct where bt and ct are the tail span and chord, respectively. The tail mean camber is dt. The tail lift coefficient is given by

Подпись: Cbt = 2n

Linear Model for the Tail

dt

a + aim + ait + tt + 2 (11.7)

ct

Подпись:Подпись: (11.8)

Linear Model for the Tail Подпись: (11.9)

where aim represents the induced incidence due to the wing downwash at the tail lifting line and ait that due to the tail downwash on itself. Using the results of Prandtl Lifting Line

The linear decomposition for the tail lift consists of

dCLt 2n A + ki dCLm

da 1 + Ar n ARm d a

2n dt ki

CLt0 (tt) = 2 tt + 2- + *- CLm0 (11.10)

1 + Ar, Ct П ARm

Note that the tail setting angle tt, which controls the airplane flight operation, does not appear in the tail lift slope. The reference area for the tail lift is the tail area At = btct.

The tail drag is the sum of the friction drag CDt0 and the induced drag CDit calculated with formulae similar to those used for the wing. The area of reference for the tail drag is At.

Подпись: dCM,ot d a Подпись: xact dCLt cat d a Подпись: CM,ot0(tt) = —П - CLt0 (tt) ct cat Подпись: (11.11)

The moment coefficient for the tail can be decomposed as

Again, we note that the moment slope for the tail is independent of the tail setting angle.

Model of a Classical Wing/Tail Configuration

As starting point, one shall assume incompressible, steady, attached flow on the fuselage and the tail. The main wing, of medium to large aspect ratio, either uses the simple linear model presented below, or a more accurate model based on the Prandtl Lifting Line theory. When the latter model is not available, the linear model for the wing is used.

11.2.1 Linear Model for the Main Wing

Consider a rectangular, untwisted wing of span bm and chord cm, equipped with an airfoil of constant relative camber, dm /cm. The wing aspect ratio is ARm — bm/cm. Let a be the geometric incidence, i. e. the angle between the incoming flow vector U and the fuselage axis Ox1 which serves as reference for the angles. The coordinate system attached to the airplane is composed of the (Ox1? Oy^ Oz1) axes, with Ox1 oriented downstream, Oy1 aligned with the right wing and Oz1completing the direct coordinate frame. Accounting for the induced incidence, assumed constant along the span (elliptic loading), and building up on the results from thin airfoil theory, the lift coefficient is given by

Model of a Classical Wing/Tail Configuration

(a + tm + 2 dm

cm


(11.1)


Model of a Classical Wing/Tail Configuration

tm is the setting angle of the wing on the fuselage. The linear model comprises the lift slope and the a — 0 lift coefficient as

dCLm

da


Model of a Classical Wing/Tail Configuration

2n


(11.2)


Model of a Classical Wing/Tail Configuration

Model of a Classical Wing/Tail Configuration

The reference area for the wing lift is the wing area Am — bmcm. At small incidences, the friction drag is estimated with a flat plate formula

2-1R2L, Recm < 5.0 X 10⁵

Recm

20037, Recm > 5.0 X 10⁵

Cd-0 —


(11.3)


Re.


where Recm is the Reynolds number based on the wing chord. The factor 2 accounts for the two sides of the wing. The reference area for the wing friction drag is Am (Fig. 11.1).

The induced drag is given by the classical formula

Lm

Ж emARm

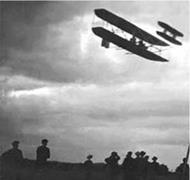
Fig. 11.1 Wright Flyer III, (from http://wright. nasa. gov/ wilbur. htm)

Model of a Classical Wing/Tail Configurationem is the wing efficiency or efficiency factor. For a medium aspect ratio wing (AR ~ 10) a value em = 0.9 is acceptable, but values that are higher or even larger than one are possible if winglets are added. The total drag of the main wing is thus
CDm = CDm0 + CDim.

Подпись: CM,om — CM,a Model of a Classical Wing/Tail Configuration Подпись: (11.5)

The moment coefficient of the main wing about the origin of the coordinate system, located at the nose of the airplane, results also from thin airfoil theory as

where Cm, acm — – n dcm is the moment about the aerodynamic center of the wing (function of the mean camber), xacm is the location of the quarter-chord of the wing and cam is the mean aerodynamic chord (here cam — cm). The linear decomposition of the moment reads

dCM, om xacm dCLm „ dm xacm

” = ” j cM, om0 = cLm0 (11.6)

d a cam d a cm cam

The reference “volume” for the wing moment is Amcam

Glider and Airplane Design

11.1 Introduction

This chapter deals with simple aspects of airplane design and stability analysis which have been motivated by one of the authors (JJC) participation over the last 15years, as faculty advisor of a team of undergraduate students, in the Society of Automotive Engineering (SAE) Aero-Design West competition. This is a heavy lifter competition. Each year SAE publishes new rules for the competition, enticing students to design a different airplane. In the “regular class”, the power plant and engine fuel are imposed and the airplane must take-off within a 200 ft runway. Some other constraints change from year to year, such as maximum wing span, or maximum lifting surfaces area, etc. In the “advanced class”, the engine displacement is specified, but the engine make and fuel are the team’s choice. A take-off distance is either imposed or targeted with a flight raw score depending heavily on how close to 200 ft take-off occurs. A round counts when the airplane lands within a 400 ft marked area of the runway without having lost any part. Then, the payload is removed from the payload bay and is weighted to attribute points to the flight. During these years, basic prediction tools were developed to help students design and predict their airplane performance. They consist of three simple computer models, a rapid prototyping code, a ground acceleration code and a flight equilibrium code. Furthermore, each year, the SAE competition has served as an on-going project in the applied aerodynamics class, culminating in a design project, as last assignment for the quarter, that adheres to the SAE rules of that year. This was a source of motivation for the students as many of the team members of the Advanced Modeling Aeronautics Team (AMAT) are taking the class. Since 2006, a double element wing was used, which attracted a lot of interest and proved to produce a very high lift. This chapter describes the various models implemented, with a view to helping students with design and estimation of airplane performance. First, the aerodynamic model of a classical configuration is developed, with the main wing in the front and the tail behind it. This is an easier model to study than the “canard” configuration in which small lifting surfaces are placed near the front of the fuselage and the main wing is moved further back, due to the more complex interaction of the canard on the main wing.

© Springer Science+Business Media Dordrecht 2015 373

J. J. Chattot and M. M. Hafez, Theoretical and Applied Aerodynamics,

DOI 10.1007/978-94-017-9825-9_11

Problems

10.10.1

Using the result of the actuator disk theorems that the average induced velocity at the Trefftz plane is twice that at the rotor, u2 = 2u, show that the application of Bernoulli’s equation upstream and downstream of the disk provides the thrust force on the rotor as T = — (p+ – p-) A where p+ – p – =< p > represents the pressure jump across the actuator disk. Conclude.

10.10.2

As shown in Fig. 10.6, make sketches of the 1-D stream tubes and sketch the blade element operating conditions in the rotating frame as in Fig. 10.11, in the following cases (assume symmetric airfoil profile for simplicity):

(i) u = 0

(ii) u = — 1

(iii) u > 0

and indicate for each case if the flow situation corresponds to propeller, freewheeling or turbine.

10.10.3

By application of the Biot-Savart formula, show that the axial velocity along the x-axis, induced by the vortex sheets in the Trefftz plane, is twice that induced in the plane of the rotor. Hint: consider a single vortex filament n = const. and assume a perfect helix with constant pitch such as given by

У – = П cos(ak – + ч) = п sin( Шї – + ч)

10.10.4

Derive the remainders Saj, k and Scj, k given in Sect. 10.4.2.

10.10.5

Consider the scheme for the convection equation:

дГ дГ

+ С1 + 2u) — 0

д t дх

given in paragraph 6.1, with в — 2.

(i) Show that the scheme is unconditionally stable

(ii) Show that, on a uniform mesh Ax — (1 + 2u)At the scheme has the “perfect shift” property.

Acknowledgments One of the authors (JJC), acknowledges that part of the material in this chapter was originally published in the International Journal of Aerodynamics, Ref. [21].

References

1. Hand, M. M., Simms, D. A., Fingersh, L. J., Jager, D. W., Cotrell, J. R., Schreck, S., Larwood, S. M.: Unsteady Aerodynamics Experiment Phase VI: Wind Tunnel Test Configurations and Available Data Campaigns, NREL/TP-500-29955 (2001)

2. Rankine, W. J.: Trans. Inst. Nav. Archit. 6, 13 (1865)

3. Froude, R. E.: Trans. Inst. Nav. Archit. 30, 390 (1889)

4. Betz, A.: Wind Energie und Ihre Ausnutzung durch Windmuhlen. Gottingen, Vandenhoeck (1926)

5. Joukowski, N. E.: Travaux du Bureau des Calculs et Essais Aeronautiques del’Ecole Superieure Technique de Moscou (1918)

6. Prandtl, L., Betz, A.: Vier Abhandlungen zur Hydro – und Aero-dynamik, Selbstverlag des Kaiser Wilhelminstituts fur Stromungsforshung. Gottingen Nachr. Gottingen, Germany (1927)

7. Goldstein, S.: On the vortex theory of screw propellers. Proc. R. Soc. Lond. Ser. A 123,440-465 (1929)

8. Betz, A.: Schraubenpropeller mit geringstem Energieverlust, Nach der Kgl. Gesellschaft der Wiss. zu Gottingen, Math.-Phys. Klasse, pp. 193-217; reprinted in Vier Abhandlungen zur Hydro – und Aero-dynamik, by L. Prandtl and A. Betz, Gottingen, 1927 (reprint Ann Arbor: Edwards Bros. 1943), pp. 68-92 (1919)

9. Munk, M. M.: The Minimum Induced Drag of Aerofoils, NACA report. 121 (1921)

10. Chattot, J.-J.: Optimization of wind turbines using helicoidal vortex model. J. Sol. Energy Eng. Spec. Issue: Wind Energy 125(4), 418-424 (2003)

11. Chattot, J.-J.: Computational Aerodynamics and Fluid Dynamics: An Introduction. Scientific Computation. Springer, Berlin (2004). ISBN 3-540-43494-1, Second Printing

12. Chattot, J.-J.: Analysis and design of wings and wing/winglet combinations at low speeds. Comput. Fluid Dyn. J., Spec. Issue, 13(3) (2004)

13. Drela, M.: XFOIL: an analysis and design system for low reynolds number airfoils. In: Mueller, TJ. (ed.) Low Reynolds Number Aerodynamics. Lecture Notes in Engineering, vol. 54, pp. 1-12. Springer, Berlin (1989)

14. Chattot, J.-J.: Helicoidal vortex model for steady and unsteady flows. Comput. Fluids 35, 733-741 (2006)

15. Coton, F. N., Wang, T., Galbraith, R. A. McD: An examination of key aerodynamics modeling issues raised by the NREL blind comparison. AIAA paper no. 0038 (2002)

16. Hallissy, J. M., Chattot, J.-J.: Validation of a helicoidal vortex model with the NREL unsteady aerodynamic experiment. Comput. Fluid Dyn. J. Spec. Issue 14(3), 236-245 (2005)

17. Schmitz, S., Chattot, J.-J.: Method for aerodynamic analysis of wind turbines at peak power. J. Propuls. Power 23(1), 243-246 (2007)

18. Chattot, J.-J.: Effects of blade tip modifications on wind turbine performance using vortex model. Comput. Fluids 38(7), 1405-1410 (2008)

19. Chattot, J.-J.: Helicoidal vortex model for wind turbine aeroelastic simulation. Comput. Struct. 85, 1072-1079 (2007)

20. Chattot, J.-J.: Optimization of propellers using helicoidal vortex model. Comput. Fluid Dyn. J. 10(4), 429-438 (2002)

21. Chattot, J.-J.: Wind turbine aerodynamics: analysis and design. Int. J. Aerodyn. 1(3/4), 404-444 (2011). http://www. inderscience. com/jhome. php? jcode=ijad

Propellers

Подпись:Подпись: CP = n

Propellers

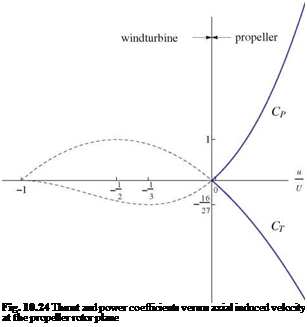
The actuator disk theory, applied to a propeller, yields the same results for the thrust and the power coefficients, except that the fluid accelerates behind the propeller so that the inductance is now positive, u2 = 2u > 0 and the thrust coefficient is negative, while the power coefficient is positive

Подпись: Fig. 10.24 Thrust and power coefficients versus axial induced velocity at the propeller rotor plane

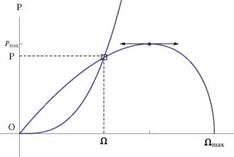
This is shown in Fig. 10.24. Note that the thrust and power vary monotonically with u, and do not have extremum values. The vortex model for the analysis of a propeller is identical to that of the wind turbine. The difference resides in the fact that the engine or motor power is given: typically, the engine characteristic is given, i. e. power versus rpm, and can be quite different for a gas engine and an electric motor. The characteristic curve for an electric motor is linear, whereas, for a gas engine it looks like the semi-cubic in Fig. 10.25. For a given geometry, at a given advance ratio, the power coefficient pT is sought by iteration, as with wind turbine analysis, until the values match at the rotor and the far wake. As a result, the power p and the

Подпись: Fig. 10.25 Characteristic power versus rpm curve for a gas engine and matching with analysis result
Propellers

rotational speed Q are obtained, Fig. 10.25. The incoming flow velocity U and the induced axial velocity u, are then found.

The situation is slightly different for the design of a propeller, [20]. Given a rotor diameter, velocity and power (or torque) at a specified rpm, it is possible to design the rotor that will produce the maximum thrust (negative) in absolute value by minimization of the objective function

F (Г) = Ct (Г) + ХСт(Г) (10.106)

pT is known and there is no need to iterate the vortex structure which is determined once for all.

Подпись: 2 92ф (1 + M )f + Propellers Подпись: 0 < f = в — < n, 0 < M adv Подпись: r < ж adv (10.107)

Goldstein [7], found an analytical solution to the optimum propeller that satisfies the Betz condition for lightly loaded rotors. He showed that the solution to the partial differential equation and boundary conditions, in the ultimate wake, can be mapped onto a two-dimensional problem, using the geometrical invariance of the flow along helices of same pitch as the vortex sheets. In dimensionless form the problem reads

Подпись:(10.108)

(10.109) where в is the polar angle measured from the y-axis, in cylindrical coordinates about the x-axis. ф is the perturbation potential, made dimensionless with Uu2/Q, where u2 is the induced axial velocity in the Trefftz plane. The solution in the (f, M)-plane can be expanded in terms of modified Bessel functions.

The finite difference solution on a Cartesian mesh system, Mj = (j — 1Mm, fi = (i — 1)Af, is readily obtained by relaxation with the five-point scheme for

Propellers
(10.111)

– 3фі, 1 + 4фі,2 – фі, з = 0, фі, jx = 0, і = 2,…,іх – 1 (10.112)

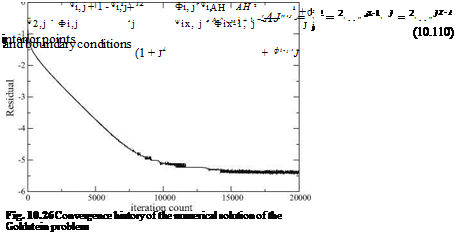
jb1 < j1 < jx, is the index that denotes the tip of the blade located at j = 1/adv. The convergence rate depends on the mesh aspect ratio Aj/AH. With a mesh of іх = 51 and jx = 201, extending to jmax = 2/adv, the convergence history for a relaxation factor rn = 0.5 is shown in Fig. 10.26. The circulation is obtained as the jump in ф across the sheet

rj = Ф1, j – фіx, j, 1 < j < j1 (10.113)

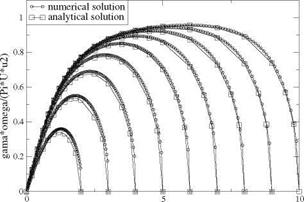
The normalized circulation ГQ/(n Uu2), for a two-bladed rotor and for a sequence of advance ratios, is compared with the analytic solution of Goldstein in Fig. 10.27.

Propellers

r/adv

Fig. 10.27 Circulation distribution—comparison with Goldstein analytic solution

Perspectives

The design of blades is still a major task for manufacturers. Aerodynamics and structures are intimately associated in this process, to account for fabrication cost, transportation/installation, maintenance and fatigue life. Steady flow modelization remains the primary preoccupation of the designers, while unsteady effects contribute to the overall system performance assessment.

The importance of unsteadiness and its modelization in wind turbine aerodynam­ics is greater than ever before, in large part due to the larger size of the blades and their greater “softness” or flexibility. Advanced designs are contemplated that incorporate blade sweep and winglets with a view to improving the performance and power cap­ture [18]. Composite materials allow for these increases in size and complexity, but also decreased stiffness. The question of fatigue has therefore become more relevant as the blades are subject to more vibrations, bending and twisting.

The vortex model has the potential of providing useful capabilities for the sim­ulation of aeroelastic phenomena. Some work has already been carried out in this direction [19]. More work needs to be done to obtain a realistic simulation tool that is cheap and reliable, and operates directly in the time domain, in contrast to the many approaches based on eigen-frequencies and eigen-modes in the frequency do­main with highly simplified aerodynamics. The hybrid method would be a natural candidate for the extension to fluid/structure interaction when viscous effects are important.

Hybrid Method

Euler and Navier-Stokes solvers employ dissipative schemes to ensure the stability of the computation, either built into the numerical scheme or added artificially as a supplemental viscosity term. The dissipative property of those schemes works well with discontinuities such as shock waves, but has an adverse effect on discontinuities such as contact discontinuities and vortex sheets. It has been known for a long time that these schemes dissipate contact discontinuities associated with the shock-tube problem and vortex sheets trailing a finite wing, helicopter rotor, propeller and wind turbine. In the case of turbine flow, the influence of the vortex sheets is rapidly lost, which has an effect on the blade working conditions by not accounting for induced velocities contributed by the lost part of the wake.

On the other hand, the vortex model described earlier can maintain the vortex sheets as far downstream as needed, but cannot handle large span-wise gradients resulting in particular from viscous effects and separation.

In the rest of this section, we will present some results of the hybrid method which consists in coupling a Navier-Stokes solver with the vortex model, the former being limited to a small region surrounding the blades where the more complex physics can be well represented, and the latter being responsible to carry the circulation to the far field and impress on the Navier-Stokes’ outer boundary the induced velocities

Hybrid MethodBiot-Savart Law (discrete)

Подпись: Navier-StokesVortex

Boundary of

Подпись:

Подпись: Convergedfor Hybrid Method

Navier-Stokes Zone

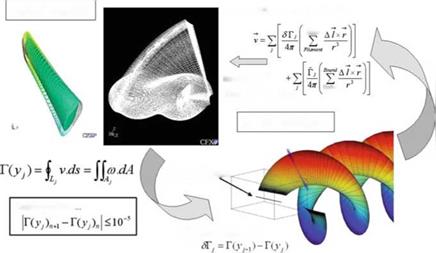
Fig. 10.21 Coupling methodology accurately calculated by the Biot-Savart law. This new approach has been found to be both more accurate and more efficient than full domain Navier-Stokes calculations, by combining the best capabilities of the two models.

The coupling procedure is described in Fig. 10.21. It consists in calculating the Navier-Stokes solution with boundary conditions that only account for incoming flow and rotating frame relative velocities at the outer boundary of the domain. The solution obtained provides, by path integration, the circulation at each vortex location along the trailing edge of the blade and the Biot-Savart law allows to update the velocity components at the outer boundary of the Navier-Stokes region by adding the wake-induced contributions. This closes the iteration loop with a new Navier – Stokes solution. It takes approximately five cycles for the circulation to be converged with ЛГ < 10-5.

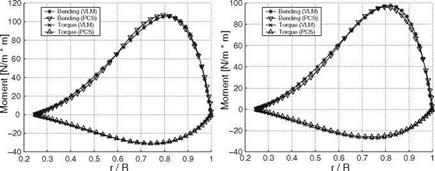
As an ideal test case for the hybrid methodology, an optimized turbine blade of a two-bladed rotor was designed with the optimization vortex code and analyzed with the coupled solver at the same design conditions for which the flow is attached and viscous effects are minimum. The results of inviscid and viscous calculations are compared with the vortex code on the global thrust, bending moment, torque and power as well as spanwise distributions in Table10.2. The global results are in excellent agreement with less than 1 % difference in power in the inviscid simulation and 7 % in the viscous one. The comparison is also excellent for torque and bending moment distributions as shown in Fig. 10.22 for inviscid and viscous cases.

The true benefit of the hybrid code resides in the simulation of the flow past a rotor when blades experience significant viscous effects that trigger large spanwise gradients. The strip theory assumption no longer holds and the flow becomes truly three-dimensional on the blade and cannot be accurately described by 2-D viscous

Table 10.2 Comparison of global results on test case

Inviscid

Inviscid

Viscous

Viscous

Vortex model

Hybrid solver

Vortex model

Hybrid solver

Thrust (N)

509.6

508.3

472.4

458.6

Tangential force (N)

183.6

179.9

163.3

150.8

Bending moment (N. m)

1803.1

1814.8

1670.2

1636.4

Torque (N. m)

588.8

583.8

519.6

485.5

Power (kW)

8.879

8.804

7.835

7.321

Hybrid Method

Fig. 10.22 Vortex model (VLM) and hybrid code (PCS) comparison: inviscid (left) and viscous (right) torque and bending moment distributions

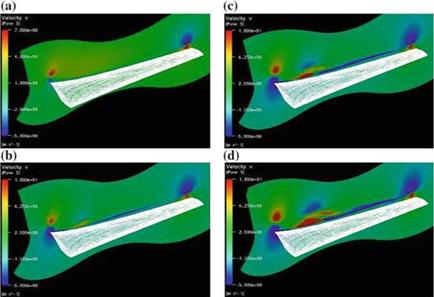
polars. The NREL test results have been a remarkable resource for evaluation of code prediction capabilities, ranging from simpler, steady, attached flow cases at low speed, to more challenging separated flows at higher speeds, as well as unsteady flow in presence of yaw and tower interaction. The hybrid method has been very successful at capturing the formation of a separation bubble on the suction side of the blade at about 9m/s, located at the 30 % blade span, that evolves into a “tornado vortex” rotating counter to the root vortex, see Fig. 10.23. The view is of the upper surface of the blade (suction side), with the blade root on the left and the blade tip on the right. At 7m/s the flow is fully attached. The cross-section by a plane perpendicular to the wake, a short distance of the trailing edge, displays the root vortex rotating clockwise and tip vortex rotating counter-clockwise, visualized with the spanwise velocity component v. As the incoming velocity increases to 9m/s, the wake of the blade, not visible before, now can be seen spanning the whole blade and a more defined structure appears at the 30 % location. The latter evolves into a strong vortex at 10 m/s whose counter-clockwise sense of rotation is opposite to that of the root vortex. At the higher speed of 11 m/s, the whole blade is stalled, yet the tornado vortex, as it has been called, has grown and has possibly produced another vortex at its lower right, rotating clockwise [17].

Hybrid Method

Fig. 10.23 Development of a well-defined viscous feature above the NREL blade

Validation

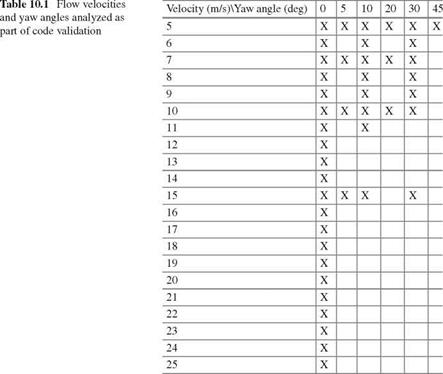
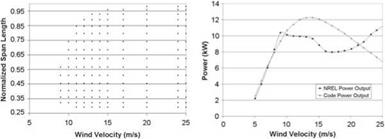
The helicoidal vortex model has been applied to a large number of cases, steady and unsteady, from the two-bladed rotor NREL S Data Sequence, in order to explore the domain of validity and assess the accuracy of this approach [16], see Table 10.1. In the experiments, the rotation speed of the turbine was held constant at 72rpm, thus velocity was the main control parameter to vary the TSR. As velocity increases and TSR decreases, stall affects a larger and larger part of the blades. In steady flow conditions (в = 0), incipient separation occurs around 8m/s and then spreads to the whole blade above 15m/s. This is shown in Fig. 10.19 where the left graph indicates with dots the points along the blade where stall occurs. The right plot shows the steady power output comparison with the experimental data.

As can be seen, the agreement with the power output is excellent until V = 8m/s, that is until there is separated flow on the blades.

Validation

Validation

Fig. 10.19 Spanwise stall and steady power output versus wind speed

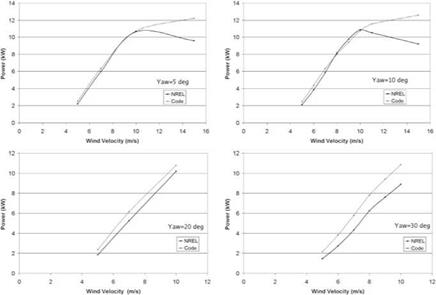
The effect of yaw on power is analyzed. The flow at yaw is periodic and the average power is calculated and compared with the average power given in the NREL data base. The results are shown in Fig. 10.20. Good results are obtained with the vortex model for yaw angles of up to в = 20°. This is consistent with the approximate treatment of the vortex sheets.

Validation

Fig. 10.20 Average power output versus wind speed at в = 5, 10, 20 and 30°