Category UNSTEADY AERODYNAMICS, AEROACOUSTICS AND AEROELASTICITY OF TURBOMACHINES

Unsteady flow results

At each blade surface node, the unsteady pressure history for two vane pass­ing periods is Fourier decomposed. Consequently, the second Fourier mode represents the vane passing frequency. For comparison with measured pres­sures, the resulting amplitudes are used, while the forced response method uses the equivalent complex components.

The resulting Fourier amplitudes at leading (white bars) and trailing edge (black bars) of the midspan profile are shown in Fig. 2. At leading edge the dominant amplitude is caused by the vane passing frequency and it’s multiples while at the trailing edge, the vortex shedding at Strouhal frequency becomes visible. The snapshot of the entropy contours of the unsteady fbw confirms that the vortex shedding is well resolved. The calculated shedding frequency is in good agreement to the expected value for a Strouhal number of 0.2 and the given trailing edge thickness.

For both scaled stage configurations, the calculated static pressures at mid span of the rotor blades are shown in comparison with experimental data in Figs. 3 and 4. The time averaged blade pressures are very similar for both numerical configurations, while in the time dependent results, some differences can be observed.

Good agreement with the measurements is observed for the first harmonic of the 42/63 configuration, except at the leading edge. Here, the numerical am­plitudes are higher than the experimental ones. The largest differences in the

Unsteady flow resultsADTurB Rotor (42-63 coring.)

hourwr Iranslorrn Black1 РМИОЯ

Подпись: nIli..0-Р-П

1000 11000 21000 31000 41000 51000

Iroquorcy [Hz;

Figure 2. Fourier modi of the static pressure at leading and trailing edge (left) and Entropy

Подпись: TtM averaged і tale prtuun at ткііра Подпись: pro&iure side Подпись: ехрвг ПЄ-І

contours ol the unsteady row held (right)

Figure 3. Time-averaged (left) and maximum pressure flictuations (right)

unsteady results occur at the blade pressure side for the second harmonic. This might be related to scaling effects. Differences in vane spacing and blade count affect the circumferential position where a particular vane wake hits the rotor. The scaling of the trailing edge changes the wake thickness. Shape and size of the wake is expected to have a larger impact on the higher harmonics. The first harmonic drives the results of the forced response analysis of the rotor. Therefore, from the good agreement with experiments for both CFD models, reasonable forced response results can be expected with little difference be­tween the two cases.

Unsteady flow results Unsteady flow results

Figure 4. Pressure flictuation at midspan of first and second harmonic of the vane passing

frequency

CFD-Method

The numerical approach is a time marching method, solving the Navier – Stokes equations with a Baldwin-Lomax turbulence model on a structured multiblock grid [8], [9]. The spatial discretization is performed with a cell centered finite volume method. The fluxes are computed with a central scheme and Jameson’s artificial viscosity [Jameson, 1991]. The time discretization is a dual time stepping method [Melson et al., 1993] with a multi stage Runge Kutta scheme. Chimera interpolation is used at the rotor stator interface (Fig. 1).

The equations are transformed to a local blade to blade coordinate system m’/ф where the stream wise coordinate is defined as m’ f £yi, with the meridional coordinate dm = s/dx2 + dr2 and ф, х,г are circumferential an­gle, axial and radial coordinate, respectively. This transformation is angle­preserving and also valid for pure radial streamsheets.

Two configurations (equivalent to 40/60 and 42/63) were generated using scaled airfoils and maintaining the axial gap. The complete computational domain in the m’/ф plane is shown in Fig. 1. Each block is discretized on a structured curvilinear H-type mesh with 64 x 192 and 48 x 192 cells for stator and rotor, respectively. The unsteady flow is calculated on three blade to blade sections at 20%, 50% and 80% span. The streamsheet thicknesses are taken from a steady through-flow calculation.

CFD-Method

Figure 1. Computational mesh and overlapping region with sliding mesh cells

Test Rig

A description of the test rig and the measurements are given in [5]. From the two measured operation points, the high-pressure ratio operation point is selected for the current study. The total pressure ratio of 2.72 causes a transonic flow through the turbine stage.

The unsteady flow measurements were performed on a rigid rotor at con­stant speed. The forced response experiments, on the other hand, were done on a rotor with flexible blades with resonant frequencies close to the vane passing frequency. This rotor was accelerated through the resonance of interest, and the blade vibration amplitudes were measured using strain gauges. The eigen – frequencies and the mode shapes were also determined in a clamped block. The measured torsional eigenfrequencies of the 64 blades for clamped condi­tions vary between -6.8% up to +1.8% with respect to the mean frequency indicating significant mistuning [5], [10].

The analysis of Seinturier [10] shows that the mean of the amplitudes of the mistuned system is only 89% of that of the equivalent tuned system.

AXIAL TURBINE BLADE VIBRATIONS INDUCED BY THE STATOR FLOW

Comparison of Calculations and Experiment

M. B. Schmitz, O. Schafer, J. Szwedowicz, T. Secall-Wimmel

ABB Turbo Systems Ltd Thermal Machinery Lab CH-5401 Baden Switzerland

michael. schmitz@ch. abb. com

T. P. Sommer

ALSTOM (Switzerland) Ltd CH-5401 Baden Switzerland

thomas. sommer@power. alstom. com

Abstract The forced excitation of the rotor blades of a single-stage turbine due to rotor – stator interaction is calculated with an in-house unsteady flaw solver and a gen­eral purpose finite element code. A scaled configuration is used in order to re­duce the amount of computational effort. The unsteady flow solution is obtained on three blade-to-blade cuts. The time dependent static pressure on the blade surface is Fourier transformed with respect to the vane passing frequency and the relevant Fourier modi of the original three blade profile cuts are interpolated to the overall blade height. This Fourier transformed flow solution is transferred to the finite element model where the blade excitation is obtained. Two reduced geometrical rotor-stator configurations are investigated and compared with re­spect to the flow field and the resulting blade excitation.

Keywords: Forced Response, Rotor-Stator Interaction, Unsteady Flow Computation

1. Introduction

Even today, with computing power available rather cheaply, an unsteady fhw simulation comprising the full annulus of merely a single stage is im­practical for routine engineering use. A reduced model is required to lower computing time to an acceptable level, allowing unsteady simulations to have

107

K. C. Hall et al. (eds.),

Unsteady Aerodynamics, Aeroacoustics and Aeroelasticity of Turbomachines, 107-118. © 2006 Springer. Printed in the Netherlands.

an impact on the design of a turbine. So called single passage methods such as the inclined time plane approach by Giles [12], the direct store method by Erdos [2], or the harmonic balance method of Dewhurst and He [1] have been developed over the last decade. However, these methods have often not made it into design codes, yet. If a single passage method is not available, the compu­tational effort can be reduced by simulating only a fraction of the full annulus. Ideally, this is achieved by dividing the number of blades for each blade row by the highest common factor. Often, as is the case for the turbine stage under investigation, it is not possible to achieve a small computational domain with an integer blade count ratio by this approach. Here, the stage consists of 43 vanes and 64 blades, rather close to a ratio of two vanes per three blades. The closest numbers of vanes and blades corresponding to exactly a ratio of two to three are 42 vanes and 63 blades, with a highest common factor of 21. For practical reasons, then, the choice was made to modify the problem from 43/64 to 42/63 and to calculate only (1/21)th of the annulus.

A modification of this kind while retaining the original blade shape would change the throat area for both vane and blade, and thus the fbw capacity, the reaction, the flow angles, and so on. In order to retain the original stage properties, the geometry has to be modified, as well. Two approaches could be taken: To restagger or reskew the airfoils, or to scale them. In the case of a restagger, the throat to pitch ratio is set to be equal to the original, and the curvature and trailing edge thickness is kept constant. The pitch to chord ratio, on the other hand is changed, as well as the inlet metal angle of the blade, and thus the incidence. With the scaling approach, the throat to pitch ratio is again set equal to the original, and the pitch to chord ratio, as well as the inlet metal angle, are retained, but the trailing edge thickness and the curvature is changed. In the present investigation, the scaling approach is used in order to minimize any incidence effect on the blade.

When the computational problem is simplified in this manner, it is clear that the unsteady flow will also change. The obvious and most important difference is that a change in vane count will also alter the vane passing frequency that each rotor blade sees. We will argue here that, at least for a case with a vane pitch that is much larger than the blade pitch, the only significant change occurs in the frequency of the disturbances. The idea behind this simplification is that disturbances such as wakes are sufficiently separated in the sense that with either original or modified vane count, there will never be two wakes inside a single blade passage. Thus it could be argued that each disturbance is seen by the blades as an independent entity.

The computed unsteady blade pressure will be applied to the mechanical blade model that represents the original geometry. The transfer of the unsteady pressure is done in Fourier space, conserving the complex amplitudes but pre­scribing the real vane passing frequency instead of that of the CFD model.
The present paper tries to answer the question if the above simplifications lead to significant errors in both the detailed unsteady fbw field and the com­puted blade response.

Other Applications

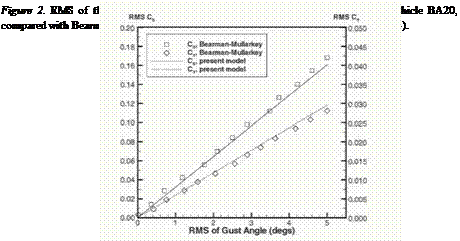
Applications to road vehicles have been attempted, and Fig. 2 showed good results for the RMS of the side force and pitching moment. As an extension

Other Applications

Other Applications

of the theory, we have tried to simulate the gust response of a SUV (Range Rover), as shown in Fig. 6.

2. Conclusions

A theory for the simulation of small perturbation potential fbws under si­nusoidal gust conditions has been derived and applied via the strip theory to

Other Applications

Figure 5. Side force admittance for a triangular plate compared with a square plate, A = 1

Other Applications

Figure 6. Gust response of a Range Rover, model shown on the right

a number of analytical and generic two-dimensional plates. The analysis was carried out in the frequency domain. An extension of the theory can be done as to include road vehicles (cars and high speed trains), and neglecting secondary effects in the third dimension. Results obtained for these bodies are reasonable and compare well with existing experimental data. The model does not allow for the simulation of yawed fbw conditions and for the effects of turbulence.

Possibilities exist to extend the theory to calculate the drag response in the frequency domain, and to treat systems with more than one degree-of-freedom.

Analytical Solutions

A number of closed-form solutions of Eq. 3 are possible. We will consider here only the case of the squared and the triangular plate. We leave to the reader the integration of other simple geometrical forms.

A solution for the squared plate is given by Eq. 4. Fig. 4 shows the map of the admittance in the imaginary plane for different gust speed ratios for a squared figure. With increasing A the system tends tends asymptotically to a closed loop. The range of the reduced frequency is k = 1 — 10.

The case of the circular plate is somewhat more complicated, since the ad­mittance contains trigonometric functions in implicit form. Therefore this case was solved using a numerical method, as described in Filippone, 2003.

For a generic triangular plate with a sweep angle a and height h, the geo­metrical functions are:

ф) = 2^1-2^, <^(~)=8M. (18)

Therefore, the admittance becomes

1 Г h/2

Подпись:Подпись: (20)H = – r(z)H[r(z)k] е~акф) dz.

h – h/2

z

By operating a change of variables z = – j—- we hnd

2 f 2(1 – Z1)HX [2к(I – Ы)] e~iXk4^dz.

Therefore, H does not depend on the sweep angle. Similar conclusion is found for the pitching moment. We plotted the admittance for the triangular plate at A = 1 in Fig. 5 and we compared with the admittance of squared plate Hi (k) for frequencies up to k = 10. The oscillations of the admittance have smaller amplitude and show no critical damping.

Critical Damping

Critical damping occurs when the system’s response decays to a very small number: At a certain frequency the system is able to dissipate all the energy from the external forcing. MacDonald, 1975, defines the critical damping as 1% of the steady state load response.

It is generally suggested that the decreasing admittance with the increasing frequency is due to the fact that the smaller turbulent eddies have a higher frequency, e. g. shorter wavelengths. However, we prove that this is also the

Critical Damping

case for a laminar inviscidflow. A number of other events seem to occur. Past a critical damping frequency the transfer function increases again, and may reach several other minima. We have found no experimental data to substantiate this conclusion.

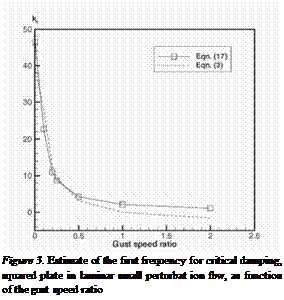
The existence of critical damping in this model is associated to a combi­nation of increasingly oscillatory Bessel functions. The first critical damping frequencies are kc ~ 5.13 for the circular plate and kc ~ 2.13 for the square plate, both with a gust speed ratio A = 1.

This result shows that the square plate is more effective in reducing the re­sponse from an unsteady forcing. For non-analytical bodies, critical frequen­cies may not exist.

With the assumption of small perturbations, critical damping will be associ­ated to a pressure wave of wavelength equal to the gust wavelength. When the latter one is a multiple of the plate’s chord, also the pressure distribution will have the same wavelength (with a time lag). When the gust wavelength Ag is equal to the chord c = 2b the following relationships hold:

Подпись: (16)

Critical Damping

cub ос 2тт/с it f Xg ttfVg Vg 1-А

V = zv = 2V = v = У7 = nV = 71 A

having assumed that the gust wavelength is related to its frequency by Ag = Vg /f. If there are n wavelength over the chord of the plate, the critical fre­quency is estimated from

Critical Damping
Подпись: (17)

If we plot the calculated data from Eq. 3 and the estimate, Eq. 16, we find a similar trend, although the values are not quite right, Fig. 3.

Bearman’s experiments (Bearman, 1971a), and Vickery’s theoretical corre­lations (Vickery, 1965) both refer to plates in normal turbulent fbw. These authors seem to imply that critical damping does exist in normal few condi­tions, at frequencies that are not discordant with the present ones (k < 10).

One key point evidenced by the experiments of Bearman et al. in turbu­lent ft>w is the fact that the admittance does not tend to one at the very long wavelengths.

Side Force and Yawing Moment Coefficients

Подпись: CS2 = Подпись: 2П2 Pg Подпись: 0 Side Force and Yawing Moment Coefficients Подпись: 2 Подпись: (14)

A further development of the theory leads to an explicit expression for the side force coefficient:

where H(k) is the magnitude of the transfer function H(k); pg = Lref/2b is the gust parameter; w/V is the gust amplitude; f (k, ko) is an oscillatory function quickly damped on both sides of the frequency ko. Finally,

,/ X 1 frr s, s 1 /sin(wo(2T – T)) – sin(woT) ф(т) = W(.T- T)coS(Mlr) – — — J (15)

is the gust auto-correlation function evaluated at t = 0. In Eq. 15, T is the time needed by the gust to travel the reference length with the speed V; и o is the frequency associated to ko.

The integral term in Eq. 14 depends on the admittance over the whole spec­trum of frequencies and on the reference frequency k0. The integral is a con­stant with respect to the gust amplitude. Hence fcs* varies linearly with the

root mean square gust angle V^2 This linear dependence is also valid for the yawing moment coefficient, CY. In the latter case, replace the admittance for the moment, Eq. 11, into Eq. 14 to obtain the coefficient of proportionality. Results from this theory are compared in Fig. 2 with the experimental data of Bearman & Mullarkey for the road vehicle BA20 (scant angle 20 degrees). The figure shows both the side force coefficient CY and the pitching moment coefficient CS as a function of the RMS of the gust angle. The correlation is quite satisfactory.

Admittance for the Moment

The yawing moment can be calculated around any axis a (Filippone and Siquier, 2003), and is written as:

#AMW= (a + 0 [МЩ – iJl(k)]C(k)

i 1 — A

– — (A + 2a)Ji(Afe)-— J2(Xk) (11)

Подпись: Hf (k) Подпись: A- 1 2A Подпись: J2( Ak) — iJ1 (Ak) Подпись: (12)

where J2 is a Bessel function of order 2. A number of simplifications can be made from Eq. 11. First, consider a body pitching or yawing around an axis a = -1/2. In this case, Eq. 11 can be simplified in at least two cases: If a = -1/2, then

Подпись: If A1 (stationary gust), then

Hjf=i(k) = (a+^Hx=1(k). (13)

Therefore, the admittance for the yawing moment is proportional to the admit­tance for the side force, and the two functions are in phase at all frequencies.

The latter equation can be normalized so as to have a unit value at k ~ 1. Also note that if a = -1/2 then the body is neutral at all frequencies with respect to the pitching moment.

Properties of the Admittance

Eq. 4 is the basic transfer function for the infinite lifting surface. Eq. 3 is an integral form of H (k) obtained from the concept of strip theory; H (k) must be calculated only once, and can be used for an arbitrary body. The strip theory is based on the assumption that the downwash velocity at one spanwise location does not affect the downwash at a nearby position. It is evident that

lim H (k) = 1, (10)

k^0

which is coherent with the definition of admittance, Eq. 1. There exist val­ues of the gust speed ratio that yield values of the admittance larger than the unity, though H (k) is always finite. When the forcing frequency is signifi­cantly lower that the natural frequency of the aerodynamic system, the transfer function is equal to unity.

Eq. 3 shows that at a given frequency the admittance is inversely propor­tional to the profile width. The leading edge is invariant to yawing or stretch­ing. This can also be inferred from the transfer function.

Integration of the equations is generally done numerically, but for a limited number of cases there exist closed-form solutions.