Category BASIC AERODYNAMICS

Leading-Edge Vortex Flap

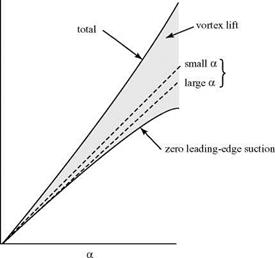
As noted previously, the delta wing is a planform, that was developed for supersonic flight, but it also must operate at subsonic speeds. At high angle of attack, the wing lift is increased by virtue of vortex lift (see Fig. 6.28), but the wing drag also increases with increasing vortex lift. This is because the presence of a separation vortex at the wing leading edge effectively rotates the leading-edge suction through 90° (see Fig. 6.30c). This means that there is no longer a leading-edge suction to supply thrust and alleviate some of the drag.

The L/D ratio is a measure of the aerodynamic efficiency of a wing. Although vortex lift increases CL, the simultaneous increase in CD can result in the effective wing L/D ratio being lower. This reduced L/D may have a major impact on perform­ance parameters such as takeoff and climb, where the L/D ratio has an important role.

The leading-edge vortex flap (LEVF) is a device that improves L/D for a delta wing at a high angle of attack at some penalty in lift. The LEVF is a small deflecting surface mounted at the leading edge of a delta wing, as shown in Fig. 6.33.

When the LEVF is deflected downward, the leading-edge separation acts on the flap surface and a thrust component is generated (compare Figs. 6.30c and 6.33). Thus, wing drag is decreased (i. e., thrust is increased) at the cost of a decrease in vortex lift. At very high values of CL, the vortex on the flap moves downstream and the full suction force F in Fig. 6.33 is not recovered. The experimental results in the paper by Rinoie and Stollery, 1994, indicate that at low speed, a 60° delta wing with sharp leading and trailing edges has a dramatic (i. e., 40%) improvement in L/D at CL = 0.45 with a vortex flap deflection of 30°.

Polhamus Method

The Polhamus method assumes that the lift on a delta wing consists of two parts: potential flow lift and vortex lift. The potential flow lift is calculated by assuming that there is no leading-edge suction developed at the leading edge of the delta wing because the streamlines pass smoothly around the leading-edge separation bubble, as shown in Fig. 6.30c. It is further assumed that the flow reattaches on the upper surface of the wing after passing around the separation vortex. Thus, the flow model assumes that the potential flow lift is decreased only by the loss of the leading-edge suction force. Lifting-surface theory may be used to calculate the potential flow lift.

As noted previously, the vortex-lift method of Polhamus does not attempt to model flow details. Rather, it recognizes that there must be a force on the wing arising from the pressure required to keep the centrifugal force in equilibrium as the flow passes around the separation vortex. It is assumed that this force is of the same magnitude as the leading-edge-suction force required to sustain attached flow around a large leading-edge radius (see Fig. 6.30b). The difference is that the force due to separation acts primarily on the upper surface (see Fig. 6.30c) rather than on the wing leading edge (see Fig 6.30b). In effect, the leading-edge-suction force is assumed to rotate 90° and become perpendicular to the wing-chord plane. The result is that there is a normal force exerted on the wing (force F in Fig. 6.30c) that adds to wing lift.

According to the Polhamus model, the lift on a delta wing becomes:

CL = (potential flow lift) + (vortex lift)

or

CL = KP sin a cos2 a + Kv cos a sin2 a (6.73)

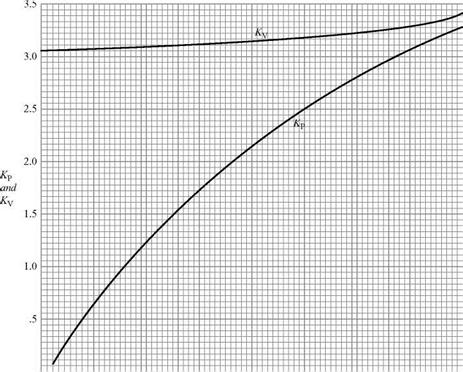
where KP and Kv are constants that can be found from lifting-surface theory and a is the angle of attack of the delta wing. The constants for a delta wing in incompress­ible flow are shown in Fig. 6.31 as a function of the AR of a delta wing at a very low speed.

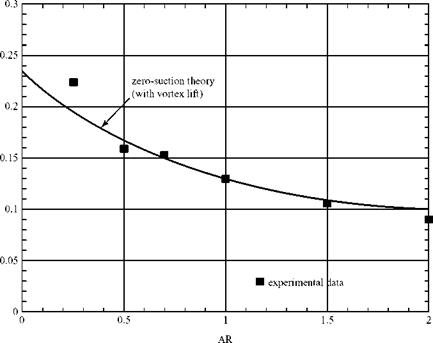
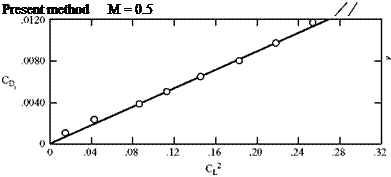
The loss of leading-edge-suction force due to the presence of the separation vortex results in a drag penalty. The same simple approach also can be used to pre­dict the inviscid drag due to lift of a sharp-edged delta wing at low speeds with vortex lift and zero leading-edge suction (Polhamus, 1968). Namely:

Polhamus Method

0

0 .5 1.0 1.5 2.0 2.5 3.0 3.5 4.0

Figure 6.31. Values of KP and Kv for a delta wing at M = 0 (Polhamus, 1968).

where DLift is the drag due to lift (not written as because it is not associated with a trailing-vortex sheet).

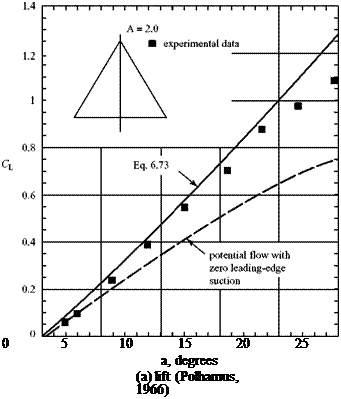
This theory (i. e., Polhamus) predicts results with excellent agreement with experimental data up to large angles of attack (Fig. 6.32). The theory describes the behavior of a delta wing to very large angles of attack. Ultimately, at an angle of attack that depends on the AR of the delta wing; the theory begins to over-predict the lift on the wing as the measured lift begins to drop off. At this angle of attack, the spiral vortex has started to break down (i. e., the vortex begins to experience what is called vortex burst). The vortex breakdown proceeds from the trailing edge of the wing to the front. At some point, the vortex completely breaks down, the upper sur­face of the wing is a turbulent separated region, and the delta wing experiences stall.

The leading-edge-suction analogy described previously was extended to predict the behavior of arrow – and diamond-wing planforms. Charts for evaluating KP and Kv needed to calculate the potential flow and vortex-lift terms for these planforms are in work by Polhamus, 1971. A subsonic-compressibility procedure is included as well.

The previous discussion applied only to steady flight. Vortex lift also is impor­tant in fighter operations at high subsonic speed when a high value of lift is desired for maneuvering and control, which corresponds to a time-dependent problem. During maneuvers, the spiral vortex from the leading edge changes strength with time and the location of the vortex-bursting is time-dependent. The unsteady vortex – lift problem is discussed in Nelson, 1991.

Polhamus Method

CD Lift


Polhamus Method

Polhamus Method

Vortex Lift

Previous discussions regarding the effects of viscosity on the behavior of two­dimensional airfoils and finite wings of conventional planform emphasized that operating these devices above moderate angles of attack results in flow separation at or near the leading edge, with a resulting catastrophic loss of lift. A delta wing with sharp leading edges, when operated at relatively small angles of attack, exhibits separated flow over the upper surface without a loss of lift until a very large angle of attack has been reached. This behavior is explained by the generation of vortex lift. Steady-flow vortex lift is discussed in this section.

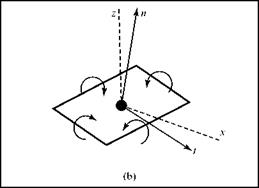
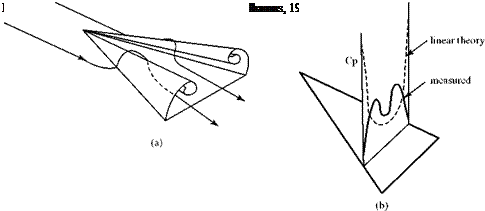
A delta-wing planform is attractive for supersonic flight because it has a small wave drag. However, it still must operate at subsonic speeds, particularly on takeoff and landing. If the delta wing has a sharp leading edge (desirable for supersonic flight), then at subsonic speeds and at small angles of attack, the flow separates at the leading edge and forms two large and dominant spiral vortices, shown in Fig. 6.28a with strong axial convection along the vortex core. These two spiral vortices alter the pressure distribution on the upper surface of the delta wing, causing a large suction pressure to be established on the wing surface almost directly beneath the centers of the spiral vortices, as shown in Fig. 6.28b.

These large suction pressures on the wing upper surface furnish a so-called vortex lift, which at large angles of attack provides a significant increment to the potential flow (i. e., no separation) lift on the delta wing (Fig. 6.29). The spiral vortex

Vortex LiftVortex Lift
Figure 6.29. Behavior of delta wing at angle of attack. (Polhamus, 1966).

is sensitive to the geometry of the wing leading edge. For example, if the leading edge is rounded, the vortex-lift effect is reduced.

It is a challenging problem to model the details of the spiral vortices. However, a method was developed by Polhamus, 1966, which treats the vortices by an analogy and provides a surprisingly accurate prediction of the vortex lift and the associated drag due to lift. The analogy lies in the treatment of the leading-edge suction on a delta wing. Recall that leading-edge suction was introduced in the discussion of flat – plate airfoils in Chapter 5. When a near-zero-thickness airfoil is at an angle of attack, as shown in Fig. 6.30a, the flow upstream of the stagnation streamline reverses and flows around the sharp leading edge, causing a large suction as the streamline traverses a near-zero radius in inviscid flow. In a viscous fluid, the flow around the leading edge separates, as shown in Fig. 6.30b, and the streamlines upstream of the stagnation point behave as if they were flowing around a very blunt leading edge in an inviscid flow, as shown in Fig. 6.30c.

Vortex Lift

Vortex Lift

(c) separated viscous flow with sharp leading edge


Vortex Lift

(b) inviscid flow with large

(a) inviscid flow with sharp edge leading-edge radius

Figure 6.30. Flow around a leading edge (Polhamus, 1966).


Winglets

After examining results from the Program PRANDTL, it is desirable to make the AR of a wing as large as possible. However, there are practical limitations to increasing the wing span and, hence, the AR. The larger the span, the greater the length of the cantilever beam represented by the half-wing and the greater the struc­tural problems. Also, a large wing span makes ground-maneuvering and parking of the aircraft difficult.

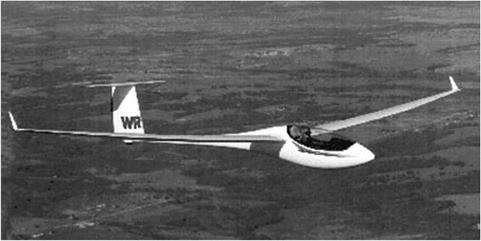
Aircraft of all types have been designed with winglets instead of increased span. For example, Fig. 6.27 shows a modern sailpane with winglets. In this application, the benefit comes without increased span. (Span is limited by international competi­tion rules; the glider shown is a 15-meter-span “standard class” racing machine.) The glide ratio is increased by at least one L/D point, from 42 to about 43, by this modifi­cation. The equivalence of glide and L/D ratios is explained in Chapter 1.

Winglets increasingly are used in commercial aviation because the improve­ment in effective AR leads directly to reduced operational costs. The benefits result from the influence that the winglets have on the behavior of the tip vortices and the interaction of these vortices with the wing flow field. Thus, they originally were called vortex diffusers by the inventor, Richard Whitcomb of NASA (Whitcomb, 1976, Flechner, etal, 1976). There is evidence that the basic concept already was known before manned flight actually was accomplished, but Whitcomb receives the credit for the winglet in its modern form.

The winglet is a miniature wing of precise shape that is set nearly vertically at the tip of the main wing, with the winglet leading edge inboard of the trailing edge. The corner is carefully faired. The winglet reduces drag in two ways as follows:

1. The relative wind at the winglet, which is the vector sum of the oncoming stream and the flow around the wing tip, acts on the winglet so as to produce a force component in the negative drag (i. e., thrust) direction.

2. The presence of the winglet distorts the shape of the wing-tip vortex and modi­fies the strength of the trailing-vortex sheet.

Winglets

Figure 6.27. Schleicher ASW-24B with winglets.

Winglet design currently is accomplished by means of numerical programs such as the panel methods discussed in the previous sections. As always, we must con­sider the tradeoff between reduced induced drag and additional form drag resulting from the increased surface area. The numerical results then are verified by careful wind-tunnel testing, and an iterative process leads to the best compromise between performance needs across the operational speed range of the aircraft.

Ground Effect

When a finite wing (and airplane) operates near the ground within a distance of approximately 20 percent of the wing span, as in landing or takeoff, the wing behavior is modified from that observed in an unrestricted freestream. This is called ground effect, and it may be explained by referring to the wing-lifting-line model.

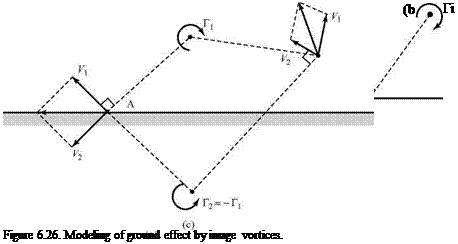
Let a lifting wing be represented by a horseshoe vortex, as shown in Fig. 6.26a. For simplicity, we consider a vertical plane that encloses one trailing-tip vortex and let the plane be sufficiently far downstream so that the flow in the plane may be assumed as two-dimensional. If a solid surface is inserted below the trailing vortex as in Fig. 6.26b, the boundary condition to be satisfied is that the flow must be tangent to that surface. However, the trailing vortex induces a vertical-velocity component at the surface and the boundary condition is not satisfied. This means that the flow physically must adjust to be tangent to the surface; however, a single vortex is too simple a model to satisfy this requirement. This problem must be resolved by intro­ducing an image vortex at the same distance below the surface as the trailing vortex
is above. The image vortex has the same strength as the trailing vortex but the oppo­site sense, as shown in Fig. 6.26c.

At any Point A on the surface, the superposing of the induced velocity V1 due to the trailing vortex Г j with the velocity V2 due to the image vortex results in a cancel­lation of the vertical-velocity component at the surface, and the tangency-boundary condition thereby is satisfied. Notice, however, that the velocity at any Point B within the flow field is modified by the presence of the image vortex so that the velocity at Point B is not identical to what it would be in an unconfined flow.

Ground Effect
Now, visualize this picture extended into three dimensions, with the lifting wing close to a surface being represented by a lifting line and a trailing-vortex sheet. A mechanism still must be present to satisfy the tangency-boundary condition at the ground plane. The required image-vortex sheet modifies the unconfined flow; in particular, it significantly modifies the downwash at the lifting line.

The effect of the image-vortex sheet is that the downwash at the wing is consider­ably reduced and the wing lift-curve slope is increased. Because the downwash (and induced angle of attack) is decreased, the induced drag also is reduced. The net effect on the aircraft of the increase in lift (at the same angle of attack) and decrease in drag is that just before touchdown, the aircraft briefly seems to be buoyed up and floating. During the interaction, the aircraft is said to “flare,” or manifest ground effect. Some­times the flare maneuver is supplemented by an increase in the angle of attack that can exceed the stalling angle at altitude. This allows touchdown at the lowest possible speed so that landing loads are minimized and rollout thereby is shortened.

The concept of using image vortices to represent the effect of a solid wall may be used to correct for the effect of the solid wall in a wind-tunnel test section. When an overly large model is tested, the requirement that the flow be tangent to the solid wall induces significant changes in the flow field compared to that of flight in the atmosphere in which the flow is not so constrained. By representing the effect of the wind-tunnel walls with image vortices, the effect of the solid wall on the measured data can be estimated and the data corrected accordingly.

Aerodynamic Strip Theory

Thus far, we examine rapid-solution methods using panels and we see that we can quickly obtain a good estimate of the overall inviscid performance (i. e., lift coeffi­cient, induced-drag coefficient, and moment coefficient) of any candidate wing. We

can even obtain rather good spanwise information regarding the variation of sev­eral quantities, such as induced angle of attack and downwash. However, chordwise information is limited. In the wing-panel methods, we obtain information only at a few chordwise stations corresponding to locations of the singularities; in lifting-line theory, there is no chordwise information at all. As discussed in Chapter 8, such information is necessary to determine the effects of the boundary layer to compute the viscous drag. Chapter 8 also points out that the local surface-pressure gradient has a key role in the behavior of the boundary layer and that it should be known accurately. Thus, we discuss here a relatively fast method of supplementing the information from a panel method, or even from lifting-line theory, to obtain such detailed information. Using the effective angle-of-attack information from either a three-dimensional panel code or lifting-line theory, aerodynamic strip theory describes the chordwise pressure distribution on a three-dimensional wing by com­puting the chordwise pressure distribution at separate spanwise stations. Because this approach necessarily neglects spanwise flow, the method works best on high AR wings or wings with little sweep. Notice that the three-dimensional effect is not com­pletely eliminated because we use an effective angle of attack that was determined by accounting for three-dimensional effects.

Virtually any three-dimensional panel method combined with any airfoil pressure-distribution method can be used in this strip-theory approach. Here, we demonstrate the idea by using the VLM and the AIRFOIL codes introduced previ­ously. The basic steps are as follows:

1. Use a three-dimensional panel code (e. g.,VLM) to compute the spanwise distri­bution of effective angle of attack, aeff, for a given wing. Recall from Eq. 6.13 that aeff = a – a;.

2. At selected spanwise stations, use the local wing-section information and the effective angle of attack to determine the section-pressure distribution

(i. e., airfoil).

Consider a straight-tapered wing with an AR of 6.4 and a taper ratio of 0.4; use the NACA 0012 airfoil as the wing section. Let the wing have a geometric angle of attack of 5° at the plane of symmetry and a linear twist (i. e., root to tip) of 3°. Using the VLM program illustrated previously, with 11 spanwise stations and 7 chordwise stations, the following results are obtained:

Spanwise Station, 2y/b aeff

0.0455

3.477

0.1364

3.420

0.2273

3.352

0.3182

3.255

0.4091

3.136

0.5000

2.996

0.5909

2.835

0.6818

2.651

0.7727

2.439

0.8636

2.247

0.9545

1.177

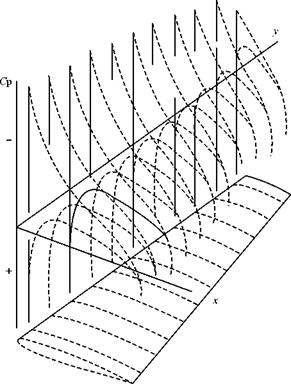
Подпись: Figure 6.25. Cp distribution over semi-span of a finite wing using strip theory.
Aerodynamic Strip Theory

For each spanwise station, the effective angle of attack is used in Program AIRFOIL, along with the section information, to obtain a detailed surface-pressure distribution at the station. The result is shown in Figure 6.25. Shown in the figure are the detailed pressure distributions from the Program AIRFOIL for each of the 11 spanwise stations used by the VLM program. The figure was generated by reading the 11 Cp data files generated by the Program AIRFOIL and making a plot of the wing and the Cp distributions. The Cp data files also would be used by a boundary – layer program to compute the viscous drag over the wing (see Chapter 8).

Comments on Wing-Analysis Methods

Lifting-line theory provides a simple and accurate method for determining the span – wise variation of properties (e. g., spanwise loading) for wings of large AR with zero or small sweep angle. A numerical scheme may be set up to calculate the Fourier – series coefficients required for the solution if we desire. Such schemes also can keep track of the relative size of the coefficients so that the Fourier series may be trun­cated as desired.

In industry today, the VPM and the VLM are used extensively for predicting behavior at cruise, as long as there are no large boundary-layer separation effects. Either method may be used with a fuselage panel code (see Chapter 7). An inviscid solution for cruise provides spanwise wing-loading and induced drag. Then, a skin – friction estimate may be added or a viscous boundary-layer solution may be patched onto the inviscid-flow solution to account for the viscous effects. This boundary – layer solution can be made interactive (i. e., displacement effect due to the presence of the boundary layer accounted for as a modification of the wing section) or nonin­teractive (i. e., inviscid flow and viscous boundary layer treated separately).

To model a viscous flow around a wing completely and correctly, the Navier – Stokes Equations (see Chapter 8) must be solved by CFD methods. The complexity of the equations and the uncertainty of how to treat the appearance of turbulence in the boundary-layer equations render such an approach of marginal cost benefit to industry at this writing. However, CFD methods are used extensively in research and, as the methods become more advanced and computers get faster, CFD methods will soon become routine. Currently, the panel methods discussed in this chapter constitute important tools for predicting the behavior of wings.

The availability of all of the various computer-solution methods makes new demands on the physical insight of designers. They must understand the physics of a particular flow problem and the accuracy of the required results so that a com­puter code can be selected (or written) that will be as simple and fast as possible while incorporating all of the phenomena of importance. Unfortunately, it is not yet possible to write a simple code to include everything. Tradeoffs must be made. If this task is performed properly, a solution is forthcoming that provides the necessary information with suitable accuracy. For example, simple, low-order panel codes are inexpensive to run and are valuable for parametric studies. Flow problems involving wings at high angle of attack or wings with high-lift devices—both of which have large separated boundary-layer regions—must be solved by CFD methods with the assistance of suitable wind-tunnel tests.

Vortex-Lattice Method

In the VLM, the finite wing again is represented by N flat panels as defined by a preliminary grid generation. In the following discussion, it is assumed that thick­ness effects are negligible. What follows, then, is a so-called lifting-surface theory, although the VLM may be applied to wings with nonzero thickness. The wing is represented by a camber surface and the tangency-boundary condition is applied on the camber surface rather than on the wing surface. The wing may have arbi­trary camber and planform. The angle of attack is assumed to be small; there­fore, this inviscid theory describes a thin wing with negligibly small regions of separation.

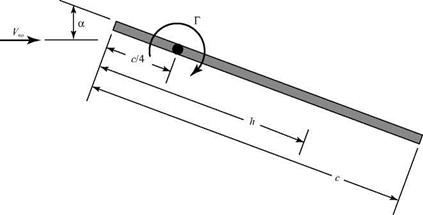
Again, vortex singularities are distributed over a surface. However, in contrast to the VPM described herein, in the VLM discussion, each panel is assigned a horse­shoe vortex rather than a vortex ring. The placement of the transverse element of the horseshoe vortex and the control point is suggested by the following: Consider a wing panel as a flat plate in an effectively two-dimensional flow. Such a flat plate of chord c is shown at the angle of attack in Fig. 6.22.

Vortex-Lattice Method

Vortex-Lattice Method

Vortex-Lattice Method

Fig. 6.21. Panel-code prediction for section of finite wing at mid-span compared with experimental results for a two-dimensional NACA 4412 airfoil (Bangasser, 1993).


Vortex-Lattice Method Подпись: (6.64)

Represent the lift on this plate by a combined vortex of strength Г located at c/4, which is the center of pressure for an airfoil according to thin-airfoil theory. From the Biot-Savart Law, at some distance, h, along the plate, the vortex induces a velocity V=r/2nh. Now, we recall from Eq. 5.14 that the circulation around a two-dimensional flat-plate airfoil is given by Г = nmVTC. Finally, the tangency-boundary condition (i. e., no flow through the surface) requires that V must be equal and opposite to a component of freestream velocity given by VM(sin a) = V^a. Appealing to tangency:

or, solving for h:

Vortex-Lattice Method

Figure. 6.22. Two-dimensional flat plate at the angle of attack.

Thus, with the transverse-bound vortex on a panel at c/4, the tangency-boundary condition is satisfied at one point, c/4 + h = 3c/4. We choose to locate the control point on each panel at this location and we apply the tangency-boundary condition at this control point. If the wing leading edge is swept, the bound vortex is skewed at the sweep angle relative to the у-axis. The bound vortices have different (i. e., unknown) strengths that vary in both a spanwise and chordwise direction.

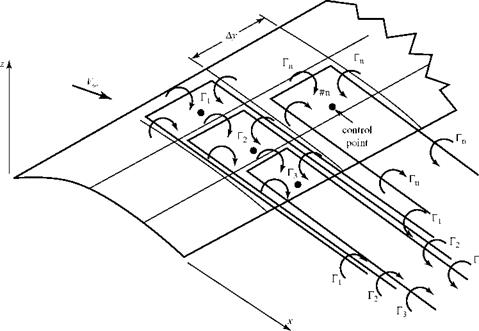
Two free-vortex filaments always trail downstream from the ends of the trans­verse element on the panel (Fig. 6.23). Each pair of (free) trailing-vortex ele­ments must have the same strength as the bound vortex from which it originates (i. e., Helmholtz). The free-vortex elements cannot support any pressure difference, so they must trail off of the bound vortex and away from the wing in a direction parallel to the local streamlines; that is, they must follow a curved path. However, because the wing angle of attack is small the free vortices may be assumed to follow a straight line at the freestream or another convenient direction. If desired, the trailing vortices may be divided into straight-line segments so as to better model the physical reality and, if desired, may follow the wing surface until the trailing edge is reached. As in the lifting-line theory, the influence of the starting vortex portion of each horseshoe at the wing is ignored as being negligible.

Carefully compare Figs. 6.20 and 6.23 to understand better the difference between the vortex-panel and the vortex-lattice formulation of the finite-wing problem. In particular, contrast the modeling of the trailing vortices. In the VPM, the trailing-vortex pairs behind the wing have the same strength as the bound vortex on the trailing-edge panel from which they originated. In the VLM, the trailing-vortex pairs have the same strength as the bound vortex on the individual chordwise panel from which they originated.

A control point is located at the three-quarter chord of each panel and the Biot-Savart Law is used to calculate the velocity induced at each control point by all of the other horseshoe vortices. The bound vortex located on the panel that contains the particular control point in question contributes to the induced velocity at that control point because the point of interest and the bound vortex do not coincide, as in the lifting-line theory. Thus, each horseshoe vortex contributes three velocity

Vortex-Lattice Method

Figure 6.23. VLM.

components at each control point, and the induced velocities may be computed by using Eq. 6.2. The induced-velocity components are normal to a plane containing the control point and the vortex element, so that all of the induced velocities finally may be assembled into the resultant velocity, Vp, which is perpendicular to the panel in question. Thus, the resultant normal velocity, induced at any panel, s, due to all of the horseshoe vortices located on that panel and on every other panel is given by:

N 3

4 = Vi| )sn. m (<5.66)

n=1m=1

where each horseshoe vortex makes three contributions; one due to the bound vortex and two due to the free vortices.

The resultant induced velocity at each panel control point must be equal and opposite to the normal component of freestream velocity at each control point if the tangency-boundary condition (i. e., no flowthrough) is to be satisfied. The result is a set of N simultaneous linear-algebraic equations, where N is the number of panels. There is only one unknown vortex strength associated with each panel because the free vortices trailing from each panel have the same strength as the bound vortex associated with that panel. The array of N simultaneous equations then can be solved for the N unknown values of Г.

As in the VPM there is significant geometry for the computer code to handle; however a general code may be written to describe the location of the control points and the horseshoe vortices, and the calculations are repetitive. With the bound-vortex

strength at each panel now known, and the effect of the wake accounted for through the influence of the trailing-vortex filaments, the chordwise and spanwise lift distri­bution on the wing may be calculated, as well as the total wing lift.

In particular, as shown in Fig. 6.23, the lift contribution of bound Vortex 1, is given by:


Vortex-Lattice Method

Vortex-Lattice Method

Under this assumption, the wake-vortex sheet has a small pressure difference across it (not physically correct because the sheet does not have the correct physical shape). However, under this assumption, the wake sheet contributes zero drag because the wake vorticity is parallel to the freestream. In this case, the induced drag of the wing from which the wake originates can be evaluated by integration of the wake properties in the two-dimensional flow occurring in a cross plane far downstream of the wing and perpendicular to the wake sheet. This plane is called the Trefftz plane.

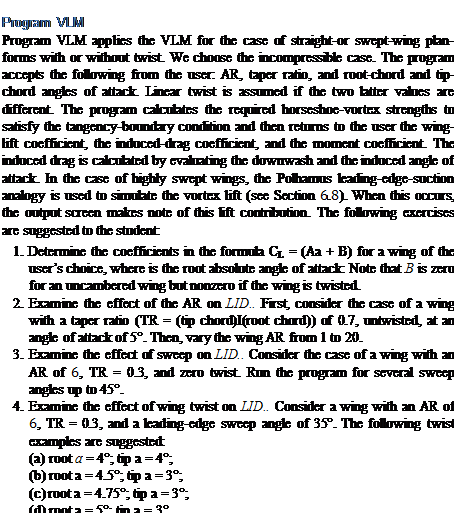
Подпись: Program VLM Program VLM applies the VLM for the case of straight-or swept-wing plan- forms with or without twist. We choose the incompressible case. The program accepts the following from the user: AR, taper ratio, and root-chord and tip- chord angles of attack. Linear twist is assumed if the two latter values are different. The program calculates the required horseshoe-vortex strengths to satisfy the tangency-boundary condition and then returns to the user the wing- lift coefficient, the induced-drag coefficient, and the moment coefficient. The induced drag is calculated by evaluating the downwash and the induced angle of attack. In the case of highly swept wings, the Polhamus leading-edge-suction analogy is used to simulate the vortex lift (see Section 6.8). When this occurs, the output screen makes note of this lift contribution. The following exercises are suggested to the student: 1. Determine the coefficients in the formula CL = (Aa + B) for a wing of the user’s choice, where is the root absolute angle of attack: Note that B is zero for an uncambered wing but nonzero if the wing is twisted. 2. Examine the effect of the AR on LID.. First, consider the case of a wing with a taper ratio (TR = (tip chord)I(root chord)) of 0.7, untwisted, at an angle of attack of 5°. Then, vary the wing AR from 1 to 20. 3. Examine the effect of sweep on LID.. Consider the case of a wing with an AR of 6, TR = 0.3, and zero twist. Run the program for several sweep angles up to 45°. 4. Examine the effect of wing twist on LID.. Consider a wing with an AR of 6, TR = 0.3, and a leading-edge sweep angle of 35°. The following twist examples are suggested: (a) root a = 4°; tip a = 4°; (b) root a = 4.5°; tip a = 3°; (c) root a = 4.75°; tip a = 3°; (d) root a = 5°; tip a = 3°.

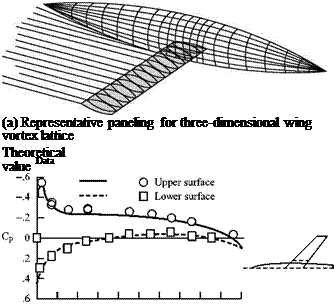
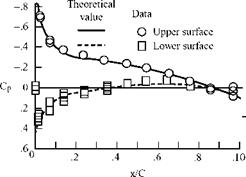
A detailed numerical example of the VLM as applied to a swept wing with zero thickness and camber (i. e., a flat plate) is in Thomas, 1976. Close study of this example is of great assistance if the student must write a VLM program. Results of the VLM as applied to a rectangular wing and a comparison with experiment, are shown in Fig. 6.24. In this figure, the wing is not taken to be of zero thickness, as discussed, but rather is modeled by a combination of sources and vortex lattices. The predicted surface-pressure distribution on the wing at two spanwise stations and the predicted induced drag of the wing shows excellent agreement when compared with experi­mental data.

Vortex-Lattice Method

Vortex-Lattice MethodVortex-Lattice MethodVortex-Lattice Method

Vortex-Lattice Method

(b) Source and vortex-lattice pressure
coefficients on a wing

(c) Induced drag for Lockheed ATT-95 aircraft

Figure 6.24. VLM compared with experimental data (Thomas, 1976).

The panel methods described herein are valid only for inviscid, incompressible flow. Furthermore, the solutions are found only on the wing or camber surface. If flow details away from the wing are desired within these two assumptions, then the methods can be extended to compute the flow induced by the flow singularities and the freestream.

Vortex Panel Method

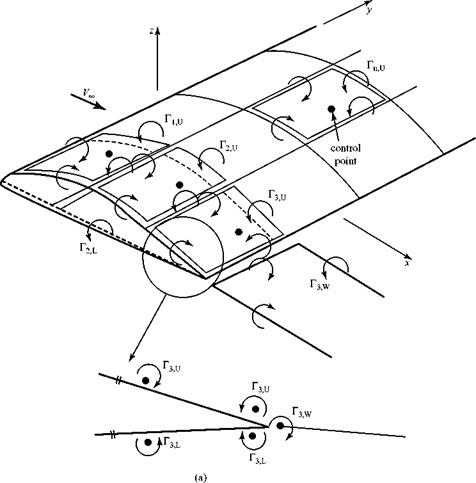
The wing top and bottom surfaces are divided into N flat quadrilateral panels. Each panel is assigned a closed vortex ring consisting of four vortex elements, each of strength Гп, as shown in Fig. 6.20a. The magnitude of the unknown rn’s is evaluated during the numerical solution. The Helmholtz theorem demands that each vortex ring be of constant strength along the length. The four sides of each vortex ring are placed just inside the four sides of the associated panels. The control point, or collo­cation point (i. e., the point on the panel where the tangency-boundary condition is to be applied), is located along the three-quarter chord line at the mid-span of the panel.

Regarding the Kutta condition, in general, the strengths of the transverse vortices at the wing trailing edge (e. g., the downstream elements in Fig. 6.20) are unequal and nonzero. Thus, |г3U| Ф |r3 L | Ф 0.The simplest approach is to apply the two-dimensional Kutta condition all along the trailing edge—namely, that the trans­verse-filament-vortex strength must be zero all along the trailing edge. To satisfy this condition, free wake panels are added to the model. Each wake panel must have a vortex-ring strength that is equal and opposite to the net strength—say, АГ3—of the two transverse vortices at the trailing-edge location from which the wake trails. Thus, for example, the Kutta condition requires that АГ3, wake = – АГ3. Something also must be stated about the wake geometry. Fig. 6.20 shows a typical wake panel extending to downstream infinity from a pair of wing trailing-edge panels. Because the wake panels cannot support any pressure difference, they must be aligned with the local flow streamlines. This streamline shape may be obtained from experiment. However, as an approximation, the wake panels may be aligned with the freestream direction, with the wing chord, or with an other convenient reference line. The wing angle

Vortex Panel Method

Vortex Panel Method

(n refers to surface normal in this figure; t refers to the tangent direction at the control point)


Figure 6.20. Vortex-panel geometry.


Vortex Panel Method

of attack is small, so that this type of approximation is usually satisfactory. If we desire to accommodate wake curvature, it is useful to divide each semi-infinite wake panel into several panels of arbitrary length but all with the same strength. The self­induced distortion of the wake (i. e., wake rollup) can be included in more compli­cated numerical models, if desired.

The numerical solution requires that a geometric description of the problem be established before calculations can begin. Regarding a reference system, the loca­tion of each control point must be described, as well as the corner points of each vortex ring and the direction of the normal to each panel. Finally, the straight-line distance from each control point to the end points of each of the four vortex fila­ments, that comprise each vortex ring must be calculated and stored.

One linear-algebraic equation is written for each control point on the surface panels by applying the surface-boundary condition. This requires the calculation of the velocity induced at each control point by all of the vortex segments on all of the surface panels (including the contribution of the vortex rectangle located on the surface panel containing the control point itself) and by all of the vortex seg­ments on all of the wake panels. Recall from Section 6.2 that each induced velocity is perpendicular to a plane containing the particular element at the vortex ring and the control point in question. Hence, the direction, as well as the magnitude, of each induced-velocity contribution is known so that a resultant velocity normal to the panel containing the control point may be established. Now, because the orientation of each surface panel relative to the freestream direction is known for any given wing and angle of attack, the normal component of freestream velocity can be found at each control point as well. The defining equation at the control point reflects the application of the no-flow through boundary condition: The normal velocity induced at the control point by all of the vortex elements on all of the surface and wake panels must be equal and opposite to the normal component of freestream velocity at that same control point.

As an example, we consider the control point on Panel 1 in Fig. 6.20a. The velo­city, Vj, induced at that control point by the four vortex elements of strength Гi on Panel 1 is calculated, as in Example 6.1. The resultant is perpendicular to the Panel. The velocity induced by each of the four vortex elements on each of the remaining surface panels can be calculated using the Biot-Savart Law, as given in Eq. 6.2. Each induced velocity, Vj, is perpendicular to a plane containing the control point and the particular vortex element in question. Because the wing geometry is known, the component of Vj acting perpendicular to Panel 1—namely, Vj|s=i may be calculated. The process is repeated for each vortex element of each wake panel. When all of the calculations are made for the normal component of velocity induced at the control point on panel s = 1, the result may be represented as follows:

N 4

Vp|s=1 II (Vi|s=1)n, m + I (ViU )wake, (6.58)

n=1m=1

where VP is the resultant normal component of the velocity induced at Point P on Panel 1 by all of the N surface panels and all of the wake panels. The resultant normal component, VB then is set equal to the freestream-velocity normal component at the control point on panel s = 1 and one algebraic equation is written. Thus,

^1 V°,normal 11′

Подпись: (6.59)The entire process is repeated for Panel 2, s = 2, and so on, until ultimately a total of N linear-algebraic equations in the form of Eq. 6.58 have been written that contain N unknowns, Г l through rN. It is apparent that there is much geometry bookkeeping to be done, which is why the method requires a computer. Usually, the Biot-Savart Law is expressed and used in a more general vector form. Also, the induced velocity and the freestream velocity may be calculated in coordinate-component form at each control point and then nulled rather than applying the boundary condition in terms of two velocity components perpendicular to the surface panel containing the control point, as illustrated herein.

Notice that a vortex element located on one side of the wing influences the flow at a control point on the opposite side of the wing. Furthermore, the appropriate dis­tances between the two ends of the vortex element and the control point, to be used in the Biot-Savart Law, is the straight-line distance and not the distance as measured along the wing surface. The “1/r” influence of the vortex filament is still valid here and is confirmed by experiment.

The array of simultaneous algebraic equations is solved for the unknown element strengths, Гп. The pressure distribution on the wing surface may be found in the following way, referring to Fig. 6.20b. Define an orthogonal and tangential coordinate direction at each control point. Then, use the velocity information gener­ated when applying the no-flow-boundary condition at each control point to find the resultant velocity in the newly defined tangential-coordinate direction. Do this at every control point, accounting for the contributions due to all of the induced velo­cities as well as to the freestream velocity. This is the magnitude of the tangential velocity, Vn, t, at a particular control point. The local static pressure at a control point, pn, then may be found by using the Bernoulli Equation. Thus,

(6.60)

where p0 is the (known) stagnation pressure of the oncoming flow.

Подпись: Cpn =1 - Подпись: V Подпись: (6.61)

If we prefer, the magnitude of the local pressure coefficient at a control point may be found instead because for incompressible irrotational flow, it was shown in Chapter 4 that:

The predicted static pressure or pressure coefficient is assumed to be constant over each of the panels, n, corresponding to the n control points.

The pressure-distribution predictions from the VPM agree satisfactorily with experiments. However, unless numerous panels are used to represent the wing, the chordwise pressure distribution on the wing surface is not sufficiently detailed (or is too bumpy) to be used as input to a boundary-layer program. This is the motivation for the strip-theory approach, which is described later.

The pressure acting at the control point of each surface panel acts normal to the panel and inward on the panel surface. As noted previously, this pressure is assumed
to be constant over the panel. Thus, there is a force acting normal to and on the sur­face of the nth panel, which is given by:

ATn = (pn)(AAn), (6.62)

where AAn is the surface area of the nth panel and there are n = N panels.

Finally, the total lift force on the wing can be determined by first finding the component of AFn, which is perpendicular to the freestream direction (i. e., the panel contribution to lift, ALn). Then, summing over all of the panels on both the top and bottom surfaces of the wing, taking care that the contribution of ALn is signed posi­tive upward:

N

L= E [Л LJ. (6.63)

n=1

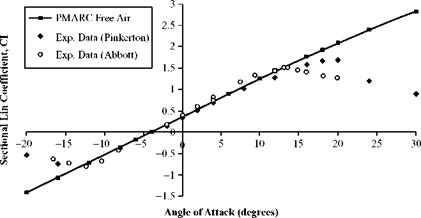
Alternately, the spanwise lift distribution may be found by summing the contri­bution to lift of corresponding panels on the top and bottom surfaces of a wing at a particular spanwise location. The accuracy of the VPM is enhanced as the number of panels is increased. Results from a typical panel-code solution for a finite wing are compared with experiments in Fig. 6.21. Agreement with experimental data is excel­lent until viscous effects begin to dominate at large angles of attack.

In the preceding discussion of the VPM and in the following discussion of the VLM, the intent is to physically describe the method in words. There are many vari­ations of the methodology, and the prediction codes are much more efficient than the outline described here suggests. Variations in the prediction-code flow chart and in the panel-generation code, which defines the location and shape of the sur­face panels, can significantly affect solution accuracy and efficiency. The student is referred to the current literature and to Katz and Plotkin (1991). Panel methods circa 1985 are compared in Margason et al. (1985).

Wing-Panel Methods

The advent of the digital computer enabled the development of solution methods for finite wings that are superior to methods that represent the wing by a lifting line. These solution methods are an extension of the airfoil-panel methods discussed in Chapter 5, with singularities here being distributed over the wing planform. The singularities may be sources, doublets, vortices, or certain combinations of these. A source distribution splits the streamlines and thus represents wing thickness, whereas a doublet or vortex distribution gives rise to lift. Vortex elements are dis­cussed here for a wing with an arbitrary planform. Appeal is made to the tangency (i. e., “no-flow”) boundary condition, as in Chapter 5, and a system of simultaneous linear-algebraic equations is developed by applying the tangency-boundary condi­tion at numerous points on the wing surface. The wing is assumed to be at a small angle of attack relative to the freestream flow because the theory is inviscid and irrotational and large areas of separation cannot be accommodated. Unlike lifting­line theory, panel methods require no restrictions on wing sweep or AR, but they do rely on the principles of superposition.

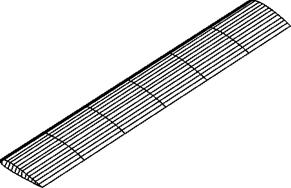
The two panel methods described herein, the vortex panel method (VPM) and the vortex lattice method (VLM), can be used to model inviscid flow over wings with airfoil sections of large or small thickness ratios. The VPM is illustrated for a wing of arbitrary-thickness ratio, and the surface-pressure distribution on the wing is found. The VLM is discussed for a thin wing, that is, the wing thickness is assumed to be
small and its effect is neglected. When the wing thickness is neglected, such panel methods often are called lifting-surface methods. Lifting-surface methods apply the tangency-boundary condition on the camber surface of the wing rather than on the surface of the wing. The advantage of a lifting-surface analysis is that it is easier to program because far fewer panels are needed and the influence equations are sim­pler while satisfactory accuracy is maintained, as it was in thin-airfoil theory. The disadvantage of a lifting-surface analysis is that it provides the pressure difference (i. e., pressure loading) across the camber surface rather than the pressure distribu­tion on the wing surface. The pressure distribution on the wing surface is needed as input for any related boundary-layer solution. However, lifting-surface methods provide force and moment data.

In both of the panel methods described herein, the wing surface must be subdi­vided into a suitable number of small quadrilateral panels that reflect the wing shape and planform. These panels need not be of the same size, usually being smallest in regions of rapidly varying flow properties. Thus, given wing surface must be discre­tized into panels as a preliminary step in the calculation. This grid generation is itself an important area of study. Each panel has vorticity distributed over the surface. In the following discussion, the vorticity is combined with vortex elements for conven­ience. Higher-order solutions with curved panels and distributed vorticity are found in the literature.