Category BASIC AERODYNAMICS

Lifting-Line Concept

In both the thin-airfoil analysis and the numerical methods discussed in Chapter 5, the tangency-boundary condition was imposed along the mean-camber line or along the surface of the airfoil to generate a solution. The same is true in the numerical methods for three-dimensional wings, discussed later in this chapter. However, in the lifting-line theory that follows, a different approach is taken.

In the lifting-line analytical model, the vorticity representing a wing is collected into a single finite-strength vortex extending spanwise from wing tip to wing tip. Such a model leads to a simple solution of acceptable accuracy, providing that cer­tain restrictions are placed on wing planform. If this analysis is to give satisfacto­rily accurate results, then the wing must be of relatively large aspect ratio (usually greater than 4 or 5) and the wing planform should not have a large taper or sweep. The reason for these restrictions becomes apparent as the theory develops. Because the wing is to be represented by a single spanwise vortex, the resulting theory does not supply any chordwise pressure-distribution information. However, the theory predicts forces on the wing satisfactorily through the vortex theory of lift.

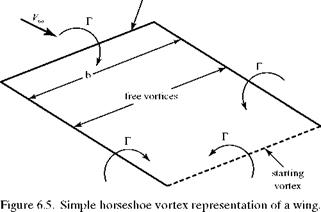
The line vortex containing the combined chordwise circulation of the wing is termed a lifting line. It is also termed a bound vortex because it is fixed at the location of the wing in the stream and is not free to move. In accordance with the second Helmholtz theorem, this bound vortex cannot end at the wing tips. Thus, the lifting line is turned in a downstream direction at the tips and the two vortices trail downstream (Fig. 6.5). These two vortices have a physical counterpart (see Fig. 6.3): namely, trailing vortices generated at the wing tips. The two trailing vortices are termed free vortices because they are free to move and do not represent a fixed solid surface. The resulting U-shaped vortex system is termed a horseshoe vortex because of its shape.

The horseshoe vortex is designed to close on itself by closing the end of the horseshoe with another vortex (see the dashed line in Fig. 6.5). This has a phys­ical reality, representing the starting vortex discussed in conjunction with two­dimensional airfoils and the Kutta condition in Chapter 5. In a steady-flow problem, this starting vortex is far downstream and does not affect results at the wing because of the 1/(distance)2 influence. Thus, the horseshoe vortex alone may be used to model flow over a finite wing.

bound vortex

Lifting-Line Concept

Vortex Sheet

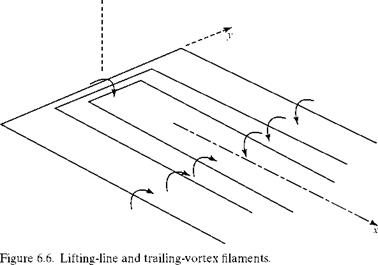
The vortex model in Fig. 6.5 is too simple and does not represent physical reality. If the circulation, Г, is constant across the span—as it must be to satisfy the first Helmholtz theorem—then according to the Kutta-Joukouski Theorem (see Chapter 4), L’ = рУтеГ, and the lift per unit span must be constant across the span up to the wing tips. However, the lift is caused physically by a difference in surface pressure between the lower and upper wing surfaces; this pressure difference must be zero at the wing tips because there is no physical barrier between the two surfaces. Accordingly, the lift must go to zero at the wing tips. This contradiction is resolved by representing the wing by a lifting line consisting of a bundle of vortex filaments of different lengths (Fig. 6.6). The lifting line is now of variable strength spanwise. Each of the bundled filaments must be a horseshoe vortex, so that a number of vortex filaments trail downstream. In the final model, there is an infinite number of such filaments, each of infinitesimal strength, and the trailing filaments form a trailing – vortex sheet. In Fig. 6.6, only a few vortex filaments are shown, for clarity.

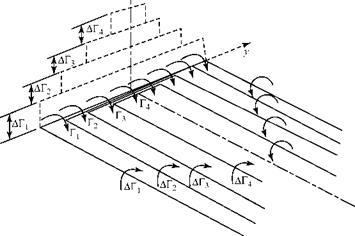
Before deriving the equation for calculating the induced velocity at the lifting line, the model given in Fig. 6.6 must be made more precise. Consider the lifting line as consisting of four vortex filaments (Fig. 6.7). Each bound-vortex filament has a different length and has a strength given by Гп. The lifting line then has a variable strength, ranging from Г1 at the wing tips to Г4 at the plane of symmetry, where:

Гі = АГ!

Г2 = АГ1 + АГ 2

Г3 = АГ1 + АГ2+ АГ3 (6.5)

Г4 = АГ і + АГ 2 + АГ з + АГ4.

Because each bound filament is part of a horseshoe vortex, four vortex filament pairs trail downstream. Because all three legs of the horseshoe vortices must have the same strength, the trailing vortices each have the same strengths as the bound filaments from which they trail.

4

Lifting-Line Concept

Lifting-Line Concept

z


x


Figure 6.7. Details of lifting-line and trailing-vortex filaments.


Thus,


Lifting-Line Concept

ДГ = Гі

ДГ2 = Г2 – Гі

АГз = Гз – Г2 (6.6)

ДГ4 = Г4 – Г3.

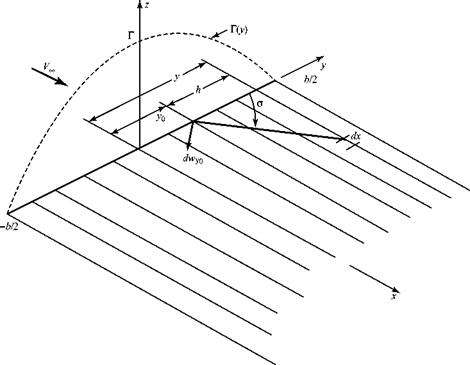
Now, we imagine that there are an infinite number of bound filaments, each of a different length and each of a different infinitesimal strength dr. In the limit, the stepwise distribution along the lifting line becomes continuous (Fig. 6.8) so that Г = Г(у). We notice from Fig. 6.7 that the trailing-vortex filament strength is given by the difference in bound circulation across a spanwise interval at the point of origin of the trailing filament. With a continuous distribution of bound circulation, ДГП ^ dF. The difference in bound-circulation strength at any spanwise location for an incre­mental spanwise step dy is given by ДГП = ДГ = (АГ/Ay)Ay or, in the limit, by:

dT – = – dy-ydy – («)

This equation states that the strength of the vortex filament depends on the span – wise gradient of the bound vorticity.

A continuous spanwise distribution of circulation (i. e., lift per unit span) and the resulting trailing-vortex sheet is shown in Fig. 6.8.

Although the distribution of Г(у) in Fig. 6.8 is yet to be found, if the wing is symmetrical about the root chord, then Г(у) must have the general shape shown in the figure because L’ goes to zero at the wing tips, where the pressure difference across the wing bottom-to-top goes to zero. Equation 6.7 then makes physical sense: It states that the vortex filament trailing from the wing at y = 0 has zero strength (i. e., no spanwise-velocity-component mismatch, by symmetry), whereas the trailing

Lifting-Line Concept

Figure 6.8. The lifting line and vortex sheet.

filaments near the wing tips have the greatest strength (i. e., largest spanwise velocity component mismatch at the trailing edge).

In Fig. 6.8, the spanwise distribution of circulation is shown as symmetrical about mid-span. This is the usual case because wing planforms normally are mirror images of one another about the centerline of a vehicle. An exception is the case in which the ailerons (i. e., small control surfaces located near the wing tips) are deflected asymmetrically to generate a rolling moment. Another exception is a study of the wing aerodynamics if one wing-flap actuator failed. These effects can be accounted for by a more elaborate lifting-line treatment. Only the symmetrical case is consid­ered here.

Prandtl Lifting-Line Theory

Ludwig Prandtl is considered by some to be the greatest aerodynamicist of all time. He was responsible for solving several of the most important theoretical problems in aeronautics, including the correct manner for treating viscous effects by means of boundary-layer theory and the fluid dynamics of finite wings by introduction of the elegant yet simple idea of the bound vortex.

Two important vortex theorems attributed to Helmholtz must be reviewed before the analysis may begin. These theorems state that:

(a) The strength of any vortex filament must be constant along the length of the filament.

(b) A vortex filament cannot end in the fluid; it must close on itself or end at a boundary in the fluid.

These ideas provide a useful visualization of the problem and motivate many of the mathematical steps in developing the theory for lift generation on a finite-wing surface.

The Biot-Savart Law

Each filament of the trailing-vortex sheet “induces” velocity components at every point on and around a wing. As mentioned in Chapter 5, the vortex sheet does not actually cause a velocity to be present at a point. Rather, the flow field associated with the vorticity coming from the wing is configured such that it may be thought of as being induced by the vortices present in the flow model. A method of calculating these induced velocities is sought here as a generalization of the predicted behavior of the point vortex in two dimensions (see Chapter 4).

The general Biot-Savart Law mathematically expresses the velocity induced at any point in space by an element of a curved vortex filament. In this form, it is some­times used to calculate the shape of the wakes of helicopter blades.

In the analytical and numerical models discussed herein, the vortex sheet is assumed to be planar, which allows the Biot-Savart Law to be considered in a sim­pler form. More complex analyses allow the trailing-vortex sheet to distort due to self-induced velocity disturbances. The Biot-Savart Law is stated here without proof. However, when applied to the familiar two-dimensional point vortex as a special case, the law provides the anticipated result.

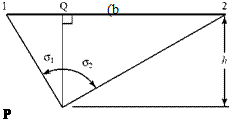
Подпись: Figure 6.4. The velocity induced by a straight vortex filament of arbitrary length. The Biot-Savart Law

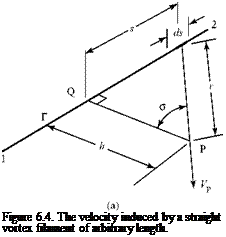
We consider a vortex filament of length 1-2 with a constant strength, as shown in Fig. 6.4. Let ds be an increment of length of the filament.

The Biot-Savart Law The Biot-Savart Law Подпись: (6.1)

The Biot-Savart Law states (Fig. 6.4a) that if the filament and Point P are both in the same plane, then the velocity induced at the fixed but arbitrary Point P by an increment of filament, ds, is perpendicular to that plane and has a magnitude, dVP, given by

where r is the length of a line joining the increment of filament, ds, to Point P; PQ is the normal from Point P to the filament (of length h = constant); and the angle о is the angle that r makes with PQ. We recognize from geometry (Fig. 6.4) that with s as the distance between Q and ds, then:

h

— = cos о r

s 2

and — = tan o^ ds = h sec2 о do.

Подпись: or The Biot-Savart Law Подпись: (6.2)

Substituting these relations as into Eq. 6.1 leads to an expression in terms of the vari­able о, the length h being a constant. Summing the contributions of all of the incre­ments ds comprises a filament 1-2 of arbitrary length and orientation, as illustrated in Fig. 6.4b.

Note in Fig. 6.4b that if the end point(s) of the vortex filament lies to the left of the point of interest, P, then o2 is a negative angle.

If the vortex filament is infinite in extent, then sin oi ^ -1 and sin o2 ^ 1. Equation 6.2 then states that:

Подпись: (6.3)Vp 2 nh’

Notice that this result agrees with the two-dimensional vortex behavior discussed in Chapter 4. The vortex filament in Eq. 6.3 is of constant strength, extends to infinity in both directions, and is perpendicular to the plane P-Q containing Point P. The Biot – Savart Law thus gives the expected result when applied to a problem corresponding to a two-dimensional point vortex.

If the vortex filament in Fig. 6.4 were only semi-infinite in length and extended from Q to infinity, then the limits of integration in Eq. 6.2 would be o1 = 0 and o2 ^ n/2, leading to:

Подпись: (6.4)Vp 4 nh’

This result is useful later.

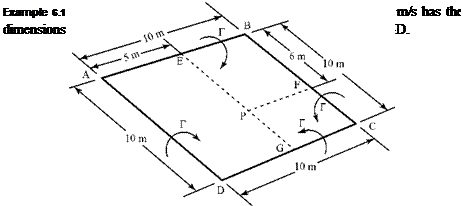
Required: Find the magnitude of the velocity induced by the vortex in a direc­tion normal to the plane at Point P if Point P lies in the same plane.

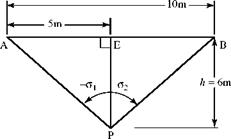
Approach: The contribution of the four lengths of the vortex filament must be evaluated by applying the Biot-Savart Law, as expressed in Eq. 6.2. The limits of integration in this equation must be modified to reflect the different finite lengths of each segment of vortex filament.

Solution: Consider each segment in turn. The required angles are rounded off to the nearest degree, for convenience.

a. The Biot-Savart Law

The Biot-Savart Law

Segment A-B:

"«■> = 4n(6)[si”(40°) – sta(-40°)] = 2ЇЛ<L28)

b.

Подпись: FP<b) = " 8Ь,<50')] = Ж a40)

Segments B-C and A-D have the same contribution by symmetry. Thus,

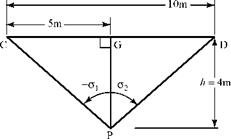
c. Contribution of segment C-D:

The Biot-Savart Law

VP(c) = <2>4iTj)[sin(51°> – sin(-51-)j = 1- a-56).

Adding the three results and substituting the given vortex strength:

VP = 18.5 m/s.

Appraisal: The given units may be verified by evaluating the units in Eq. 6.4 or in the vortex theory of lift, L’ = pVMT, where L’ is the lift per unit span (meter) and p is the density mass per cubic meter.

Notice that P-E, P-F, and P-G in turn play the role of P-Q in Fig. 6.4, whereas A-P and B-P, for example, play the role of the line of variable length r in Fig. 6.4 at two extreme end points. Extreme care must be taken so as to use the correct signs for Oi and o2.

Incompressible Flow about Wings of Finite Span

In 1908, Lanchester visited Gottingen (University), Germany and fully discussed his wing theory with Ludwig Prandtl and his student, Theodore von Karman. Prandtl spoke no English, Lanchester spoke no German, and in light of Lanchester’s unclear ways of explaining his ideas, there appeared to be little chance of understanding be­tween the two parties. However, in 1914, Prandtl set forth a simple, clear, and correct theory for calculating the effect of tip vortices on the aerodynamic characteristics of finite wings. It is virtually impossible to assess how much Prandtl was influenced by Lanchester, but to Prandtl must go the credit. . .

John D. Anderson, Jr.

Introduction to Flight, 1978

6.1 Introduction

This chapter considers steady, inviscid, incompressible flow about a lifting wing of arbitrary section and planform. Because the flow around a wing is not identical at all stations between the two ends of the wing, the lifting finite wing constitutes a three­dimensional flow problem. The two wing tips are located at distance ± b/2, where b is the wing span.

Certain terms must be defined before a study of finite wings can be begun (Fig. 6.1). The coordinate axis system used is shown in Fig. 6.1a. A wing section is defined as any cross section of a wing as viewed in any vertical plane parallel to the x-z plane. It also is called an airfoil section. The wing may be of constant section or variable section. If a wing is of constant section, wing sections at any spanwise station have the same shape (e. g., NACA 2312). If a wing is of variable section, the wing- section shape varies at different spanwise locations. For example, a wing of variable section might have a NACA 0012 at the root section (i. e., the section in the plane of symmetry at y = 0), then smoothly change in the spanwise direction until the wing had, a NACA 2312 section at the tip.

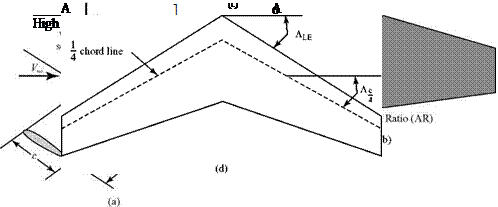
The planform area, S, of a wing is the projected area of the wing at zero angle of attack on a plane parallel to the x-y plane. If a wing has a tapered planform (Fig. 6.1b), the section chord lengths vary along the span. The taper ratio is defined as X = ct/cr. The airfoil sections for a straight-tapered wing of constant section all have

the same descriptor (e. g., NACA 0012), but they do not have identical sizes from root to tip. If the tip chord is smaller than the root chord (the usual case), then the tip section has the same thickness ratio as the root chord but not the same thickness dimension.

Подпись: c Incompressible Flow about Wings of Finite Span

The ratio of the square of the wing span divided by the wing-planform area appears so often in aerodynamic equations that this ratio has a name: the aspect ratio, AR = b2/S (Fig. 6.1c). For a rectangular planform, AR = b/c. The AR may be used to define a mean wing chord (or geometric average chord), c; namely,

c = b / AR. This mean chord should not be confused with the mean aerodynamic chord used in performance calculations. The mean aerodynamic chord is defined by:

1 b/2 2

mean aerodynamic chord = mac = — J 6/2[c(y)] dy

If the wing quarter-chord line is not parallel to the y-axis, then the wing is called a swept wing (Fig. 6.1d). The sweep angle to the quarter-chord line is used mostly in subsonic flow. Another sweep angle, the angle to the wing leading edge, is important for supersonic-flow considerations. If a swept leading edge and a straight trailing edge meet at a common point, the resulting planform is called a delta wing.

For convenience, a wing of rectangular planform is discussed initially; however, this chapter later addresses wings of arbitrary planform. Although the origin of coor­dinates may be taken at any chordwise station, it often is taken at the one-quarter chord point, as shown in Fig. 6.1a.

By definition, a finite wing has tips. If the wing is experiencing positive lift, then the average pressure on the lower surface of the wing is larger than on the upper surface. This pressure imbalance produces lift and also gives rise to a spanwise flow from the lower surface of the wing around the tips to the upper surface. Such a tip effect is not present when the wing is two-dimensional or of infinite span, with effectively no tips.

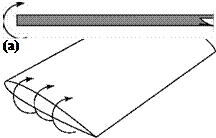
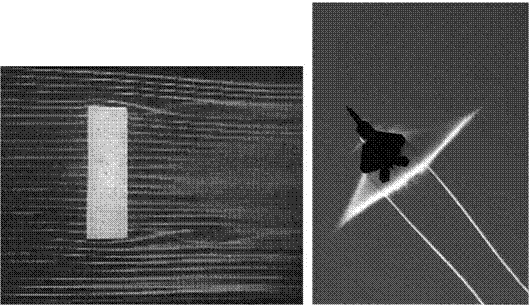
At the wing tip, there is a strong vortex set up that is due to the flow around the tip (Fig. 6.2a). Looking upstream, the sense of the tip vortex is clockwise at the left tip and counterclockwise at the right tip. These tip vortices trail downstream behind the wing and can be observed in wing-tunnel flow-visualization tests (Fig. 6.3a).

Incompressible Flow about Wings of Finite Span Подпись: (b)

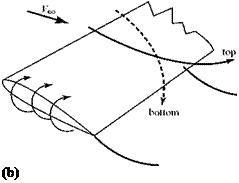
The spanwise flow field that is set up due to the flow around the wing tips means that the uniform flow that passes under the wing is given an outward velocity com­ponent so that the streamlines bend outboard (Fig. 6.2b). Similarly, the streamlines that pass above the wing surface experience an inward flow component and bend inboard. At the trailing edge, then, there is a mismatch in the spanwise velocity component. The spanwise flow just below the wing has an outboard component and the spanwise flow just above the wing has an inboard component. Such a velocity

discontinuity, occurring in essentially zero distance, was observed previously across a mean-camber line in two-dimensional thin-airfoil theory, where it was modeled by using a vortex. Likewise, the discontinuity in velocity that is present at the trailing edge of a finite wing is modeled by using vortices that begin at the wing trailing edge and trail downstream. The sense of the trailing vortices is clockwise for the left half­wing (looking upstream) and counterclockwise for the right half-wing. Each vortex filament trails downstream behind the wing like a thread. As might be expected, the magnitude of the spanwise-flow components and, hence, of the velocity discontinuity at the trailing edge and the related strength of the trailing-vortex filaments varies across the wing span. The spanwise-flow component, and the resulting velocity mis­match, is largest near the tip and zero at mid-span. Thus, the trailing vortices near the tip are much stronger than those farther inboard. It is shown later that the strength of the trailing-vortex system is closely related to the rate of change of circulation along the wing span.

Incompressible Flow about Wings of Finite Span

All of the trailing-vortex filaments together are called a vortex sheet. Such a sheet is observed in practice as a thin viscous layer of high vorticity coming off the wing trailing edge. In practice, this vortex sheet is unstable and, at a distance down­stream of the wing, the entire sheet rolls up into two large contra-rotating vortices that continue downstream and ultimately diffuse under the action of viscosity. These large vortices can be observed in vapor trails left behind aircraft flying at an alti­tude such that the low pressure in the core (i. e., center) of the vortex causes the water vapor in the atmosphere to condense and become visible, thus acting as a visualization medium (Fig. 6.3b). Figure 6.3(b) also shows some effects of compress­ibility made visible by the same atmospheric conditions that show the tip vortices.

For purposes of analysis, the vortex sheet can be approximated, with small error, as being planar. It is possible to ignore the downstream deformation of the vortex sheet because the velocity disturbance at the wing caused by a segment of the trailing-vortex filament decreases by the inverse-square of the distance from the seg­ment to the wing. Thus, a few chord lengths downstream of the wing, the distortion of the vortex sheet has negligible effect at the wing. Numerical solutions allow the vortex sheet to deform naturally, if desired.

The existence of a trailing-vortex sheet, which is not present in the case of an infinite wing, has major significance. It is shown later that a rectangular wing of con­stant section does not exhibit the same properties as the individual airfoil sections that comprise it. Regarding lift, for example, the lift-curve slope of a finite wing of constant section is found to be less than the (two-dimensional) lift-curve slope of the airfoil sections. Thus, it is important to be able to predict wing lift and to opti­mize lift for given constraints. The primary task in this chapter, then, is to examine the behavior of a finite wing and to discover how forces on the wing depend on wing-shape parameters.

Recall that for a two-dimensional airfoil, the drag was predicted to be zero according to the inviscid-flow model. That is, when the streamwise component of pressure force acting on an element of airfoil surface was integrated around the airfoil, the net drag force was zero. However, the drag of a finite wing is found to be nonzero, even in an inviscid flow. The presence of the trailing-vortex sheet affected the pressure distribution on the wing such that there now is a streamwise-force com­ponent, or an induced drag. This drag is the price for generating lift with a finite wing, and it must be added to the drag due to viscous effects to arrive at the total drag of a wing. The functional dependence of this induced drag on wing geometry must be investigated because all forms of drag must be minimized.

In addition to finding how wing lift and drag depend on the geometry of the wing, it is important to determine the distribution of force (primarily the lift force) across the span for a given wing geometry. Imagine a wing to be a beam cantilev­ered from the fuselage. If a beam structure is to be designed successfully, the force distribution along the beam must be known. Similarly, a structural analysis of a wing requires that the wing-spanwise-lift distribution, or spanwise loading,[22] be specified by an aerodynamicist.

This chapter begins with a discussion of the Biot-Savart Law, which provides a mathematical relationship to account for the presence of the trailing-vortex sheet at the wing. Because the flow around a finite wing must satisfy the Laplace’s Equation, it might be supposed that the finite-wing problem could be solved analytically by somehow distributing vortices over the wing surface, thereby paralleling the treat­ment of thin-airfoil theory in Chapter 5. This leads to a complex mathematical model. As a simplification, the vortices representing the wing are lumped together into a lifting line, which is a single finite-strength vortex filament extending spanwise from tip to tip and which represents the wing. The resulting theory is considered first in this chapter because it provides a fast and accurate way to uncover the variation of
wing properties across the span and thus the basic dependence of wing behavior on wing geometry. Following this discussion, two numerical solutions—termed vortex panel and vortex lattice methods—are discussed. Both methods model the finite wing by distributing vortices, either on the wing surface or on the mean-camber surface (i. e., thin wing), over the entire wing planform. Strip theory, a method to account for viscous effects if the wing angle of attack is small, is introduced next. To conclude this finite-wing chapter, several related topics are outlined—namely: ground effect, winglets, vortex lift, and strakes and canards.

Inverse Methods of Solution

The methods discussed here—superposition of distributed singularities (i. e., panel methods) and finite-difference solutions to the nonlinear differential equations,—are solutions to the direct problem: namely, given the airfoil shape, we find the pressure distribution. The inverse, or design, problem is the focus of much current analysis effort. Here, a streamwise velocity and/or pressure distribution along the airfoil surface is speci­fied at the outset to meet certain performance criteria. Examples include the following:

1. A streamwise pressure distribution might be specified along the airfoil surface that would encourage the preservation of a laminar boundary layer over a con­siderable chordwise extent. This would result in a significant reduction in drag because the skin-friction drag due to a laminar boundary layer is much less than that due to a turbulent boundary layer.

2. A streamwise pressure distribution that would delay boundary-layer separation and hence reduce the form drag of the airfoil might be specified along the airfoil surface.

3. A streamwise pressure distribution with a relatively low suction peak on the upper surface of the airfoil might be chosen. This would result in a higher critical Mach number for the airfoil, meaning that it could operate efficiently at a higher subsonic cruise speed than an airfoil with a conventional pressure distribution. Increased speed and efficiency are important design objectives.

The required velocity or pressure distribution around the airfoil specifies an air­foil shape, which must be found. An iteration process involving variation of the air­foil shape with conformal-mapping techniques (see Section 5.2) is used in computer codes to find a configuration that is physically correct (i. e., meets the requirements that the shape is closed, with proper flow conditions at infinity). Such airfoils are said to be “tailored” because they were designed for a certain behavior specified in advance. For example, recent work at Delft University on low-drag sailplane airfoils specified a pressure distribution on the lower airfoil surface that was designed to promote laminar flow over the entire lower surface. Such airfoils yield performance close to the theoretical maximum in terms of the L/D ratio.

Motivation for many of the modern low-speed airfoil-design procedures comes from what might appear to be an unexpected source; namely, international competition soaring. The quest for improved performance from the standpoint

Inverse Methods of Solution

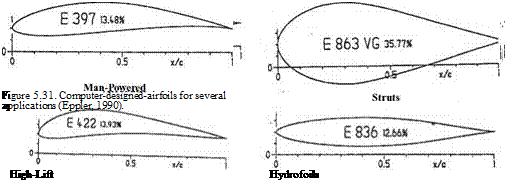
of reduced L/D, (see Chapter 1), has led to improvements in every facet of low – speed airplane design. One of the most important ways to achieve increases in performance is through improvements in airfoil characteristics. Much of the early work to improve low-speed airfoils was conducted by German engineering stu­dents working at the Akaflieg groups in major universities. This work continues the tradition begun in the 1920s and 1930s, starting with the development of the Jou – kowski airfoils and their derivatives, the Gottingen airfoils. Two students, Richard Eppler and Franz Wortmann at the University of Stuttgart, were responsible for leading the revolution in laminar-flow airfoil design in the last several decades. Their airfoils are now in widespread use throughout the world, and their computer codes have been adapted by many institutions, including NASA. Figure 5.31 illus­trates several of Eppler’s airfoil designs for different aeronautical applications. We

examine two of the airfoil shapes shown in Fig. 5.31. The discussion follows that given in Boermans (1997).

Consider the E.361 airfoil design for a helicopter rotor shown in Fig. 5.31. When a helicopter is in forward flight, the rotating blades experience a high resultant velo­city (and low Q) as they sweep forward into the oncoming stream (i. e., “advancing” blades), and a low resultant velocity (and higher Q ) as they rotate farther and then move in the streamwise direction (i. e., “retreating” blades). Compared to a similar conventional NACA airfoil, the pressure distribution on the E.361 at low Q (a = 1°) is flattened. This reduction of the suction peak at about 10 percent chord allows for a delay in the onset of compressibility effects on the advancing helicopter blades, with a resulting increase in blade performance. The E.361 also has a more gradual onset of stall and a larger Clmax compared to a conventional NACA section.

We now consider the Eppler E.476 airfoil tailored for an aerobatic aircraft application (Fig. 5.31). A desirable airfoil shape for an aerobatic aircraft is that the airfoil is symmetrical because the aircraft must have the same behavior in normal and in inverted flight. High-lift coefficients also are required for such an aircraft; the tailored airfoil has a higher Qmax than a comparable NACA symmetrical airfoil. The E.476 has a gradual stall. However, an airfoil shape may be tailored to have a sharp (i. e., hard) stall because such stall behavior is desirable in an aerobatic aircraft when abrupt maneuvers are required.

5.5 Summary

The goal of this chapter is to provide the student with a solid grounding in the physical behavior of airfoils as well as an introduction to numerical methods, which should be studied in detail in other courses covering numerical analysis. Most modern air­foils are designed by using computer codes. The codes range in complexity from simple panel codes to CFD codes for solving nonlinear-flow problems. There is considerable emphasis on the inverse-airfoil problem. The future of aeronautical engineering clearly is digital regarding analysis, design, and production. It eventually will be possible to design reliably an airfoil or a complete wing by computer, with computer “experiments” taking the place (at least partially) of the typical expensive testing with physical hardware. Major benefits include the ability to vary the param­eters over wider ranges than might be attainable in wind-tunnel testing. However, at present, there still is considerable dependence on wind-tunnel testing for verifying and “tweaking” or correcting results of the computational effort.

That this procedure works is demonstrated by the outstanding results achieved by Boermans at Delft University of Technology and by other investigators. New laminar-flow airfoils were developed by computational methods and then subjected to careful testing and tuning in a low turbulence wind tunnel at Delft University. For example, a new series of airfoils was developed that have laminar flow over 96 per­cent of the lower surface. These improvements led to sailplanes with demonstrated glide ratios greater than 60:1. This airfoil technology also is being applied currently in Europe to a new family of high-performance commercial aircraft.

Students reading this textbook who require detailed information regarding performance and, perhaps, the actual airfoil coordinates needed to reproduce an airfoil for applications are referred to Web sites that provide data for thousands of
airfoil shapes. There also are Web sites that provide airfoil-design programs and a considerable selection of tutorial material. These items make it easy for students to supplement the material in this chapter and provide additional tools for the latter application of methods discussed herein. An interesting review of airfoil develop­ment is provided by Gregorek (1999).

Distributed Singularity (Panel) Numerical Methods

Thin-airfoil theory is convenient and satisfactorily accurate; however, it has several limitations. It cannot be applied to arbitrarily thick airfoils with confidence because thickness effects were ignored in the derivation of the theory. If pressure-distribution information is required in addition to the airfoil lift and moment, then more of the coefficients in the Fourier-series representation must be found. Also, the result is Ap across the mean camber line and not the pressure distribution on the surface of the airfoil, as needed for a related boundary-layer solution.

The advent of digital computers offers the attractive alternative of a numerical rather than an analytical solution, and many of the assumptions required for the ana­lytical solution can be dropped. In this section, we introduce one of these numerical approaches. It relies on superposition of singularities much like the analytical method; however, instead of a Fourier-series representation for the continuous vari­ation of camber-surface vorticity, we seek a piecewise variation of the vorticity on discrete segments of the airfoil surface. Because the three-dimensional extension of one of these segments is a rectilinear “panel” on a wing surface, these methods are known as panel methods.

Panel methods are not restricted to the use of a vortex singularity to represent an airfoil or wing. Source and doublet singularities, discussed in Section 5.4, also may be used. At times, singularities are used in panel methods in combination. For example, it may be useful to represent an airfoil by a source distribution along the mean camber line to simulate the thickness effects plus a vortex distribution along the airfoil surface to account for the generated vorticity and lift.

There are a variety of panel methods. This introduction is intended to provide an idea of how the method is set up and how the aerodynamic performance of an aerodynamic surface is attained. The method outlined is not a so-called finite – difference or CFD scheme. Rather, panel methods use the power of a computer to solve large sets of simultaneous algebraic equations that are generated by repeated application of the tangency-boundary condition. Panel methods of solution are extended to three-dimensional wings and discussed in detail in Chapter 6. Eppler, 1990 is a benchmark presentation of panel methods, and several chapters of Applied Computational Aerodynamics, referenced in Chapter 6, present a good review of airfoil-panel methods.

The steps in any panel method of solution are the following:

1. Choosing the number and type of singularities. These singularities have an unknown strength associated with each one. For example, if there are N singu­larities, there are N unknown strengths. For this, we need N equations.

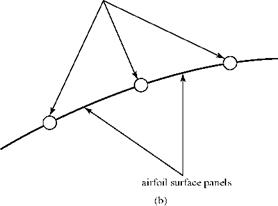
2. Discretizing the aerodynamics surface into N segments or panels. This simply means figuring out where on the surface we will place the singularities (Fig. 5.27). It is important that panels need not be all of the same size. They should be con­centrated in regions where the variables are expected to undergo rapid changes. This most often happens in regions of rapid geometry change. Thus, for example, we should expect to see singularities clustered (i. e., small panels) near the leading edge of an airfoil where the curvature is greatest and near the trailing edge because that also is a region where there is a rapid change in flow properties.

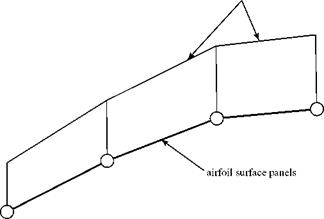
3. Placing the control points. To devise N equations, recall that the singularities are solutions of the Laplace’s Equation. In solving a differential equation, we must generate the generic solution and then impose the boundary conditions for the specific problem. Note that when we make use of the flow singularities, we already have the generic solution. The panel-solution method is based on satis­fying the surface-tangency boundary condition. Because there are N unknowns, we must satisfy the surface-tangency condition at N points on the surface. These are called the control points, and placement follows logic similar to the place­ment of the singularities.

4. Writing one equation for each control point. Here, the influence of all of the singularities and the freestream at a fixed control point is summed. Then, it is required that the net local velocity be tangent to the surface at that control point or, equivalently, that the normal component of velocity at the control point be zero. To accomplish this, the relative position of the control point relative to the location of all of the singularities is required, as well as the geometrical slope of the surface. In addition, it must be decided how the singularities are to be distributed on their respective panels. In the simple concentrated vortex model illustrated herein, the continuous vortex sheet along the panel is combined into a single point.

So-called higher-order vortex panel methods may use a curved panel. These methods also represent the vorticity as a linear or nonlinear variation along each panel. In general, higher-order panel methods achieve greater accuracy than using combined singularities on flat panels—but at the expense of a more complicated formulation and, often, with additional computation time required. The Program AIRFOIL (see subsequent description) provided for use with this textbook uses flat panels with a linear variation of vorticity from one end of the panel to the other.

5. Imposing the Kutta condition (if necessary). Lifting sharp-edge airfoils requires the Kutta condition to produce a realistic solution; other geometries, such as ellipses and cylinders, do not. Requiring that the velocity directions at the trailing edge are the same on the upper and lower surfaces at a cusped trailing edge, or that at a finite-angle trailing edge there must be a stagnation point, imposes the Kutta condition. This condition replaces one of the equations in Step 4, thereby reducing the required number of control points by one.

6. Solving the system of equations generated by Steps 4 and 5. Solving for N unknown singularity strengths requires the solution of a full Nx N matrix. Clearly, the more panels that are used (i. e., the larger the value of N), the more accurately the method represents the continuous vorticity distribution along a continuous airfoil surface. Thus, the limitation on the panel method is how quickly we can solve such a system. As computational resources improve in processing speed, the number of panels used also can increase. For example, older PCs running at 33 MHz can solve a system with N = 41 in about 2 minutes. Far larger values of N can be handled on modern desktop computer systems.

We next demonstrate an application of the panel method, first by a simple example and then by using a computer code supplied with the text. Consider the NACA 0012 airfoil shown in Fig. 5.27, where the circles in the figure indicate the locations of the combined vortices (N = 41 unknowns) on the airfoil. The vortices define the end point of the panels and the control points are located midway between the ends of the 40 panels. Note the clustering of vortices (i. e., small panels) near the leading and trailing edges of the airfoil. Also note that there is one vortex at the leading edge and two coincident vortices at the trailing edge.

Because the airfoil shape is known, the coordinates of the control points can be generated approximately by a simple averaging of the coordinates of the vortices on either side. A slightly more accurate procedure is to average the x/c coordinate and then use the equation for the airfoil surface to generate the z/c coordinate of the control point. In either case, the result is the known positions of 40 control points, which are used to generate 40 equations. The remaining equation results from the Kutta condition.

Distributed Singularity (Panel) Numerical Methods

(a)

clustered vortices

Distributed Singularity (Panel) Numerical Methods

Figure 5.27. NACA 0012 airfoil with 41 vortices indicated.

Distributed Singularity (Panel) Numerical Methods
Подпись: Figure 5.28. Influence of one vortex at one control point.
Distributed Singularity (Panel) Numerical Methods

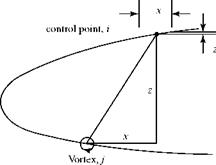
Next, we impose the tangential-velocity boundary condition at the 40 control points. To see how this is done, consider the velocity induced by one vortex at one control point, as shown in Fig. 5.28. Also shown is the panel on which the control point is located. The coordinates of the end points of the panels (i. e., the nearest vortices on either side of the control points) are used to determine the unit tangent to the panel. The coordinates of the control point are midway between the end points of the panel, called the control point (xi, zi). The coordinates of the clustered vortex are (xj, zj). Recall from Chapter 4 that the velocity components induced by a vortex at a distance r from the vortex are:

Г z Г x

2n (x2 + z2) 2n (x2 + z2)

where Г is the strength of the vortex and x and z are the distances in the coordinate directions from the center of the vortex to the control point. Now, the unit normal to the surface is given by:

„ – Azii + Axik n = . 1 = .

VAxf + Az2

Distributed Singularity (Panel) Numerical Methods Подпись: Г j xAxi + zAzi 2n (xwWAxi^zi2 Подпись: (5.36)

Thus, the component of velocity normal to the surface at the control point, i, induced by the vortex element, j, is:

where Tj is an as-yet-unknown vortex strength and:

x = xi – xj, z = zi – zj.

Distributed Singularity (Panel) Numerical Methods

An equation including all of the unknown vortex strengths is obtained by summing the contributions to the normal velocity at control point i from (a) all 41 vortices, and (b) the normal component from the freestream velocity (with the body angle of attack accounted for, if necessary). The sum is then set equal to zero to satisfy the tangency boundary condition at control point i. Thus,

Distributed Singularity (Panel) Numerical Methods Подпись: (5.37)

There are 40 such control points at which this relationship must hold. Thus, simpli­fying and applying the expression at all of the control points requires that the system of 40 equations,

must be satisfied. Because there are only 40 control points and there are 41 unknown values of the vorticity, a closure equation is required. This is provided by the Kutta condition, which requires that the trailing edge be a stagnation point. Hence, the two vortices, which are coincident at the trailing edge, must have equal and opposite strengths and the equation for the Kutta condition is:

Гі + Г41 = 0. (5.38)

The set consisting of Eqs. 5.37 and 5.38 then can be solved for the 41 unknowns. However, a difficulty is introduced by Eq. 5.38, which states that the strengths of the two vortices at the trailing edge self-cancel. Hence, their influence at each of the 40 control points will self-cancel. In effect, two vortices have been removed from the system, leaving a set of 40 independent equations with 41 unknowns. This difficulty can be resolved by leaving a small opening at the airfoil trailing edge (i. e., the upper and lower surfaces do not actually meet). As a result, the two vortices can be distin­guished from one another. This sends the two vortices back to contribute to the sum­mations at the control points in Eq. 5.37 and returns Eq. 5.38 as the 41st equation. The problem then becomes well posed, a system of 41 equations in 41 unknowns. As a result, the formulas for airfoil-thickness distributions (e. g., the NACA four-digit series) used in the calculation often are modified so as to leave the trailing edge slightly open.

Eqs. 5.37 and 5.38 constitute a linear system. The right side of Eq. 5.37 consists of known quantities once the freestream velocity and angle of attack are specified. For the example given here, the values of the 41 vortex strengths are found by solving this linear system. When the vortex strengths are known, the magnitude of the induced tangential velocity at each control point due to all 41 vortices may be calculated. The pressure distribution at each control point on the airfoil surface then follows from the Bernoulli Equation, where the local velocity at the control point is the sum of the induced tangential velo­city and the tangential component of the freestream velocity at that control point. Knowing the airfoil-surface-pressure distribution, the lift and moment coefficients follow and/or a boundary-layer solution can be used if a more accu­rate calculation is required.

Note that although we used 41 vortices here, a much larger number must be used so that the predicted flow over the airfoil is smooth. To diminish this number, we may use the higher-order panel methods mentioned previously. Program AIRFOIL uses a linear variation in vortex strength over the panels, as shown in Fig. 5.29.

Distributed Singularity (Panel) Numerical Methods

linear vorticity variation

Distributed Singularity (Panel) Numerical Methods

Figure 5.29. Linear variation of vortex strength in Program AIRFOIL.


Program AIRFOIL

This program computes the pressure coefficient, Cp, distribution on an arbi­trary airfoil at an arbitrary angle of attack using the vorticity panel method discussed herein. It determines all of the values of the lift and moment coefficients, Cg and Cm(for the moment taken about both the leading edge and the quarter-chord points). Additionally, the leading-edge stagnation point and the point-of-minimum-pressure locations are calculated. The location of the leading-edge stagnation point is important in boundary-layer calculations for the airfoil.

The user is presented with two options when executing the program. The first option has built-in information regarding the thickness and camber dis­tribution for NACA four-digit-series airfoils; therefore, a separate data file need not be constructed. The second option allows the user to input the airfoil coordinates of any arbitrary airfoil found in the literature (e. g., Riegels, 1961) or on the Internet. The main ideas used in this code already were presented; an example application is provided as follows.

Example: NACA 0009 Airfoil

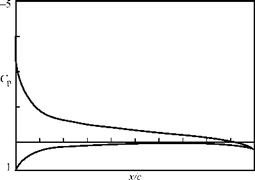
Using the first option in the program, a 9 percent-thick airfoil is chosen with zero camber and oriented at a 60-degree angle of attack. The program com­putes the vorticity distribution as described previously and presents the user with an output screen, which is reproduced here:

There are several things to notice in the figure. First, the graph of Cp versus x/c is usually presented with the z-axis reversed so that the Cp on the upper surface of the airfoil is on the upper part of the figure. The most striking feature of the graph is the large negative value of Cp at the leading edge. This corres­ponds to extremely low pressure and is the leading edge suction peak, which provides a major contribution to the overall lift.


Cp distribution for NACA 009 airfoil

a = 6.000 (degrees)

C1 = 0.7022 CmLE = -0.1793 Cm(c/4) = -0.0037


-Cpmm = -3.72280 at x/c = 0.00327


+ LE stagnation point at

(0.01069 – 0.01316) Cpmax = 1.00017


c –


Figure 5.30. Output screen for Program AIRFOIL.


The theoretical value of Cp = 1 at the stagnation point is well captured. The coordinates of the stagnation point are given to the right side of the figure. Notice that the stagnation point is slightly below the geometrical leading edge of this symmetrical airfoil, as shown in the figure with the “+” sign, because the airfoil is at the angle of attack. The location of minimum pressure (close to the geo­metrical leading edge) is shown by a small circle. The coordinates and the value of Cp for this point are given to the right side of the graph as well. Finally, the values of Ci and Cm (both at the geometrical leading edge and at the quarter-chord ) are given. The value of C1 = 0.702 is compared with the value of 0.65 shown in the experimental measurements in Fig. 5.26. The difference is due primarily to vis­cous effects, which tend to reduce the lift coefficient by lowering the suction peak.

It is interesting that thin-airfoil theory predicts a value of Cl = 0.658 for the NACA 0009 airfoil at a 6-degree angle of attack. This value is much closer to the experimental result than the prediction from the panel method Pro­gram AIRFOIL. The reason for this is that the approximations made in thin – airfoil theory lead to errors in the same direction as the viscous-flow correction required to compare the thin-airfoil prediction with the test result.


Distributed Singularity (Panel) Numerical Methods

The panel method described here provides rapid and acceptably accurate pressure distributions for a given airfoil. The airfoil shape then can be modified, if necessary, to achieve a certain design or performance objective.

The main shortcoming of these methods is that the flows that are computed are necessarily inviscid and irrotational. Airfoils in a viscous flow but with little or no boundary-layer separation may be analyzed by patching together panel-method and boundary-layer solutions. Surface-pressure information from a panel method may be used in conjunction with viscous boundary-layer solutions to either esti­mate the skin friction on the airfoil or account for the flow-displacement effect due to the presence of the boundary layer interactively. This is illustrated in Chapter 8, where the frictional drag of a wing is evaluated by using an approach called strip theory (i. e., treat each section of the wing as two-dimensional). Many refinements
are possible in panel methods to increase the accuracy and/or decrease the required computational time. The student is referred to Althaus and Wortmann, 1981, and to the literature for a discussion of these improvements.

Restricting the flow to an irrotational, inviscid model is unrealistic at high airfoil angles of attack or even at low angles of attack for thicker airfoils or for high-lift multi­element airfoils with flaps. In such cases, it becomes necessary to return to solving directly the governing partial-differential equations. Because these equations are nonlinear, superposition cannot be used. At the time of this writing, directly solving the nonlinear governing equations is still an evolving field (i. e., CFD). We introduce an important class of CFD methods—the finite-difference method—in Chapter 8 when flows with viscosity (which must be described by nonlinear equations) are considered.

Thin Airfoil with a Flap

Movable surfaces on airfoils or wings are called flaps (i. e., high-lift devices) or ailerons. Ailerons provide roll or lateral control for the aircraft. Similar movable surfaces on the horizontal stabilizer and vertical fin supply pitch and yaw control. These are usually called the elevator and rudder, respectively.

We consider a two-dimensional airfoil at the angle of attack. Then:

l ‘ = 2 pvjcoc.

Now, think of this airfoil as being part of a wing. If the aircraft is slowing down in the landing process, then the velocity is decreasing. However, the lift must nearly equal the aircraft weight because the vertical acceleration is (hopefully) very small. This means that as the velocity decreases, the lift coefficient must increase (for constant wing area), which in turn means that the angle of attack must increase. This larger angle of attack may be dangerously close to the stalling angle, or at least result in an undesirable nose-up landing attitude. The alternative is a high-lift device—a flap—to generate a higher lift coefficient at the same angle of attack.

The effects of a 20 percent-chord simple split flap deflected 60° are shown in Fig. 5.26 for the NACA 0009 airfoil. Data points for this configuration are the inverted triangles. Tests were performed at a Re of R = 6.0 • 106. One set of tests was arried out with “standard roughness,” which indicates that the surface was not glass smooth as in most of the experiments. When the flap is deployed, the flow reacts as if the positive camber of the airfoil has increased. Because the flap is near the trailing edge, the effect of this increased camber is to make the angle of zero lift significantly larger in magnitude—in this case, aL0 = -12°—and thus to increase the lift coefficient at a particular geometric angle of attack. The value of the maximum lift coefficient (Clmax) also is increased; notice the significant increase in Clmax (i. e., from about 1.3 to 2.1 for this airfoil). The results show that changing the effective camber of the airfoil has a minor effect on lift-curve slope; the primary effects are the change in aL0 and the increased maximum lift coefficient. Figure 5.26 also indicates that the flap deflection causes the angle of stall to be reduced, but this reduction is not large enough to detract from the advantageous shift in the lift curve due to the larger negative-zero-lift angle.

In the case of differential deflection of the ailerons at the wing tips, the camber at one tip is increased while the camber at the other tip is decreased. Because the ailerons are placed in a high-sensitivity location near the trailing edge, and because they are situated near the tips of the wings with long lever arms about the fuselage axis, a small deflection of the ailerons is sufficient to cause a differential lift at the two wing tips that is large enough to roll the airplane.

There are many types of flaps (see Refs. 2-10). So-called slats located at the air­foil leading edge modify the airfoil camber and also force air tangentially along the upper surface of the airfoil, which delays airfoil stall. Devices located at the trailing edge are more effective than leading-edge devices (by about a factor of 3) because of the greater distance from the airfoil quarter-chord point. Flaps at the trailing edge may be single – or multi-element (e. g., a jet transport configured for landing). The geometry of the high-lift multi-element device provides an increase in camber and circulation, and the slots between the elements serve to duct high-pressure air from the lower surface to the upper surface of the flap, thereby delaying boundary-layer separation on the highly curved upper surface. These effects are discussed in detail in Chapter 8.

Agreement of Thin-Airfoil Theory with Experimental Data

The value of any theory lies in its ability to accurately predict physical behavior. Even if a theory is simple, it is worthless if it cannot provide results that satisfactorily agree with experimental data. Thin-airfoil theory is examined from this viewpoint in Figs. 5.26 and 5.3.

Agreement of Thin-Airfoil Theory with Experimental Data

Подпись: &
Подпись: ac

Подпись: M camber "О cp

Подпись: L
Подпись: Figure 5.24. Location of the center of pressure.

Figure 5.25. Simple cambered airfoil.

Figure 5.26 shows the results of wind-tunnel tests on a NACA 0009 airfoil, which is a symmetrical airfoil with a 9 percent thickness ratio. The theory developed in Sec­tion 5.4 predicts that the lift-curve slope is 2n (per radian) and that the moment about the aerodynamic center is zero. The zero-moment prediction is exactly satisfied by the data because the moment coefficient lies exactly on the axis (for angles of attack in the range of -14 to +14°). The lift-curve slope is about 8.9 percent less than the theoretical value. Notice that two sets of data are shown. The lift coefficient versus the angle of attack with flap deflected shows the marked effect of camber on features such as the moment coefficient and aLo. This important effect is discussed in the next section. Flaps are the principal mechanism for generating control forces on airplanes.

Agreement of Thin-Airfoil Theory with Experimental Data Подпись: for x < x1 for x > x1

Figure 5.3 shows similar test results for a cambered four-digit NACA airfoil of 15 percent thickness ratio. The predicted behavior of this NACA 4415 airfoil can be obtained by using the results in Section 5.4. Because thin-airfoil theory addresses only the camber function, this is the only airfoil information we need. From Glauert (1926), the mean-camber-line function is given by:

where, for the NACA 4415 airfoil, t = 0.04 (4 percent) and x1 = 0.4 (40 percent). After differentiating and performing the integration in Eqs. 5.24 and 5.25:

A0 = 0.06083 for, say, a = 4°

A1 = 0.16299

The student should verify this result. Then, from Eq. 5.26:

Ct = n(2A0 + A0 = 0.894.

Compare this result with the experimental results in Fig. 5.3; the agreement is excel­lent. The experimental data also indicate that depending on Re, the aerodynamic center for the NACA 4415 airfoil is located at:

0. 241 < x < 0.245.

c

We recall from Eq. 5.33 that thin-airfoil theory predicts the aerodynamic center to be at x/c = 0.25 for any arbitrary airfoil.

Thin-airfoil theory should not be applied to airfoils with too large a thickness ratio because it is based on a zero-thickness model. Nature provides assistance in this regard because increases in lift due to thickness effects—which are predicted by more accurate inviscid theories—are not fully realized in practical applications due to viscous effects.

EXAMPLE 5.1 Given: Consider a thin airfoil with a mean camber line given by the equation:

where h is the maximum camber.

Required: Find aLo, Cmac, and xCp.

Approach: Use the appropriate equations from Section 5.4:

Agreement of Thin-Airfoil Theory with Experimental Data

Solution:

Подпись: Hence, = dx to find Cm mac

=— cosф. Substitute in Eq. 5.25 to find Ax and A2; then, use Eq. 5.34

Agreement of Thin-Airfoil Theory with Experimental Data Подпись: nK c

. The result is:

Appraisal: The pitching moment is a restoring moment. Also, because the camber, z, has a length dimension, then K has a length dimension; when divided by the chord, the resulting moment is dimensionless, as it should be. For this airfoil with positive camber, the moment coefficient is negative, as it should be.

Center of Pressure

We recall that the center of pressure is the point about which the total moment is zero. To find the location of the center of pressure, move the couple to that point, as shown in Fig. 5.24, where ac is the aerodynamic center and the center of pressure, cp, is located a distance Ax downstream. For equilibrium, the total moment about the center of pressure must be zero. Thus,

L’Ax + Member = 0 ^ WAx + (CJcamber(qc2) = 0

Подпись: Solving:AX (Cm )camber = _ П *2 ~ A1

c CI 4 _ CL

Because the aerodynamic center was already found at the quarter-chord point, the nondimensional distance from the leading edge to the center of pressure is given by:

Подпись: (5.35)xcp _ 1 _П (A2 A) _ 1 _ ^mac

c 4 4 C. 4 C.

Notice that the location of the center of pressure changes with lift. Also, for small values of lift coefficient, the center of pressure may be downstream of the airfoil. Referring to Fig. 5.24, this is because the moment due to camber is a constant, depending only on geometry, so that as the L’ decreases, the lever arm Ax must become increasingly larger to balance the constant moment. The fixed aerodynamic center, then, is a more convenient reference point than the center of pressure, and the load system on an airfoil is described most conveniently by a lift force and a con­stant moment, both acting at the aerodynamic center.

This discussion concludes the mathematical development of the thin-airfoil theory. Important properties of arbitrary thin airfoils now can be evaluated with relative ease. Also, useful physical insight into the role of camber can be gained.

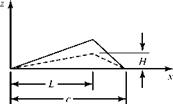
For example, consider a simple thin airfoil as shown in Fig. 5.25.

We let the maximum camber, H, be fixed and let the chordwise location of the maximum camber, L, vary. Applying the thin-airfoil solutions developed herein, we find that as the location of (fixed) maximum camber ratio H/c moves aft from 25 to 95 percent chord, the angle of zero lift (and, hence, the lift coefficient at an angle of attack) increases dramatically. The magnitude of the zero lift angle increases by about a factor of 5. A similar result is observed regarding the moment coefficient about the aerodynamic center as the maximum camber moves aft. This says, for instance, that flaps and aerodynamic controls that act to change the camber of a wing section should be located near the trailing edge where there is maximum sensitivity to changes in camber.

Aerodynamic Center

Aerodynamic Center

Other properties of the cambered airfoil may be determined as well. Recall that the aerodynamic center is the point on the airfoil about which the moment is indepen­dent of the angle of attack. Now, Eq. 5.31 may be written as:

1 2 2

and multiply through by — c, we find:

[ M ‘le 1 = – L’

a

The second equation implies that the integrated pressure force (i. e., the lift) effec­tively acts at the quarter-chord. Consider what happens at the quarter-chord point when the angle of attack changes and, consequently, Eq. 5.30 lift changes. Because the lift acts through the quarter-chord point, the lift-moment arm is zero. This means that as the lift changes, the moment due to lift at the quarter-chord point does not change. Thus, at the quarter-chord point the moment is independent of L’ and, there­fore, of the angle of attack.

It follows that for an arbitrary airfoil, the aerodynamic center is located at:

Xac = 4. (5-33)

This is the same result as for the symmetrical airfoil. However, the moment about the quarter chord is not zero as before; there now is a camber contribution to moment. Consider the case in which aa = 0 so that L’ = Cg = 0. Equation 5.32 states that for this case, the moment about the leading edge is not zero. This means that although the downward-directed integrated pressure force in the lift direction on the upper surface is equal and opposite to the upward directed integrated pressure force, in the lift direction on the lower surface (i. e., the net lift is zero), these two forces are not collinear. Then a net moment must be present. Recall from statics that two equal parallel forces that are opposite in sense and are not collinear are called a couple. Recall also that the moment of a couple is the same about any point in the plane. Thus, evaluate the zero-lift moment at the leading edge and then transfer it unchanged to the quarter-chord point to yield the moment about the aerodynamic center. From Eq. 5.76 for zero-lift coefficient,

(C"LE L,- 4 c = I( ^ * )■ (5.34)

Equation 5.34 represents the moment coefficient about the aerodynamic center whether or not the lift is zero, because the resultant lift force acts at the aerodynamic center and, hence, creates no moment about that point.