Category Basics of Aero – thermodynamics

Effect of Three-Dimensional Flow—Cross-Flow Instability

Three-dimensional boundary-layer flow is characterized by skewed boundary – layer profiles which can be decomposed into a main-flow profile and into a cross-flow profile, Fig. 7.1. With increasing cross flow, i. e., increasing three – dimensionality, the so-called cross-flow instability becomes a major instability and transition mechanism. This observation dates back to the early 1950s, when transition phenomena on swept wings became research and applica­tion topics [28]. It was found that the transition location with increasing sweep angle of the wing moves forward to the leading edge. The transition location then lies upstream of the location, which is found at zero sweep angle, and which is governed by Tollmien-Schlichting instability. Steady vor­tex patterns—initially visualized as striations on the wing’s surface—were observed in the boundary layer, with the vortex axes lying approximately parallel to the streamlines of the external inviscid flow, see, e. g., [52].

P. R. Owen and D. G. Randall proposed a criterion based on the properties of the cross-flow profile [54]. The cross-flow Reynolds number у reads with the notation used in Fig. 7.1:

у = P1’™*5* . (8.25)

Here v*max is the maximum cross-flow speed in the local cross-flow profile v*2(x3) and Sq a somewhat vaguely defined boundary-layer thickness found from that profile:

5 v*2

Sq = ~^—d, x3. (8.26)

If у ^ 175, transition due to cross-flow instability happens. If the main- flow profile becomes unstable first, transition will happen, in the frame of this ansatz, due to the Tollmien-Schlichting instability like in two-dimensional flow.

The phenomenon of cross-flow instability was studied so far mainly for low speed flow, see the discussion in, e. g., [11, 14]. Experimental and theoreti – cal/numerical studies have elucidated many details of the phenomenon. Local and especially non-local stability theory has shown that the disturbance wave vector lies indeed approximately normal to the external inviscid streamlines. The disturbance flow exhibits counter-rotating vortex pairs. Their superpo­sition with the mean flow results in the experimentally observed co-rotating vortices with twofold distance. The critical cross-flow disturbances have wave lengths approximately 2 to 4 times the boundary-layer thickness, compared to the critical Tollmien-Schlichting waves which have wave lengths approx­imately 5 to 10 times the boundary-layer thickness. This is the reason why non-parallel effects and surface curvature must be regarded, for which non­local stability methods are better suited than local methods.

The subsequent transition to turbulent flow can be due to a mixture of cross-flow and Tollmien-Schlichting instability. Typically cross-flow instabil­ity plays a role, if the local flow angle is larger than 30°. Tollmien-Schlichting instability comes into play earliest in the region of an adverse pressure gra­dient. However also fully cross-flow dominated transition can occur [55, 56]. For high-speed flow critical у data, however of questionable generality, have been established from dedicated experiments, see, e. g., [11, 14, 57].

Attachment-Line Contamination

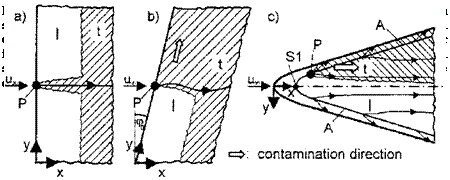
Consider transition in the boundary layer on a flat plate or on a wing of finite span. Instability will set in at a certain distance from the leading edge and downstream of it the flow will become fully turbulent by regular transition. If locally at the leading edge a disturbance is present,[137] the boundary layer can become turbulent just behind this disturbance. In that case a “turbulent wedge” appears in the otherwise laminar flow regime, with the typical half angle of approximately 7°, which downstream merges with the turbulent flow, Fig. 8.9 a). Only a small part of the laminar flow regime is affected.[138]

At the leading edge of a swept wing the situation can be very differ­ent, Fig. 8.9 b). A turbulent wedge can spread out in span-wise direction, “contaminating” the originally laminar flow regime between the disturbance location and the wing tip. On a real aircraft with swept wings it is the turbu­lent boundary layer of the fuselage which contaminates the otherwise laminar flow at the leading edge [28].

The low-speed flow criterion [50]

Подпись: (8.24)Attachment-Line Contamination
0.4sin

y/v{due/dx*)Le.

illustrates well the physical background. Here sin ^u^ is the component of the external inviscid flow along the leading edge in the span-wise (wing-tip) direction, due/dx*)le. the gradient of the external inviscid flow in direction normal to the leading edge at the leading edge, and v the kinematic viscosity. Experimental data show that Ree ^ 100 ± 20 is the critical value, and that for Ree ^ 240 “leading-edge contamination”, as it was termed originally, fully happens. (For a more detailed discussion see [28].)

We see from that criterion the following: the larger the external inviscid flow component in the span-wise (wing-tip) direction, and the smaller the accelera­tion of the flow normal to the leading edge, the larger the tendency of leading – edge, or more in general, attachment-line contamination. Otherwise only a tur­bulent wedge would show up from the location of the disturbance in the chord – wise direction, similar to that shown in Fig. 8.9 a), however skewed.

“Contamination” can happen on general attachment lines, for instance, on those at the lower side of a flat blunt-nosed delta wing or fuselage configu­ration, Fig. 8.9 c). If, for instance, the TPS of a RV has a misaligned tile lying on the attachment line, turbulence can be spread prematurely over a large portion of the lower side of the flight vehicle. This argument was brought for­ward by D. I.A. Poll [51] in order to explain transition phenomena observed on the Space Shuttle Orbiter during re-entry, see also the discussion in [14].

The effect of attachment-line contamination in this case would be— temporally, until further down on the trajectory the ordinary transition

occurs—large and asymmetric thermal loads, a drag increase (which is not a principle problem for a RV), but also a yaw moment, whose magnitude depends on size and location of the contaminated surface part.

Attachment-line contamination in high-speed flows was studied since the 1960s, see the overviews in [14] and [11]. Poll made an extensive study of attachment-line contamination at swept leading edges for both incompressible and compressible flows in the 1970s [52]. Today, still all prediction capabilities concerning attachment-line contamination rely on empirical data. See in this regard also [53].

Attachment-Line Instability

Primary attachment lines exist at the windward side of a flight vehicle with sufficiently flat lower side. At large angles of attack secondary and tertiary attachment lines can be present at the leeward side of the vehicle, Sub-Section

3.3.2, see also [28]. The canonical attachment line situation in aerodynamics corresponds to an attachment line along the leading edge of a swept wing with in the span-wise direction constant symmetric profile at zero angle of attack, or at the windward symmetry line of a circular cylinder at angle of attack or yaw.

At such attachment lines both inviscid and boundary-layer flow diverge symmetrically with respect to the upper and the lower side of the wing, respectively to the left and the right hand side of the cylinder at angle of attack [28]. The infinitely extended attachment line is a useful approximation of reality, which can be helpful for basic considerations and for estimations of flow properties. We have discussed flow properties of such cases in Section

7.2. We have noted that finite flow and hence a boundary layer exists in the direction of the attachment line.[136] This boundary layer can be laminar, transitional or turbulent. On the infinitely extended attachment line only one of these three flow states can exist.

The simplest presentation of an infinite swept attachment-line flow is the swept Hiemenz boundary-layer flow, which is an exact solution of the incompressible continuity equation and the Navier-Stokes equations [44]. The (linear) stability model for this flow is the Gortler-Hammerlin model, which in its extended form gives insight into the stability behavior of attachment-line flow, see, e. g., [45]. Attachment-line flow is the “initial condition” for the, however only initially, highly three-dimensional boundary-layer flow away from the attachment line to the upper and the lower side of the wing or cylinder (see above). The there observed cross-flow instability, see below, has recently been connected by F. P. Bertolotti to the instability of the swept Hiemenz flow [46].

An extension of these concepts to general supersonic and hypersonic attachment-line boundary layers would give the basis needed to under­stand instability and transition phenomena of these flows, including the attachment-line contamination phenomenon which we comment on in the following sub-section. We mention in this regard the recent investigations [47]-[49].

Effect of Nose Bluntness—Entropy-Layer Instability

Configurations of hypersonic flight vehicles have blunt noses in order to cope with the large thermal loads there. We have seen in Sections 1.2 and 7.2 that the nose radius is important regarding the efficiency of radiation cooling. Nose bluntness on the other hand is the cause of the entropy layer, Sub-Section

6.4.2. This entropy layer is a shear layer, which is or is not swallowed by the boundary layer, depending on the nose radius and the Reynolds number of the flow case.[135]

It is justified to surmise that the entropy layer can play a role in laminar – turbulent transition of the boundary layer over blunt bodies. Experimen­tal studies on slender cones have shown that this is the case, see, e. g., the overview and discussion in [11]. A small nose-tip bluntness increases the tran­sition Reynolds number relative to that for a sharp-nosed cone. However, if the bluntness is increased further, this trend is reversed, and the transition Reynolds number decreases drastically.

Cone blunting locally decreases the boundary-layer edge Reynolds num­ber, which partially explains the downstream movement of the transition lo­cation. The transition reversal is not yet fully understood, but entropy-layer instabilities appear to be a possible cause for it [39, 40].

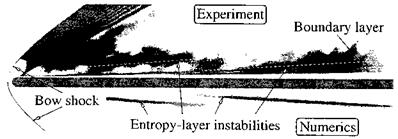
Recent experimental and theoretical studies by G. Dietz and S. Hein fur­ther support this view [41]. Their visualization of an entropy-layer instability on a flat plate with blunt leading edge is shown in Fig. 8.8. The oblique dark areas in the upper part indicate regions with large density gradients. These are most likely caused by instability waves in the entropy layer. If the entropy layer is swallowed, these disturbances finally are transported by con­vection into the boundary layer, where they interact with the boundary-layer disturbances.

Effect of Nose Bluntness—Entropy-Layer Instability

Fig. 8.8. Entropy-layer instability in the flow past a flat plate with blunt leading edge: density gradients in direction normal to the wall in a Schlieren picture (upper part), compared to those of the perturbed flow, which were numerically obtained (lower part) [41]. Ыж = 2.5, ReP = 9.9-106 m-1, adiabatic surface, angle of attack a = 0°. The broken white lines in the Schlieren picture are the computed locations with maximum dp/dy, p being the density eigenfunction.

Correlations of a large experimental data base regarding bluntness effects on flat plate transition are given in [42], where also effects of hypersonic viscous interaction, Section 9.3, are taken into account. A recent overview regarding work on entropy-layer instability can be found in [43].

Cone versus Flat-Plate Boundary-Layer Transition

The simplest way to take into account the shape of a slender configuration for stability and transition considerations is to approximate it by a conical configuration.

Considerable confusion arose around this approach [11]. Older experi­mental data had shown consistently that cone flow exhibits higher transition Reynolds numbers than planar flow, in any case for Mach numbers between 3 and 8 [11]. But stability analyses, first by L. M. Mack [36], and then by M. R. Malik [37], did show that disturbances grow slower on flat plates than on cones.

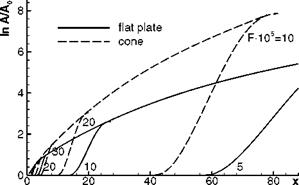
We illustrate this in Fig. 8.7 with results obtained with linear stability theory by A. Fezer and M. Kloker [38]. From these results, with small initial disturbance levels, one should expect that the transition Reynolds numbers on sharp cones are smaller than on flat plates.

Cone versus Flat-Plate Boundary-Layer Transition

Fig. 8.7. Transition on a flat plate and on a sharp 7° half-angle cone [38]: re­sults from linear stability theory show the different amplitude growths of individ­ual disturbance amplification curves and envelopes. In both cases Me = 6.8, Re’U = 5.72-106 m-1, Tw = 975 K, hypersonic viscous interaction being neglected, 2-d disturbances, various frequency parameters F.

This was indeed found with experiments in the “quiet tunnel” of NASA Langley, Sub-Section 8.3.2, at M = 3.5 [11]. However, at M = 8 K. F. Stetson found later (with cooled model surfaces) transition on the cone to occur— again—somewhat more downstream than on the flat plate. Different distur­bance levels and different instability phenomena on the cone and on the flat plate are the cause of the diverse observations. In [38] also spatial direct nu­merical simulation (DNS) was applied. For M= 6.8 and radiation-cooled surfaces the result was obtained that in principle the transition mechanisms work in the same manner on the cone and the flat plate. But on the cone fundamental breakdown is accelerated by the decreasing propagation angle of the secondary 3-D wave, while oblique breakdown probably is the dominant transition mechanism on the flat plate.[134]

A direct first-principle connection of these results and the results of linear stability theory to the different mean-flow patterns on a cone and a flat plate has not been established so far, although second-mode disturbances are tuned to the boundary-layer thickness [11]. On the cone the axisymmetric boundary layer is thinner than on the flat plate due to the Mangler effect, Section 7.2, and the streamlines in the boundary layer show a divergent (conical) pattern compared to the parallel flow on the flat plate. In addition we have, with the same free-stream conditions in both cases, a smaller boundary-layer edge Mach number and a larger edge unit Reynolds number on the cone than on the flat plate. We should note, however, that a conical vehicle configuration in reality will have a blunt nose.

Real Flight-Vehicle Effects

The infinitely thin flat plate is the canonical configuration of boundary-layer theory and also of stability and transition research. Basic concepts and fun­damental results are gained with and for the boundary-layer flow over it. However, we have seen in Section 7.2 that on real configurations, which first of all have finite length and volume, boundary-layer flow is influenced by a number of effects, which are not present in planar boundary layers on the flat plate. Regarding stability and transition, the situation is similar.

At CAV – and RV-configurations large flow portions exist, which are only weakly three-dimensional, see, e. g., the computed skin-friction line pat­terns in Figs. 7.8, 7.9, and 9.5. At such configurations appreciable three – dimensionality of the boundary layer is found usually only at blunt noses and leading edges, and at attachment and separation lines, see also [28].

This holds also for possible CAV’s with conical shape and for configura­tions, where the upper and the side faces are aligned with the free-stream flow (free-stream surfaces), and the lower side is a fully integrated ramp-like lift and propulsion surface, see, e. g., [35]. The lower sides of such, typically slender configurations exhibit more or less parallel flow between the primary attachment lines, Fig. 7.8. This is necessary—for airbreathing vehicles—in order to obtain an optimum inlet onset flow [1]. Of course on axisymmetric configurations at angle of attack and on spinning configurations the attached viscous flow is fully three-dimensional.

In the following sub-sections we discuss shortly—in a descriptive way, in general without giving results of more recent investigations—the influence of the most important real flight-vehicle effects on stability and transition. In Section 8.3 receptivity issues regarding surface and free-stream properties are treated. Other possible real-vehicle effects like noise of the propulsion system transmitted through the airframe and dynamic aeroelastic surface deformations (vibrations, panel flutter) are difficult to assess quantitatively. To comment on them is not possible in the frame of this book.

The Influence of the Mach Number and the Thermal State of the Surface

The original formulation of stability theory for compressible flow of L. Lees and C. C. Lin, [30], with the generalized point of inflection, led to the result that sufficient cooling can stabilize the boundary layer in the whole Reynolds and Mach number regime of flight [32].

This was an interesting finding, which could help to reduce the thermal load and drag problems of CAV’s, because such vehicles fly with cryogenic fuel. An appropriate layout of the airframe surface as heat exchanger would combine both cooling of the surface and stabilization of the attached laminar viscous flow past it. This would be possible even for flow portions with ad­verse stream-wise pressure gradient, because, as we can see from eq. (7.53), the influence of the pressure-gradient term can be compensated by sufficiently strong cooling. If then the flow past the flight vehicle would not become tur­bulent, the heating and drag increments due to the occurrence of transition, see Figs. 7.10 and 7.11, could be avoided.

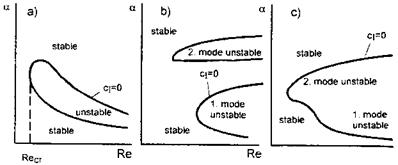
Unfortunately this conclusion is not true. It was shown almost two decades later by L. M. Mack, [21], see also [18, 25], and the discussion in [13, 14], that for МГе1 > 1 higher modes (the so-called “Mack modes”) appear, which cannot be stabilized by cooling, in contrary, they are amplified by it. The first of these higher modes, the “second mode”—if the low-speed mode is called first mode—in general is of largest importance at high boundary-layer edge Mach numbers, because it is most amplified.[132] For an adiabatic, flat-plate boundary-layer higher modes appear at edge Mach numbers larger than Me « 2.2. At Me ^ 4 the second mode has a frequency low enough to definitely influence the instability behavior. This result is illustrated qualitatively in Fig. 8.4 for a boundary layer on an adiabatic flat plate.

At Me = 0, case a), only the classical (first) instability mode of incom­pressible flow exists. At Me = 4.5, case b), a second instability mode has appeared, which at Me = 5.8 has merged with the first mode.

If the wall is cooled, the second mode can become important already at low supersonic Mach numbers. The significant finding of Mack was that the second mode is amplified by cooling, whereas the first mode is damped by it.

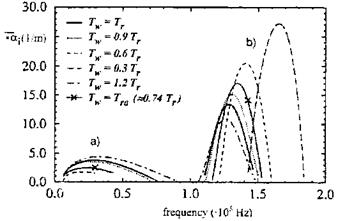
We show this effect with numerical results of E. Kufner in Fig. 8.5 [34], see also the experimental result of S. Willems and A. Gulhan in Section 10.6.

Kufner studied the dependence of the spatial amplification rates ai of the first and the second instability mode on the thermal state of the surface— the wall temperature Tw and implicitly the temperature gradient in the gas

The Influence of the Mach Number and the Thermal State of the Surface

Fig. 8.4. Temporal stability charts of the boundary layer at an adiabatic flat plate for different boundary-layer edge Mach numbers (cI = cQ. Qualitative presentation of the results of Mack, following Reshotko [13]: a) Me = 0, b) Me = 4.5, c) Me = 5.8.

The Influence of the Mach Number and the Thermal State of the Surface

Fig. 8.5. Influence of the wall temperature Tw on the spatial amplification rates of a) the first, and b) the second instability mode in the boundary layer at a blunt 7° half-angle cone at M= 8, Re^ = 3.28-106 m-1, T^ = 54.35 K, a = 0°, location: S ~ 175 Rn ~ 667 mm [34]. Tr is the recovery, Tra the radiation-adiabatic wall temperature.

normal to the cone’s surface dT/dngw. The case is the Ыж = 8 flow past a blunt cone (Stetson cone) with opening half-angle Фс = 7 ° and nose radius Rn = 3.81 mm. The location S is measured from the nose point along the generatrix of the cone surface.

The first instability mode, a), on the left-hand side of the figure (always the result for the wave angle with maximum amplification is given), exhibits the classical result, that with cooling, i. e., a wall temperature lower than the recovery temperature (Tw < Tr), the amplification rate is reduced and the maxima are shifted to smaller frequencies. This alone would lead to the

transition pattern indicated for increasing Mach number in Fig. 8.1, which is characterized by a widened and flattened transitional branch. In contrast to this, the second instability mode, b), on the right-hand side of the figure, is strongly amplified by cooling, with a shift of the maxima towards larger frequencies.[133]

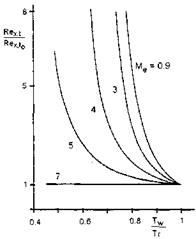
It was noted above that for sufficiently small external disturbance levels transition is governed directly by linear instability. Regarding the influence of the thermal state of the surface on the instability and transition behavior of the boundary layer, this appears to be corroborated by data of F. Vignau, Fig. 8.6, see [14].

The Influence of the Mach Number and the Thermal State of the Surface

Fig. 8.6. Results of a numerical study of the influence of wall cooling on the flat – plate transition Reynolds number at different boundary-layer edge Mach numbers Me. Rex, t is the transition Reynolds number at a given wall temperature, Rex, t0 that at the adiabatic wall, Tw the wall temperature, and Tr the adiabatic wall temperature.

Results of the application of the en – method, a semi-empirical transition – prediction method, see Sub-Section 8.4.2, to flat-plate flow are in fairly good agreement with experimental trends. Fig. 8.6 shows the ratio of ‘transition Reynolds number at given wall temperature’ to ‘transition Reynolds number at the adiabatic wall’, Rex, t/Rex, t0, as function of the ratio ‘wall temper­ature’ to ‘adiabatic wall temperature’, Tw/Tr, for different boundary-layer edge Mach numbers Me.

The transition Reynolds number Rex, t for Me ^ 3 becomes progressively larger with smaller Tw/Tr. This is due to the reduction of the growth rate of the first instability mode, which is the only mode present at Me ^ 3. The boundary layer with surface cooling appears to be almost fully stabilized. For Me ^ 3 the transition Reynolds number Rex, t reacts less strongly on the decreasing wall temperature, because now the second instability mode exists which becomes amplified with wall cooling. For Me = 7 wall cooling has no more an effect. Although the use of a constant n = 9 in this study can be questioned, it illustrates well the influence of wall cooling on the transition behavior of a flat-plate boundary layer with hypersonic edge flow Mach numbers.

Inviscid Stability Theory and the Point-of-Inflection Criterion

Inviscid stability theory gives insight into instability mechanisms with the point-of-inflection criterion, which follows from the Rayleigh equation. It says basically, [15, 24], that the presence of a point of inflection is a sufficient condition for the existence of amplified disturbances with a phase speed 0 й cr й ue. In other words, the considered boundary-layer profile u(y) is unstable, if it has a point of inflection:[129]

d? u

v=° (8Л9)

lying in the boundary layer at yip

0 <yip й S. (8.20)

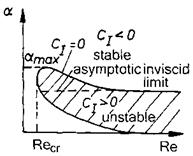
The stability chart of a boundary layer with a point-of-inflection of u(y) deviates in a typical way from that without a point of inflection. We show such a stability chart in Fig. 8.3.

For small Re the domain of instability has the same form as for a boundary layer without point of inflection, Fig. 8.2. This is the viscous instability part of the chart. For large Re its upper boundary reaches an asymptotic inviscid

Inviscid Stability Theory and the Point-of-Inflection Criterion

Fig. 8.3. Schematic of a temporal stability chart of a boundary-layer with inviscid instability (ci = Ci) [27].

limit at finite wave number a. For large Re the boundary layer thus remains unstable.

When does a boundary-layer profile have a point of inflection? We re­member Fig. 7.4 and Table 7.1 in Sub-Section 7.1.5. There the results of the discussion of the generalized wall-compatibility conditions, eqs. (7.53) and (7.54), are given. We treat here only the two-dimensional case, and recall that a point of inflection exists away from the surface at ypoi > 0, if the second derivative of u(y) at the wall is positive: d2u/dy2w > 0. In a Blasius boundary layer, the point of inflection lies at y = 0.

With the help of Table 7.1 we find:

— A boundary layer is destabilized by an adverse pressure gradient (dp/dx > 0), by heating,[130] i. e., a heat flux from the surface into the boundary layer (dTw/dygw < 0) and by blowing (normal injection [28]) through the surface (vw > 0).

The destabilization by an adverse pressure gradient is the classical interpre­tation of the point-of-inflection instability. Regarding turbulent boundary layers on bodies of finite length and thickness, it can be viewed in the following way: downstream of the location of the largest thickness of the body we have dp/dx > 0, hence a tendency of separation of the laminar boundary layer. Point-of-inflection instability signals the boundary layer to become turbulent, i. e., to begin the lateral transport of momentum (in general also of energy and mass, the latter in gas mixtures in chemical non-equilibrium) by turbulence fluctuations towards the body surface.

The ensuing time-averaged turbulent boundary-layer profile is fuller than the laminar one, Fig. 7.5, which reduces the tendency of separation.[131]

Although the skin-friction drag increases, the total drag remains small, because the pressure or form drag remains small. The flat-plate boundary layer is a special case, where this does not apply.

If an adverse pressure gradient is too strong, the ordinary transition sequence will not happen. Instead the (unstable) boundary layer separates and forms a usually very small and flat separation bubble. At the end of the bubble the flow re-attaches then turbulent (separation-bubble transition, see, e. g., [15] and [29] with further references).

— An air boundary layer is stabilized by a favorable pressure gradient (dp/dx < 0), by cooling, i. e., a heat flux from the boundary layer into the surface (dTw/dygw > 0) and by suction through the surface vw < 0.

Подпись: cl dy Подпись: du P dry Подпись: Vs Inviscid Stability Theory and the Point-of-Inflection Criterion Подпись: Vs Подпись: 0 ys > yo, Подпись: (8.21)

These results basically hold also for hypersonic boundary layers. Stability theory there deals with a generalized point of inflection [30]:

and with even more generalized (doubly generalized) forms, which take into account the metric properties of the body surface, see, e. g., [31].

Подпись: u ue Inviscid Stability Theory and the Point-of-Inflection Criterion Подпись: (8.22)

A sufficient condition for the existence of unstable disturbances is the presence of the point of inflection at ys > yo. Here y0 is the point at which

Further it is required that the “relative Mach number” [25]

c

Mrel = M – – (8.23)

a

is subsonic throughout the boundary layer. In fact, the condition is МГе1 < 1. Here M is the local Mach number (M = u/a), c is the phase velocity of the respective disturbance wave which is constant across the boundary layer (c = c(y)), and a = a(y) is the local speed of sound.

The physical interpretation of the generalized point of inflection is [30]:

— (тілі) > 0: energy is transferred from the mean flow to the disturbance, the boundary-layer flow is unstable (sufficient condition),

Подпись: — < 0: energy is transferred from the disturbance to the meand ( _1_ du ‘

dy T dy /

flow, the boundary-layer flow is stable,

~§y (т^у) = 0- no energy is transferred between disturbance and mean flow, the boundary-layer flow is neutrally stable.

A systematic connection of the generalized point of inflection to the sur­face flow parameters, as we established above for incompressible flow, is pos­sible in principle, but not attempted here. Important is the observation that
the distribution of the relative Mach number Mrel(y) depends also on the wall temperature. The thermal state of the surface is an important parame­ter regarding stability or instability of a compressible boundary layer.

Outline of Stability Theory

We sketch now some features of linear stability theory. This will give us insight into the basic dependencies of instability but also of transition phenomena [15, 23, 24]. Of course, linear stability theory does not explain all of the many phenomena of regular transition which can be observed. It seems, however, that at a sufficiently low external disturbance level linear instability is the primary cause of regular transition [12, 18].

For the sake of simplicity we consider only the two-dimensional incom­pressible flat-plate case (Tollmien-Schlichting instability) with due detours to our topic, instability and transition in high-speed attached viscous flow. The basic approach and many of the formulations, e. g., concerning temporally and spatially amplified disturbances, however are the same for both incom­pressible and compressible flow [25, 26]. Our notation is that given in Fig. 4.1.

Tollmien-Schlichting theory begins with the introduction of split flow pa­rameters q = q + q’ into the Navier-Stokes equations and their linearization (q denotes mean flow, and q’ disturbance flow parameters). It follows the as­sumption of parallel boundary-layer mean flow, i. e., v = 0.[125] The consequence is du/dx = 0. Hence in this theory only a mean flow u(y) is considered, with­out dependence on x. Therefore we speak about linear and local stability theory. The latter means that only locally, i. e., in locations x on the surface under consideration, which can be chosen arbitrarily, stability properties of the boundary layer are investigated.[126]

The disturbances q’ are then formulated as sinusoidal disturbances:

q'(x, y,t) = q’A (y)ei(ax-uf). (8.3)

Here qA (y) is the complex disturbance amplitude as function of y, and a and ш are parameters regarding the disturbance behavior in space and time. The complex wave number a is with і = %/—1

Подпись:Подпись: (8.5)a — ar + iai,

with

2n

ar T J ^x

Xx being the length of the disturbance wave propagating in x-direction. The complex circular frequency ш reads

ш — шг + іші, (8.6)

with

шг — 2nf, (8.7)

f being the frequency of the wave.

The complex phase velocity is

c = cr + ісі = (8-8)

a

Temporal amplification of an amplitude A is found, with a real-valued, by

1 dA d

Alt=M(lnA)=U,‘ = a’’C‘- (8’9)

and spatial amplification by

1 dA d

я*г-г(М4>—(8Л0)

with ш real-valued.

We see that a disturbance is amplified, if ші > 0, or ai < 0. It is damped, if ші < 0, or ai > 0, and neutral, if ші — 0, or ai — 0.

Подпись: m Ao Подпись: e *0 Подпись: (8.11)

The total amplification rate in the case of temporal amplification follows from eq. (8.9) with

and in the case of spatial amplification from eq. (8.10) with

Подпись:A(-T) = ei:0(-^)dx

Ao

Подпись: m An Outline of Stability Theory Подпись: (8.13)

If we assume ші or —ai to be constant in the respective integration inter­vals, we observe for the amplified cases from these equations the unlimited exponential growth of the amplitude A which is typical for linear stability theory with

Подпись: A(x) Ao Подпись: e-aix Подпись: (8.14)

and

respectively.

With the introduction of a disturbance stream function Ф'(x, y,t), where Ф(у) is the complex amplitude:

Ф’ (x, y,t) = Ф(у)еі(ах-Wt) (8.15)

into the linearized and parallelized Navier-Stokes equations finally the Orr – Sommerfeld equation is found:[127]

Подпись:-^-(фуууу-ОаЧуу+аЧ). (8.16)

The properties of the mean flow, i. e., the tangential boundary-layer ve­locity profile, appear as u(y) and its second derivative uyy(y) = d2u/dy2(y). The Reynolds number Res on the right-hand side is defined locally with boundary-layer edge data and the boundary-layer thickness A[128]

Reg = (8.17)

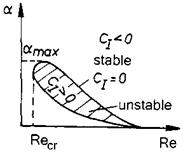
Obviously stability or instability of a boundary layer depend locally on the mean-flow properties u(y), uyy(y), and the Reynolds number Res. A typical stability chart is sketched in Fig. 8.2. The boundary layer is temporally unstable in the hatched area (ci > 0, see eq. (8.9)) for 0 < a A amax and Re A Recr, Recr being the critical Reynolds number. For Re ^ Recr we see that the domain of instability shrinks asymptotically to zero, the boundary layer becomes stable again.

For large Res the right-hand side of eq.(8.16) can be neglected which leads to the Rayleigh equation

(u — с)(Фуу — a2 Ф) — у, ууФ = 0. (8.18)

Outline of Stability Theory

Fig. 8.2. Schematic of a temporal stability chart of a boundary layer at a flat plate (ci = a) [27].

Stability theory based on this equation is called “inviscid” stability theory. This sometimes is wrongly understood. Of course, only the viscous terms in the Orr-Sommerfeld equation are neglected, but stability properties of viscous flow can properly be investigated with it, except, of course, for the plain classical incompressible flat-plate flow.

Some Basic Observations

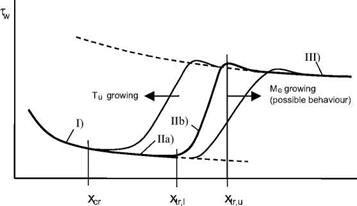
We consider laminar-turbulent transition of the two-dimensional boundary layer over a flat plate as prototype of regular transition, and ask what can be observed macroscopically at the plate’s surface. We study the qualitative behavior of wall shear stress along the surface, Fig. 8.1.[120] We distinguish three branches of tw. The laminar branch (I) is sketched in accordance with tw ж x-0’5, and the turbulent branch (III) with tw ж x-0’2, Table 7.5. We call the distance between xcr and xtr, u the transitional branch (II). In consists of the instability sub-branch (IIa) between xcr and xtr, i, and the transition sub-branch (IIb) between xtr>l and xtr, u. The instability sub-branch overlaps with the laminar branch (see below).

In Fig. 8.1 xcr denotes the point of primary instability (critical point). Upstream of xcr the laminar boundary layer is stable, i. e., a small distur­bance introduced into it will be damped out. At xcr the boundary layer is

Some Basic Observations

Fig. 8.1. Schematic of the behavior of the wall shear stress tw in flat-plate boundary-layer flow undergoing laminar-turbulent transition: I) laminar branch, II) transitional branch with IIab) instability sub-branch and IIb) transition sub­branch, and III) turbulent branch of the boundary layer. xcr is the location of primary instability, xtr, i the “lower” and xtr, u the “upper” location of transition.

neutrally stable, and downstream of it is unstable. Disturbances there trigger Tollmien-Schlichting waves (normal modes of the boundary layer) whose am­plitudes grow rather slowly.[121] Secondary instability sets in after the Tollmien – Schlichting amplitudes have reached approximately 1 per cent of ue, i. e., at amplitudes where non-linear effects are still rather small regarding the (pri­mary) Tollmien-Schlichting waves. Finally turbulent spots appear and the net-production of turbulence begins (begin of sub-branch IIb). This location is the “lower” location of transition, xtr, i. At the “upper” location of transi­tion, xtr, u, the boundary layer is fully turbulent.[122] This means that now the turbulent fluctuations transport fluid and momentum towards the surface such that the full time-averaged velocity profile shown in Fig. 7.5 b) develops. The picture in reality appears not to be that simple [19]. It seems that this location still lies in the intermittence region Ax’tr (see below), where the intermittency factor is approximately 0.5.

The length of the transition region, related to the location of primary instability, can be defined either as:

Axtr xtr, l xcr 1 (8.1)

or as

Axtr — xtr, u xcr • (8.2)

One has to bear this in mind when using empirical and semi-empirical stability/transition criteria, Sub-Section 8.4.2.

In Fig. 8.1 some important features of the transition region are indicated:

— In the instability sub-branch (Ila) between xcr and xtr>l the time-averaged (“mean”) flow properties practically do not deviate from those of laminar flow (branch I). This basic feature permits the formulation of stability and in particular transition criteria and models based on the properties of the laminar flow branch. This is of very large importance for practical instability and transition predictions, the latter still based on empirical or semi-empirical models and criteria.

— The transition sub-branch (IIb) (intermittency region), i. e., Ax’tr — xtr, u — xtr, i, usually is very narrow.[123] It is characterized by the departure of tw from that of the laminar branch and by its joining with that of branch III. For boundary-layer edge flow Mach numbers Me A 4 to 5 the (tempo­ral) amplification rates of disturbances can decrease with increasing Mach number, therefore a growth of Ax’tr is possible. In such cases transition criteria based on the properties of the laminar flow branch would become questionable. The picture in reality, however, is very complicated, as was shown first by Mack in 1965 [18, 21]. We will come back to that later.

— At the end of the transitional branch (II), xtr, u, the wall shear stress over­shoots shortly that of the turbulent branch (III).[124] This overshoot occurs also for the heat flux in the gas at the wall. At a radiation-adiabatic sur­face this overshoot can lead to a hot-spot situation relative to the nominal branch III situation.

— With increasing disturbance level, for example increasing free-stream tur­bulence Tu in a ground-simulation facility, the transition sub-branch (IIa) will move upstream while becoming less narrow, see, e. g., [22]. When dis­turbances grow excessively and transition becomes forced transition, tran­sition criteria based on the properties of the laminar flow branch (I) become questionable in this case, too.

— In general it can be observed, that boundary-layer mean flow properties, which destabilize the boundary layer, see Sub-Section 8.1.3, shorten the length of sub-branch IIa (xtr, i — xcr) as well as that of sub-branch IIb (xtr, u — xtr l). The influence of an adverse stream-wise pressure gradient is most pronounced in this regard. If the mean flow properties have a stabilizing effect, the transition sub-branches IIa and IIb become longer.