Category MECHANICS. OF FLIGHT

Induced drag

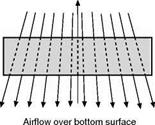
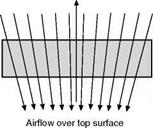
Experiments with smoke or streamers show quite clearly that the air flowing over the top surface of a wing tends to flow inwards (Fig. 3.27, overleaf). This is because the decreased pressure over the top surface is less than the pressure outside the wing tip. Below the under-surface, on the other hand, the air flows outwards, because the pressure below the wing is greater than that outside the

Induced drag

Induced drag

Fig. 3.26 Aspect ratio

The area of each wing is 12 m2.

wing tip. Thus there is a continual spilling of the air round the wing tip, from the bottom surface to the top. Perhaps the simplest way of explaining why a high aspect ratio is better than a low one is to say that the higher the aspect ratio the less is the proportion of air which is thus spilt and so is ineffective in providing lift – the less there is of what is sometimes called ‘tip effect’ or ‘end effect’.

When the two airflows, from the top and bottom surfaces, meet at the trailing edge they are flowing at an angle to each other and cause vortices rotating clockwise (viewed from the rear) from the left wing, and anti-clock­wise from the right wing. All the vortices on one side tend to join up and form one large vortex which is shed from each wing tip (Fig. 3.28). These are called wing-tip vortices.

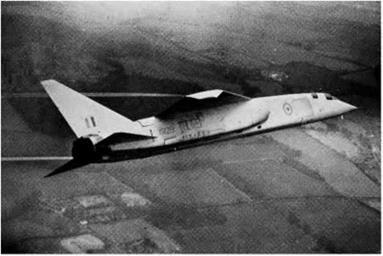
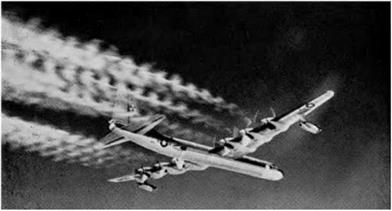
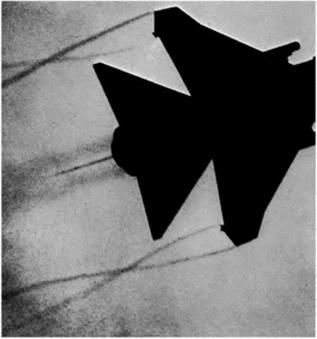
All this is happening every time and all the time an aeroplane is flying, yet some pilots do not even know the existence of such vortices. Perhaps it is just as well, perhaps it is a case of ignorance being bliss. In earlier editions of this book it was suggested that if only pilots could see the vortices, how they would talk about them! Well, by now most pilots have seen the vortices or, to be more correct, the central core of the vortex, which is made visible by the condensa­tion of moisture caused by the decrease of pressure in the vortex (Figs ЗА and 3B, overleaf). These visible (and sometimes audible!) trails from the wing tips should not be confused with the vapour trails caused by condensation taking place in the exhaust gases of engines at high altitudes (Fig. 3C, overleaf).
Induced drag
Induced drag

Now if you consider which way these vortices are rotating you will realise that there is an upward flow of air outside the span of the wing and a down-

ward flow of air behind the trailing edge of the wing itself. This means that the net direction of flow past a wing is pulled downwards. Therefore the lift – which is at right angles to the airflow – is slightly backwards, and thus con­tributes to the drag (Fig. 3.29). This part of the drag is called induced drag.

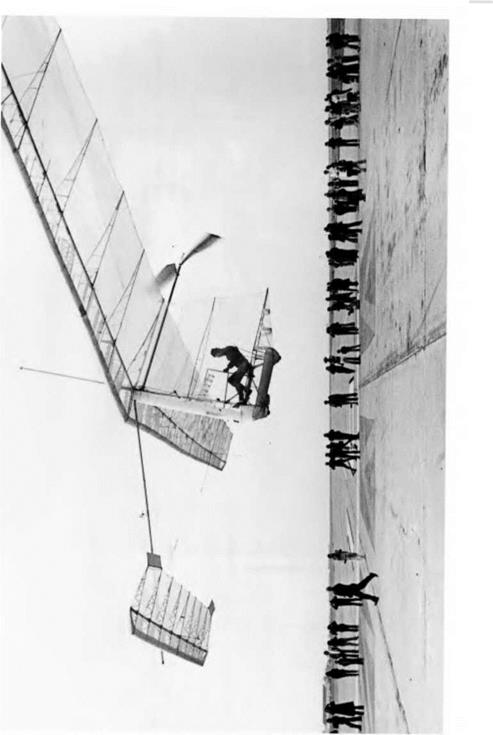
In a sense, induced drag is caused by the lift; so long as we have lift we must have induced drag, and we can never eliminate it altogether however cleverly the wings are designed. But the greater the aspect ratio, the less violent are the wing-tip vortices, and the less the induced drag. If we could imagine a wing of infinite aspect ratio, the air would flow over it without any inward or outward deflection, there would be no wing-tip vortices, no induced drag. Clearly such a thing is impossible in practical flight, but it is interesting to note that an aero­foil in a wind tunnel may approximate to this state of affairs if it extends to the wind-tunnel walls at each side, or outside the jet stream in an open jet type of tunnel. The best we can do in practical design is to make the aspect ratio as large as is practicable. Unfortunately a limit is soon reached – from the struc­tural point of view. The greater the span, the greater must be the wing strength, the heavier must be the structure, and so eventually the greater weight of structure more than counterbalances the advantages gained. Again it is a question of compromise. In practice, aspect ratios for flight at subsonic speeds vary from 6 to 1 up to about 10 to 1 for ordinary aeroplanes, but con­siderably higher values may be found on sailplanes, and even more in man-powered aircraft, where aerodynamic efficiency must take precedence over all other considerations (see Fig. 3D, later) and very low values for flight

Induced drag

Fig ЗА Wing-tip vortices

(By courtesy of the former British Aircraft Corporation, Preston)

The low pressure at the core of the vortex causes a local condensation fog on a damp day.
Induced drag

Fig 3B Rolling up of vortices

(By courtesy of the former British Aircraft Corporation, Preston)

A unique demonstration of the rolling up process; the wing tip and flap tip are each shedding vortices that are strong enough to cause condensation, and the pair roll around one another.

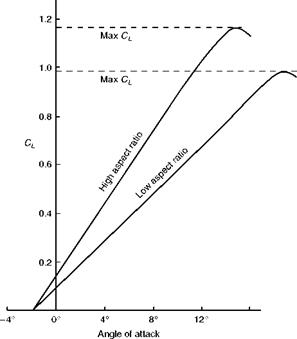
at transonic and supersonic speeds (see Fig. 3E, later). Fig. 3.30 shows how aspect ratio affects the lift curve, not only in the maximum value of CL but in the slope of the curve, the stalling angle actually being higher with low values of aspect ratio. Notice that the angle of no lift is unaffected by aspect ratio.

The theory of induced drag can be worked out mathematically and experi­ment confirms the theoretical results. The full calculation involved would be
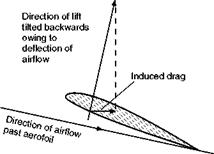
Induced dragDirection of airflow at a distance from aerofoil

Induced drag

Fig3C Exhaust trails

(By courtesy of General Dynamics Corporation, USA)

A modified B36 with 6 piston engines and 4 jet engines, and carrying an atomic reactor as an experiment on the shielding of crews and aircraft components.

Induced drag

out of place in a book of this kind, but the answer is quite simple and the reader may like to know it, especially since it helps to give a clearer impression of the significance of this part of the drag.

The coefficient of induced drag is found to be Cl2//tA for wings with an elliptical planform, where A is the aspect ratio and CL the lift coefficient (the value for tapered wings may be 10 per cent to 20 per cent higher, depending on the degree of taper). This means that the actual drag caused by the vortices is (Cl2//tA) .jpV2 . S, but since the TpV2 . S applies to all aerodynamic forces, it is sufficient to consider the significance of the coefficient, Cl2//tA . In the first place, the fact that A is underneath in the fraction confirms our previous statement that the greater the aspect ratio, the less the induced drag; but it tells us even more than this, for it shows that it is a matter of simple proportion: if the aspect ratio is doubled, the induced drag is halved. The significance of the CL2 is perhaps not quite so easy to understand. CL is large when the angle of attack is large, that is to say when the speed of the air­craft is low; so induced drag is relatively unimportant at high speed (probably less than 10 per cent of the total drag), more important when climbing (when it becomes 20 per cent or more of the total) and of great importance for taking off (when it may be as high as 70 per cent of the total). In fact, the induced drag is inversely proportional to the square of the speed, whereas all the remainder of the drag is directly proportional to the square of the speed.

It is easy to work out simple examples on induced drag, e. g. – A monoplane wing of area 36 m2 has a span of 15 m and chord of 2.4 m. What is the induced drag coefficient when the lift coefficient is 1.2?

Aspect ratio = A = 15/2.4 = 6.25

Induced drag coefficient = Cl2//tA 5 1.22/6.25/r = 0.073

Perhaps this does not convey much to us, so let us work out the actual drag involved, assuming that the speed corresponding to a CL of 1.2 is 52 knots, i. e. 96 km/h (26.5 m/s), and that the air density is 1.225 kg/m3.

Induced drag = (Cl2//tA ) . іpV2 . S

= 0.073 X і X 1.225 X 26.52 X 36 2

= 1130 N

Fig 3D High aspect ratio (opposite)

(By courtesy of Paul MacCready)

The Gossamer Condor. Flight on one man-power requires a very high value of lift/drag.

Induced drag

Let us take it even one step further and find the power required to overcome this induced drag –

Power = DV = 1130 3 26.5 = 30 kW (about 40 horse-power).

This example will help the reader to realise that induced drag is something to be reckoned with; it is advisable to work out similar examples, which will be found at the end of the book.

Aspect ratio

We have so far only considered aerofoils from the point of view of their cross- section, and we must now consider the effect of the plan form. Suppose we have a rectangular wing of 12 m2 plan area; it could be of 6 m span and 2 m chord, or 8 m span and 1.5 m chord, or even 16 m span and 0.75 m chord. In each case the cross-sectional shape may be the same although, of course, to a different scale, depending on the chord. Now according to the conclusions at which we have already arrived, the lift and drag are both proportional to the area of the wing, and therefore since all of these wings have the same area they should all have the same lift and drag. Experiments, however, show that this is not exactly true and indicate a definite, though small, advantage to the wings with larger spans, both from the point of view of lift and lift/drag ratio.

The ratio span/chord is called aspect ratio (Fig. 3.26), and the aspect ratios of those wings which we have mentioned are therefore 3, 5.33 and 21.33 respectively, and the last one, with its ‘high aspect ratio’, gives the best results (at any rate at subsonic speeds which is what we are concerned with in this chapter). Why? It is a long story, and some of it is beyond the scope of this book; but the reader has the right to ask for some sort of explanation of one of the most interesting and, in some ways, one of the most important, prob­lems of flight. So here goes!

Design and nomenclature of aerofoil sections

In the early days, in fact until the late 1930s, very few aerofoil shapes were suggested by theory; the usual method was to sketch out a shape by eye, give it a thorough test and then try to improve on it by slight modifications. As a result of this method we had a mass of experimental data obtained under varying conditions in the various wind tunnels of the world. The results were interpreted in different ways, and several systems of units and symbols were used, so that it was difficult for the student or aeronautical engineer to make use of the data available.

It is true that this hit-and-miss method of aerofoil design produced a few excellent sections but it was gradually replaced by more systematic methods. The first step in this direction was to design and test a ‘family’ of aerofoils by taking a standard symmetrical section and altering the curvature, or camber, of its centre line. An early example of this resulted in the RAF series of aero­foils in the UK (RAF referred to the Royal Aircraft Factory). In Germany similar investigations were made with series named after the Gottingen Taboratory, and in America with the Clark Y series.

Tater sections have been based on theoretical calculations but, whatever the basis of the original design, we still rely on wind tunnel tests to decide the qualities of the aerofoil.

The naming and numbering of sections has also been rather haphazard. At first the actual number, such as RAF 15, meant nothing except perhaps that it was the 15th section to be tried. But the National Advisory Committee for Aeronautics in America soon attempted to devise a system whereby the letters and numbers denoting the aerofoil section served as a guide to its main fea­tures; this meant that we could get a good idea of what the section was like simply from its number. Unfortunately the system has been changed from time to time, and this has caused confusion; while the modern tendency to have more figures and letters in a number has resulted in such complication that the student finds it more difficult to get information about the section from the number than he did with some of the earlier ones. However since NACA sections, or slight modifications of them, are now used by nearly every country in the world, the reader may be interested in getting some idea of the systems.

The geometric features that have most effect on the qualities of an aerofoil section are –

(a) the camber of the centre line;

(b) the position of maximum camber;

(c) the maximum thickness, and variation of thickness along the chord;

and, perhaps rather surprisingly –

(d) the radius of curvature of the leading edge;

(e) whether the centre line is straight, or reflexed near the trailing edge; and the angle between the upper and lower surfaces at the trailing edge.

The NACA sections designed for comparatively low speed aircraft are based on either the four – or five-digit system; laminar flow sections for high subsonic speeds on the 6, 7 or 8 systems (the 6, 7 or 8 being the first figure, not the number of digits).

In each system there are complicated formulae for the thickness distri­bution, the radius of the leading edge and the shape of the centre line, but we need not worry about these; what is easier to understand is the meaning of the digits or integers, for instance, in the four-digit system –

(a) the first digit gives the maximum camber as a percentage of the chord;

(b) the second digit gives the position of the maximum camber, i. e. distance from the leading edge, in tenths of the chord;

(c) the third and fourth digits indicate the maximum thickness as a percentage of the chord.

Thus NACA 4412 has a maximum camber of 4 per cent of the chord, the pos­ition of this maximum camber is 40 per cent of the chord back, and the maximum thickness is 12 per cent of the chord. In a symmetrical section there is of course no camber so the first two digits will be zero; thus NACA 0009 is a symmetrical section of 9 per cent thickness.

Notice that these are all geometric features of the section, but in later systems attempts are made to indicate also some of the aerodynamic charac­teristics, for instance, in the five-digit system –

(a) the ‘design lift coefficient’ (in tenths) is three-halves of the first digit;

(b) the second and third digits together indicate twice the distance back of the maximum camber, as a percentage of the chord;

(c) and the last two once again the maximum thickness.

The ‘design lift coefficient’ is the lift coefficient at the angle of attack for normal level flight, usually at about 2° or 3°.

Most of these sections have a 2 per cent camber, and in fact there is some relationship between the design lift coefficient and the maximum camber which has sometimes led to confusion about the meaning of the first digit; also the point of maximum camber is well forward at 15 per cent, 20 per cent or 25 per cent of the chord (which accounts for the doubling of the second and third digits to 30, 40 or 50). In fact the most successful, and so the most common of these sections, begins with the digits 230, followed by the last two indicating the thickness. Thus NACA 23012, as used on the Britten-Norman Islander, has a design lift coefficient of 0.3 (it also has 2 per cent camber), the maximum camber is at 15 per cent of the chord, while the maximum thickness is 12 per cent.

The forward position of the maximum camber in the five-digit sections results in low drag, but poor stalling characteristics, which explains why, when these sections are used near the root of a wing, they are often changed to a four-digit one (which gives a smooth stall) near the tip.

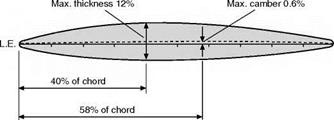
It should be noted that the position of maximum thickness (not indicated in either of these systems) is not necessarily the same as that of maximum camber, and in one British system eight digits were used so that this too could be indicated; two pairs of digits gave the thickness and its position, two other pairs the maximum camber and its position. Figure 3.25 illustrates 1240/0658 based on this system. For a symmetrical section the last four figures are omitted since they would all have been zero.

The reader may like to sketch for himself such sections as NACA 4412 and 23012, but he will have to judge the position of maximum thickness by eye.

In the NACA 6, 7 and 8 series, as in nearly all the NACA series, the last two digits again indicate the percentage thickness, but the other figures, letters, suffixes, dashes and brackets become so complicated that it is necessary to refer to tables. Most of these sections are particularly good for high subsonic speeds.

Many aircraft now use “tailor made” sections. This is particularly the case with transonic transport aircraft, which are designed to very fine limits to improve economy.

Design and nomenclature of aerofoil sections

Laminar flow aerofoils

The attainment of really high speeds, speeds approaching and exceeding that at which sound travels in air, has caused new problems in the design and in the flying of aeroplanes. Not the least of these problems is the shape of the aero­foil section.

Speed is a comparative quantity and the term ‘high speed’ is often used rather vaguely; in fact, the problem changes considerably at the various stages of high speed. In general, we may say that we have so far been considering aerofoil sections that are suitable for speeds up to 400 or 500 km/h (say 220 to 270 knots) – and we must remember that although these speeds have now been far exceeded they can hardly be considered as dawdling. Furthermore all aeroplanes, however fast they may fly, must pass through this important region. At the other end of the scale are speeds near and above the so-called ‘sound barrier’, shall we say from 800 km/h (430 knots) up to – well, what you will! The problems of such speeds will be dealt with in later chapters. Notice that there is a gap, from about 500 to 800 km/h (say 270 to 430 knots), and this gap has certain problems of its own; among other things, it is in this region that the so-called laminar flow aerofoil sections have proved of most value.

The significance of the boundary layer was explained in Chapter 2. Research on the subject led to the introduction of the laminar flow or low drag aerofoil, so designed as to maintain laminar flow over as much of the surface as possible. By painting the wings with special chemicals the effect of turbu­lent flow in the boundary layer can be detected and so the transition point, where the flow changes from laminar to turbulent, can actually be found both on models and in full-scale flight. Experiments on these lines have led to the conclusion that the transition point commonly occurs where the airflow over the surface begins to slow down, in other words at or slightly behind the point of maximum suction. So long as the velocity of airflow over the surface is increasing the flow in the boundary layer remains laminar, so it is necessary to maintain the increase over as much of the surface as possible. The aerofoil that was evolved as a result of these researches (Fig. 3.22) is thin, the leading edge is more pointed than in the older conventional shape, the section is nearly sym­metrical and, most important of all, the point of maximum camber (of the centre line) is much farther back than usual, sometimes as much as 50 per cent of the chord back.

The pressure distribution over these aerofoils is more even, and the airflow is speeded up very gradually from the leading edge to the point of maximum camber.

Laminar flow aerofoils

Fig 3.22 Laminar flow aerofoil section

There are, of course, snags – and quite a lot of them. It is one thing to design an aerofoil section that has the desirable characteristics at a small angle of attack, but what happens when the angle of attack is increased? As one would expect, the transition point moves rapidly forward! It has been found possible, however, to design some sections in which the low drag is maintained over a reasonable range of angles. Other difficulties are that the behaviour of these aerofoils near the stall is inferior to the conventional aerofoil and the value of CLmax is low, so stalling speeds are high. Also, the thin wing is contrary to one of the characteristics we sought in the ideal aerofoil.

But by far the most serious problem has been that wings of this shape are very sensitive to slight changes of contour such as are within the tolerances usually allowed in manufacture. The slightest waviness of the surface, or even dust, or flies, or raindrops that may alight on the surface, especially near the leading edge and, worst of all, the formation of ice – any one of these may be sufficient to cause the transition point to move right up to the position where the irregularity first occurs, thus causing all the boundary layer to become tur­bulent and the drag due to skin friction to be even greater than on the conventional aerofoil. This is a very serious matter, and led to the tightening up of manufacturing and maintenance tolerances.

With swept wings, the flow along the leading edge towards the tip usually causes transition to occur very near the leading edge and nullifying the effect of any laminar flow section. Because of scale effect, this may not happen on a wind tunnel model, making testing all the more difficult.

Another and more drastic method of controlling the boundary layer is to provide a source of suction, with the object of ‘sucking the boundary layer away’ before it goes turbulent.

This has the advantage that a much thicker wing section can be used (Fig. 3.23). The practical difficulty is in the power and weight involved in providing a suitable source of suction. Taminar boundary layers separate from the surface more easily than turbulent layers and suction may also be applied just before the point of separation to prevent this happening. Both suction and blowing (Fig. 3.24, overleaf) may also be used to prevent the separation of the turbulent boundary layer on an ordinary aerofoil.

Laminar flow aerofoils

Laminar flow aerofoils

Fig 3.24 Control of boundary layer by pressure (schematic drawing)

Camber

How can we alter the shape of the aerofoil section in an attempt to obtain better results? The main changes that we can make are in the curvature, or camber, of the centre line, i. e. the line equidistant from the upper and lower surfaces, and in the position of the maximum camber along the chord.

In symmetrical sections, some of which have been very successful, there is of course no camber of the centre line; other sections have centre line cambers of up to 4 per cent or more of the chord.

Generally speaking we get good all-round characteristics and a smooth stall when the maximum camber is situated about 40 per cent of the chord back. Aerofoils with the maximum camber well forward, say at 15 per cent to 20 per cent of the chord, may have low drag but are apt to have poor stall charac­teristics – a rather sudden breakaway of the airflow.

The other main features that can be varied are the maximum thickness, the variation of thickness along the chord and the position of maximum thickness – not necessarily the same as that of maximum camber. There is considerable variation of maximum thickness (Fig. 3.21) even in commonly used aerofoils, from very thin sections with about 6 per cent of the chord to thick sections of 18 per cent or more. Reasonably thick sections are best at low speed, and for pure weight carrying, thin ones for high speed. Remember that it is the thickness compared with the chord that matters, thus the Concorde with its large chord of nearly 30 metres achieved a remarkable thickness/chord ratio of 3 per cent.

The greater the camber of the centre line the more convex will be the upper surface, while the lower surface may be only slightly convex, flat or even slightly concave (though this is rare in modern types). Sometimes there is a

Camber

Medium aerofoil (10%) “general purpose”

Camber

Thick aerofoil (15%) “high lift”

Camber

Transonic aerofoil (10%) “high subsonic speed”

Camber

Thin aerofoil (7%) “high speed”

reflex curve of the centre line towards the trailing edge (Fig. 3.12); this tends to reduce the movement of the centre of pressure and makes for stability.

The ideal aerofoil

But what characteristics do we want in the ideal aerofoil section? We cannot answer that question fully until a later stage, but briefly we need –

1. A High Maximum Lift Coefficient. In other words, the top part of the lift

curve should be as high as possible. In our imaginary aerofoil it is only about 1.18, but we would like a maximum of 1.6 or even more. Why? Because we shall find that the higher the maximum CL, the lower will be the landing speed of the aeroplane, and nothing will contribute more towards the safety of an aircraft than that it shall land at a low speed.

2. A Good Lift/Drag Ratio. If we look again at Fig. 3.16, we can see that at a particular angle of attack, the lift/drag ratio of the aerofoil has a maximum value. This ratio does not occur at the angle of attack for minimum drag (Fig. 3.15) or at that for maximum lift coefficient (Fig. 3.13), but somewhere in between. Why is this ratio important? Because to get the smallest possible resistance to motion for a given weight we must operate at this angle of attack, and the higher the maximum lift/drag ratio, the smaller the air resistance that will be experienced.

The real importance of both high lift/drag ratio and high CLm/CD, dis­cussed below, will become clearer when we talk about aircraft performance (Chapter 7). Tet us just note here that both are important from the point of view of aerofoil design.

3. A High Maximum Value of CL3n/CD. The power required to propel an aeroplane is proportional to drag X velocity, i. e. to DV. For an aero­plane of given weight, the lift for level flight must be constant (being equal to the weight). If L is constant, D must vary inversely as LID (or CL/CD). From the formula L = CL. jpV2S it can be seen that if L, p and S are constant (a reasonable assumption), then V is inversely pro­portional to VCL (or CLm). Thus power required is proportional to DV, which is inversely proportional to (CL/CD) X CLi/2, i. e. to CL3n/CD. In other words, the greater the value of CLm/CD, the less the power required, and this is especially important from the point of view of climbing and staying in the air as long as possible on a given quantity of fuel and as we have seen, getting the best economy from a piston-engined aircraft. If the reader likes to work out the value of this fraction for dif­ferent aerofoils at different angles, and then compares the best value of each aerofoil, it will be possible to decide the best aerofoil from this point of view.

4. A Low Minimum Drag Coefficient. If high top speed rather than econom­ical cruise is important for an aircraft, then we will need low drag at small lift coefficient, and hence small angles of attack. The drag coefficient at these small angles of attack will be related to the minimum drag coefficient (Fig. 3.15).

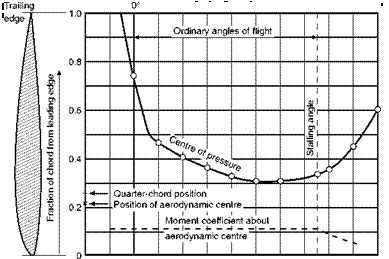
5. A Small and Stable Movement of Centre of Pressure. The centre of pressure of our aerofoil moves between 0.75 and 0.30 of the chord during ordinary flight; we would like to restrict this movement because if we can rely upon the greatest pressures on the wing remaining in one fixed pos­ition we can reduce the weight of the structure required to carry these pressures. We would also like the movement to be in the stable rather than in the unstable direction.

Looking at this another way: as we have explained, the moment coeffi­cient at zero lift is slightly negative on most aerofoils, and about the leading edge becomes more nose-down as the angle of attack is increased, and this tends towards stability. Yes, but our real reference point should be about the centre of gravity and, as we have also explained, this is usually not only behind the leading edge but also behind the aerodynamic centre, and may even be behind the trailing edge. So, in fact, this is not what we want for stability about the centre of gravity. On the contrary, we would prefer the exact opposite, i. e. a slight positive (nose-up) moment coefficient at zero lift, and this decreasing to negative as the angle of attack is increased. Most aerofoil sections do not give this; but later we shall find that there are means of achieving it.

6. Sufficient Depth to enable Good Spars to be Used. Here we are up against an altogether different problem. Inside the wing must run the spars, or other internal members, which provide the strength of the structure. Now the greater the depth of a spar, the less will be its weight for a given strength. We must therefore try to find aerofoils which are deep and which at the same time have good characteristics from the flight point of view.

Compromises

So much for the ideal aerofoil. Unfortunately, as with most ideals, we find that no practical aerofoil will meet all the requirements. In fact, attempts to improve an aerofoil from one point of view usually make it worse from other points of view, until we are forced either to go all out for one characteristic, such as maximum speed, or to take a happy mean of all the good qualities – in other words, to make a compromise, and all compromises are bad! It is perhaps well that we have introduced the word ‘compromise’ at this stage, because the more one understands about aeroplanes the more one realises that an aeroplane is from beginning to end a compromise. We want an aeroplane which will do this, we want an aeroplane which will do that; we cannot get an aeroplane which will do both this and that, therefore we make an aeroplane which will half do this and half do that – a ‘half and half affair’. And of all the compromises which go to make up that final great compromise, the finished aeroplane, the shape of the aerofoil is the first, and perhaps the greatest, com­promise.

Aerodynamic centre

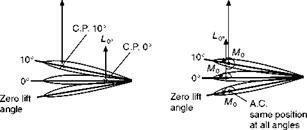
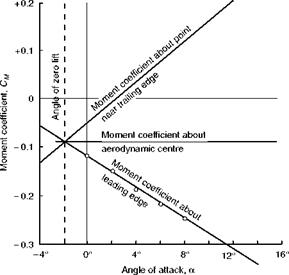
But something else of considerable importance arises from the differing effects of different reference points. For if about the leading edge there is a steady increase, and about a point near the trailing edge a steady decrease in the nose- down pitching moment, there must be some point on the chord about which there is no change in the pitching moment as the angle of attack is increased, about which the moment remains at the small negative nose-down value that it had at the zero lift angle (Figs 3.17 and 3.18).

This point is called the aerodynamic centre of the wing.

So we have two possible ways of thinking about the effects of increase of angle of attack on the pitching moment of an aerofoil, or later of the whole aeroplane; one is to think of the lift changing, and its point of application (centre of pressure) changing; the other is to think of the point of application (aerodynamic centre) being fixed, and only the lift changing (Fig. 3.19, overleaf). Both are sound theoretically; the conception of a moving centre of pressure may sound easier at first, but for the aircraft as a whole it is simpler to consider the lift as always acting at the aerodynamic centre. In both methods we really ought to consider the total force rather than just the lift, but

the drag is small in comparison and, for most purposes, it is sufficiently accu­rate to consider the lift alone.

At subsonic speeds the aerodynamic centre is usually about one-quarter of the chord from the leading edge, and theoretical considerations confirm this. In practice, however, it differs slightly according to the aerofoil section, usually being ahead of the quarter-chord point in older type sections, and slightly aft in more modern low drag types.

The graph in Fig. 3.18 (it can hardly be called a curve) shows how nearly the moment coefficient, about the aerodynamic centre, remains constant on our aerofoil at its small zero-lift negative value of about —0.09. This is further confirmed by the figures of CM given in Appendix 1 for a variety of aerofoil shapes.

The graphs tell us all we want to know about a particular wing section; they give us the ‘characteristics’ of the section, and from them we can work out the effectiveness of a wing on which this section is used.

For example, to find the lift, drag and pitching moment per unit span (about the aerodynamic centre) of an aerofoil of this section, of chord 2 metres at 6° angle of attack, and flying at 100 knots at standard sea-level conditions.

From Figs 3.13, 3.15 and 3.17, we find that at 6° –

CL = 0.6 CD = 0.028

CM = —0.09 about aerodynamic centre 100 knots = 51.6 m/s

1

Since ypV2 (or q) is common to the lift, drag and moment formulae, we can first work out its value –

L10° ^-10°

Aerodynamic centre

Fig. 3.19 Centre of pressure and aerodynamic centre Two ways of looking at it.

q = |pV2 = і X 1.225 X 51.6 X 51.6 = 1631 N/m2

So lift = CL. q. S = 0.6 X 1631 X 2 = 1957 N drag = CD. q.S = 0.028 X 1631 X 2 = 91.3 N

pitching moment = CM. q. Sc = -0.09 X 1631 X 20 X 2

= -5872 N-m

But where is the aerodynamic centre on this aerofoil?

At zero lift there is only a pure moment, or couple, acting on the aerofoil, and since the moment of a couple is the same about any point, this moment, and its coefficient, must be equal to that about the aerodynamic centre, which we shall call CM Ac (sometimes written as CMO), and this by definition will remain the same whatever the angle of attack.

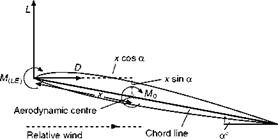
For all practical purposes we can assume that the aerodynamic centre is on the chord line, though it may be very slightly above or below. So let us suppose that it is on the chord line, and at distance x from the leading edge, and that the angle of attack is a° (Fig. 3.20).

The moment about the aerodynamic centre, i. e. CM Ac. q. Sc, will be equal to the moment about the leading edge (which we will call CM LE. q. Sc) plus the moments of L and D about the aerodynamic centre; the leverage being x cos a and x sin a respectively.

So

CM Ac ■ q ■ Sc = CM LE. q. Sc + CL. q. S. x. cos a + CD. q. S. x. sin a and, dividing all through by q. S,

CM ac ■ c = CM le ■ c CL ■ x. cos a + CD. x. sin a

••• X = C. (CM Ac – CM LE)/(CL cos a + CD sin a)

Aerodynamic centre

or, expressed as a fraction of the chord,

x lc = (CM. Ac – CM LE)/(CL cos a + CD sin a)

But the moment coefficient about the leading edge for this aerofoil at 6° is -0.22 (see Fig. 3.18), and CM Ac is -0.09 (Fig. 3.17),

CL = 0.6, cos 6° = 0.994, CD = 0.028, sin 6° = 0.10

So

x/c = (-0.09 + 0.22)1(0.6 X 0.994 + 0.028 X 1.10)

= 0.13/(0.60 + 0.003)

= 0.216

which means that the aerodynamic centre is 0.216 of the chord, or 0.432 metres, behind the leading edge, and so in this instance is forward of the quarter-chord (0.25) point.

Notice that at small angles, such as 6°, cos a is approx 1, sin a is nearly 0, so we can approximate by forgetting about the drag and saying that

x/c — (CM _ Ac — Cu _ le)/Cl

About the centre of pressure there is no moment, so (Distance of C. P. from L. E.)/c = —CM L£/(CL cos a + CD sin a)

= – CM. LE/CLaPProx

= +0.22/0.60 = 0.37

thus confirming the position of the C. P. as shown in Fig. 3.17.

All this has been explained rather fully at this stage; its real significance in regard to the stability of the aircraft will be revealed later.

The centre of pressure and moment coefficient

Lastly, let us examine the curves (Fig. 3.17, overleaf) which show how the centre of pressure moves, and what happens to the pitching moment coeffi­cient, as the angle of attack is increased.

The centre of pressure curve merely confirms what we have already learnt about the movement of the centre of pressure on an ordinary aerofoil. After having been a long way back at negative angles, at 0° it is about 0.70 of the chord from the leading edge, at 4° it is 0.40 of the chord back, and at 12° 0.30 of the chord; in other words, the centre of pressure gradually moves forward as the angle is increased over the ordinary angles of flight; and this tends towards instability. After 12° it begins to move back again, but this is not of great importance since these angles are not often used in flight.

It is easy to understand the effect of the movement of the centre of pressure, and for that reason it has perhaps been given more emphasis in this book than it would be in more advanced books on the subject.

It is important to remember that the pitching moment, and its coefficient, depend not only on the lift (or more correctly on the resultant force) and on

The centre of pressure and moment coefficient

Fig 3.17 Centre of pressure and moment coefficient curves

the position of the centre of pressure, but also on the point about which we are considering the moment – which we shall call the reference point. There is, of course, no moment about the centre of pressure itself – that, after all, is the meaning of centre of pressure – but, as we have seen, the centre of pressure is not a fixed point. If we take as our point of reference some fixed point on the chord we shall find that the pitching moment – which was already slightly nose-down (i. e. slightly negative) at the angle of zero lift – increases or decreases as near as matters in proportion to the angle of attack, i. e. the graph is a straight line, like that of the lift coefficient, over the ordinary angles of flight. About the leading edge, for instance, it becomes more and more nose – down as the angle is increased; but about a point near the trailing edge, although starting at the same slightly nose-down moment at zero lift, it becomes less nose-down, and finally nose-up, with increase of angle (Fig. 3.18).

The reader may be surprised at the increasing nose-down moment about the leading edge, because is not the centre of pressure moving forward? Yes, but the movement is small and the increasing lift has more effect on the pitching moment. The intelligent reader may be even more surprised to hear that an increasing nose-down tendency is a requirement for the pitching stability of the aircraft, for have we not said that the movement of the centre of pressure was an unstable one? Yes, this is a surprising subject, but the answer to the apparent paradox emphasises once again the importance of the point of refer­ence; in considering the stability of the whole aircraft our point of reference must be the centre of gravity, and the centre of gravity is always, or nearly

The centre of pressure and moment coefficient

Fig 3.18 Moment coefficient about different reference points

always, behind the leading edge of the wing, so the change of pitching moment with angle of attack is more like that about the trailing edge – which is defi­nitely unstable.

The drag curve

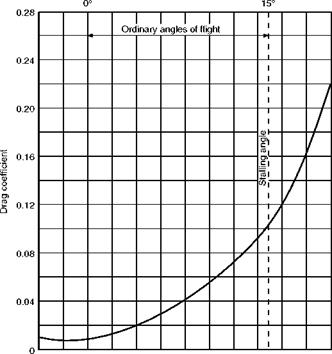
Now for the drag coefficient curve (Fig. 3.15, overleaf). Here we find much what we might expect. The drag is least at about 0°, or even a small negative angle, and increases on both sides of this angle; up to about 6°, however, the increase in drag is not very rapid, then it gradually becomes more and more rapid, especially after the stalling angle when the airflow separates.

The lift/drag ratio curve

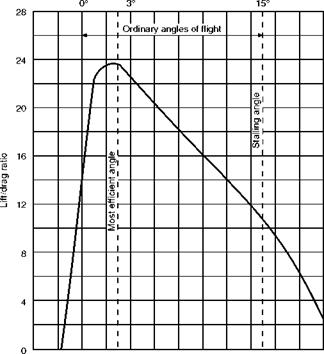
Next we come to a very interesting curve (Fig. 3.16, overleaf), which shows the relation between the lift and the drag at various angles of attack.

In a former paragraph we came to the conclusion that we want as much lift, but as little drag, as it is possible to obtain from the aerofoil. Now from the lift curve we find that we shall get most lift at about 15°, from the drag curve least drag at about 0°, but both of these are at the extreme range of possible

The drag curve

-4° 0° 4° 8° 12° 16° 20°

Angle of attack

Fig 3.15 Drag curve

angles, and at neither of them do we really get the best conditions for flight, i. e. the best lift in comparison to drag, the best lift/drag ratio.

If the reader has available the lift curve and the drag curve for any aerofoil, he can easily plot the lift/drag curve for himself by reading CL off the lift curve at each angle and dividing it by the CD at the same angle. It should be noted that it makes no difference whether we plot LID or CL/CD, as both will give the same numerical value, since L = CL . jpV2 . S and D = CD. jpV2. S.

We find that the lift/drag ratio increases very rapidly up to about 3° or 4°, at which angles the lift is nearly 24 times the drag (some aerofoils give an even greater maximum ratio of lift to drag); the ratio then gradually falls off because, although the lift is still increasing, the drag is increasing even more rapidly, until at the stalling angle the lift may be only 10 or 12 times as great as the drag, and after the stalling angle the ratio falls still further until it reaches 0 at 90°.

The chief point of interest about the lift/drag curve is the fact that this ratio is greatest at an angle of attack of about 3° or 4°; in other words, it is at this angle that the aerofoil gives its best all-round results – i. e. it is most able to do what we chiefly require of it, namely to give as much lift as possible consistent with a small drag.

The drag curve

-4° 0° 4° 8° 12° 16° 20°

Angle of attack

Fig 3.16 Lift/drag curve

Lift curve

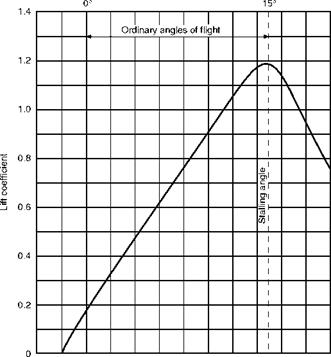
Let us first see how the lift coefficient changes with the angle of attack (Fig. 3.13).

We notice that when the angle of attack has reached 0° there is already a definite lift coefficient and therefore a definite lift; this is a property of most cambered aerofoils. A flat plate, or a symmetrical aerofoil, will of course give no lift when there is no angle of attack.

Then between 0° and about 12° the graph is practically a straight line, meaning that as the angle of attack increases there is a steady increase in the lift; whereas above 12°, although the lift still increases for a few degrees, the increase is now comparatively small and the graph is curving to form a top, or maximum point.

At about 15° the lift coefficient reaches a maximum, and above this angle it begins to decrease, the graph now curving downwards.

Lift curve

-4° 0° 4° 8° 12° 16° 20°

Angle of attack

Fig 3.13 Lift curve

Stalling of aerofoil

This last discovery is perhaps the most important factor in the understanding of the why and wherefore of flight. It means that whereas at small angles any increase in the angle at which the aerofoil strikes the air will result in an increase in lift, when a certain angle is reached any further increase of angle will result in a loss of lift.

This angle is called the stalling angle of the aerofoil, and, rather curiously, perhaps, we find that the shape of the aerofoil makes little difference to the angle at which this stalling takes place, although it may affect considerably the amount of lift obtained from the aerofoil at that angle.

Now, what is the cause of this comparatively sudden breakdown of lift? The student will be well advised to take the first available opportunity of watching, or trying for himself, some simple experiment to see what happens. Although, naturally, the best demonstration can be given in wind tunnels with proper apparatus for the purpose, perfectly satisfactory experiments can be made by using paper or wooden model aerofoils and inserting them in any fairly steady flow of air or water, or moving them through air or water. The movement of the fluid is emphasised by introducing wool streamers or smoke in the case of air and coloured streams in the case of water.

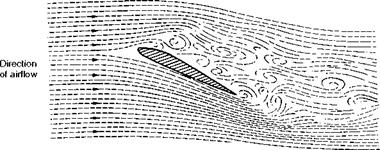
Contrary to what might be expected, the relative speed at which the aero­foil moves through the fluid makes very little difference to the angle at which stalling takes place; in fact, an aerofoil stalls at a certain angle, not at a certain speed. (It is not correct to talk about the stalling speed of an aerofoil, but it will be seen in a later chapter why we talk about the stalling speed of an aero­plane.) Now what happens? While the angle at which the aerofoil strikes the fluid is comparatively small, the fluid is deflected by the aerofoil, and the flow is of a steady nature (compare Fig. 3.4); but suddenly, when the critical angle of about 15° is reached, there is a complete change in the nature of the flow. The airflow breaks away or separates from the top surface forming vortices similar to those behind a flat plate placed at right angles to the wind; there is therefore very little lift. Some experiments actually show that the fluid which has flowed beneath the under-surface doubles back round the trailing edge and proceeds to flow forward over the upper surface. In short, the steady flow has broken down and what is called separation or ‘stalling’ has taken its place, with consequent loss in lift (Fig. 3.14).

Anyone who has steered a boat will be familiar with the same kind of phenomenon when the rudder is put too far over, and yachtsmen also experi­ence ‘stalling’ when their sails are set at too large an angle to the relative wind. There are, in fact, many examples of stalling in addition to that of the aero­foil.

What happens is made even more clear if we look again at the results of pressure plotting (Fig. 3.11). We notice that up to the critical angle consider­able suction has been built up over the top surface, especially near the leading

Lift curve

Fig 3.14 Stalling of an aerofoil

edge, whereas when we reach the stalling angle the suction near the leading edge disappears, and this accounts for the loss in lift, because the pressure on other parts of the aerofoil remains much the same as before the critical angle.

Some students are apt to think that all the lift disappears after the critical angle; this is not so, as will easily be seen by reference to either the lift curve or to the pressure plotting diagrams. The aerofoil will, in fact, give some lift up to an angle of attack of 90°. Modern interceptor aircraft are sometimes flown at very high angles of attack during violent manoeuvres, so the upper portion of the graph is nowadays quite important.

The stalling angle, then, is that angle of attack at which the lift coefficient of an aerofoil is a maximum, and beyond which it begins to decrease owing to the airflow becoming separated.