Category MECHANICS. OF FLIGHT

Sources of error

Wind tunnel experiments on models, even at subsonic speeds, are liable to three main sources of error when used to forecast full-scale results. These are –

1. Scale Effect. As mentioned earlier, laws of resistance can be framed which apply well to bodies whose sizes are not very different, but these laws become less accurate when there is a great difference in size between the model and the full scale. A similar effect is noticed when the velocity of the model test differs appreciably from the full-scale velocity.

Corrections can be applied which allow for this ‘scale effect’ and enable more accurate forecasts to be made. Readers who are interested will find an explanation of scale effect, and of the advantages of the compressed air tunnel, if they refer to Appendix 2. They will also be introduced to the important term Reynolds Number.

2. Interference from Wind Tunnel Walls (Fig. 2.19). The second error is due to the fact that in the wind tunnel the air stream is confined to the limits of the tunnel, whereas in free flight the air round the aeroplane is, for all practical purposes, unlimited in extent. In this case too corrections can be applied which considerably reduce the error.

3.

Подпись: -r_r_Airflow free to be - - - ~ -^—influenced by - - Airflow constrained к Airflow free to be inf I u e nee d by "“.presence of modelr

Errors in Model. The smaller the scale of the model, the more difficult does it become to reproduce every detail of the full-scale body, and since very slight changes of contour may considerably affect the airflow, there will always be errors due to the discrepancies between the model and the full-scale body.

Other wind tunnel measurements

As well as measuring the forces and pressures on a wind tunnel model, we may want to investigate more detailed features of the flow, so that we can improve the design of our aircraft. We can do this by measuring the velocity at different points in the flow and by using flow visualisation to help us to see what the flow is doing.

One way we can measure speed is to traverse the flow using a miniaturised version of the pitot-static tube (Fig 2.5 earlier), although we must be careful to line it up with the local flow direction. If we want to measure fluctuations in turbulent flow, however, this will not respond fast enough. For this type of speed measurement, we can use a hot wire anemometer or a laser Doppler anemometer. In the hot wire anemometer a very fine wire is heated electrically. The airflow cools the wire and this changes its electrical resistance, which can be measured electronically. Because the wire is so fine (about 5 micro-metres in diameter) it can measure very rapid fluctuations in airspeed. The laser Doppler anemometer (TDA) works by illuminating a very small volume of air at the crossing point of two laser beams. The beams interfere with each other and produce a series of ‘fringes’ (dark and light stripes). Particles, which are light enough to follow the airstream, are introduced into the flow (seeding) and each reflects a pulse of light as it travels through each light fringe. The fre­quency of the reflected light is then used to measure the velocity of the particle but some very clever signal processing is needed to sort things out when par­ticles overlap in the illuminated area or when very large particles come through, which are too big to follow the flow. Seeding can also be used to measure the velocity in a ‘slice’ of the flow illuminated by a light sheet. Pictures are taken, in quick succession, of particles illuminated by the sheet and their velocities are deduced from their changes in position. This is called ‘Particle Image Velocimetry’ (PIV for short).

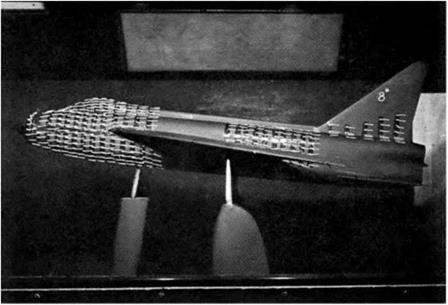
Particles in the flow can also be used to make the flow visible. Smoke is often used for this. We can also see what the flow is doing on the surface of a model by using short wool tufts, stuck to the surface at their upstream ends, or by the use of surface oil flow. A common oil flow technique is to mix a

white powder such as titanium dioxide with kerosene and a few drops of oleic acid. After running the wind tunnel the titanium dioxide forms streaks showing the pattern of flow on the surface. A note of caution – oil flow needs considerable experience in interpretation as the flow may differ considerably a small distance from the surface, outside the boundary layer.

Absolute and gauge pressure

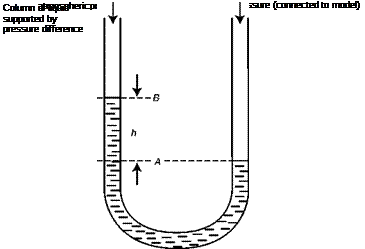
In the simple U-tube manometer above, the liquid surface at В is left open to the atmosphere, so –

Pressure difference = test pressure – atmospheric pressure = p X g X b Thus –

test pressure = atmospheric pressure + p X g X b.

This is known as the absolute pressure. The pressure difference (= p X g X b) simply gives the pressure change relative to atmospheric pressure. In practice this relative pressure is all we need to know. As this pressure is the pressure obtained directly from the gauge, it has come to be referred to as gauge pressure. Sometimes it is convenient to use a different pressure source to act as our reference, instead of atmospheric pressure. We can see that –

absolute pressure = gauge pressure + atmospheric (or reference) pressure

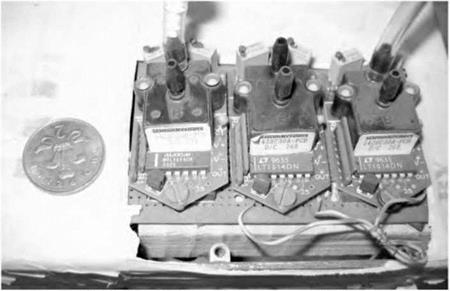
Nowadays it is generally more convenient to use pressure transducers (Fig. 2F) to measure the pressure at the tappings.

Absolute and gauge pressure

Fig. 2F Pressure transducer

The transducer produces an electrical output that is proportional to the pressure being measured and which can be recorded, through a suitable inter­face, directly on a computer system. Pressure transducers work in a variety of ways. For example, the pressure can be used to deform a diaphragm, which has electrical strain gauges attached to it. They can also be purchased in a wide variety of sizes and pressure ranges. Some pressure transducers measure the pressure relative to a reference source (gauge pressure transducers), others measure relative to a sealed vacuum and thus directly measure absolute pressure.

Measuring pressure

We can measure the pressure on the model surface by connecting flexible tubes between small holes (pressure tappings) drilled in the surface and a suitable pressure-measuring device. A simple way to measure the pressure is to use a liquid-filled tube U-tube (Fig 2.18). If the pressure in the tube, connected to the hole in the model, is lower than atmospheric, the liquid level will rise; rather like sucking a drink up a straw. If the pressure is higher than atmospheric (as in Fig 2.18), the liquid will be pushed further down the tube, like blowing down the straw.

The idea is quite simple. The column of liquid between A and В is sup­ported by the difference between the test pressure and atmospheric pressure, which produces an upward force on the column equal to the weight of the liquid between A and B. As we saw for the liquid column in Chapter 1, the upward force is equal to the pressure difference multiplied by the cross-sec­tional area of the tube. This balances the weight of the liquid, which is equal to its density, p, multiplied by the gravitational constant, g, the cross-sectional area of the tube and the height of the column, h.

So what pressure difference is the equivalent to a manometer deflection (pressure ‘head’ – see Chapter 1) of lm of water?

Pressure difference = p X g X b So, putting in the values in SI units, we get

Measuring pressure

Pressure difference = 1000 X 9.81 X 1 = 9810 N/m2

Wind-tunnel balances

Wind-tunnel balances

To measure the forces exerted by the airflow, the model is normally mounted on to a balance which may be a mechanical or an electrical type. The older mech­anical force balance is rather like a simple weighing machine of the type used to weigh babies or patients in a hospital. As illustrated in Fig. 2.16, the force to be measured (such as the lift on the model) is applied via a series of levers and

Подпись:A simple balance

Wind-tunnel balances

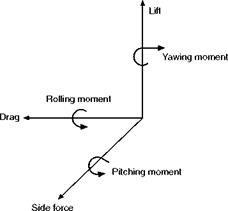
pivots or flexures to an arm upon which is placed a jockey weight. The moment of the applied force is balanced by moving the jockey weight along the arm. The position of the jockey weight therefore indicates the magnitude of the force. The further along the arm the jockey weight has to be moved, the greater is the force being balanced. The same principle is used to measure horizontal drag or thrust forces, as shown in Fig. 2.16. One arm has to be used for each of the three forces and three moments that make up the six ‘components’ illustrated in Fig. 2.17. In small college tunnels it is normal to have only three arms which measure the three most important components, lift, drag and pitching moment. The design of the levers and pivots is very complicated because it is important that a change in the vertical lift force does not affect the arm that is supposed to measure only the horizontal drag force. The balance unit which is large is situated outside the tunnel, and the model is attached to it by means of a number of rods or wires (see Fig. 2D, earlier). Originally the jockey weights were moved by hand, but nowadays they can either be moved automatically by a servo electric motor, or are left fixed, with the force of the arm being measured by an electrical force transducer. A force transducer is an instrument that produces an electrical output that is proportional to the applied force. This brings us to the second form of balance, the electronic type.

The electronic force balance consists of a carefully machined block of metal that is attached to the model at one end and to a supporting structure at the other; this often takes the form of a single rod or ‘sting’ protruding from the rear of the model. Electrical resistance strain gauges attached to the block produce output voltages proportional to the applied forces. Up to six components can be measured. This type of balance is very small and compact and is normally con­tained within the model. One potential disadvantage is that there is usually a certain amount of unwanted interference between the different components; changes in lift affect the drag reading, etc. However, the computer-based data acquisition systems to which such balances are invariably attached are able to make corrections and allowances automatically.

Wind-tunnel balances

Wind tunnels

Because it is difficult to predict the forces on an aircraft (especially drag) with sufficient precision, scale models must be tested using wind tunnels to provide the necessary information.

In experimental work it is usual to allow the fluid to flow past the body rather than to move the body through the fluid. The former method has the great advantage that the body is at rest, and consequently the measurement of any forces upon it is comparatively simple. Furthermore, since we are only concerned with the relative motion of the body and the fluid, the true facts of the case are fully reproduced provided we can obtain a flow of the fluid which would be as steady as the corresponding motion of the body through the fluid.

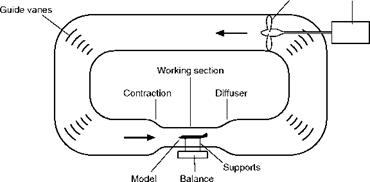
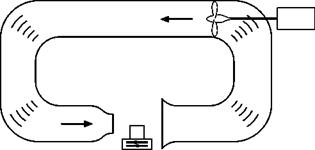
Many experiments are carried out on models in wind tunnels. There are several types of tunnel, but probably the most commonly used is the closed working-section, closed-return type shown in Figs 2.13 and 2E (overleaf). The model is placed in the narrow working section and air enters through a con­traction. The contraction makes the airflow speed in the working section more uniform, and also higher than in the rest of the circuit. Having a high flow speed in the whole circuit would increase the energy losses due to friction. The term closed-return refers to the fact that the air flows round in a complete circuit.

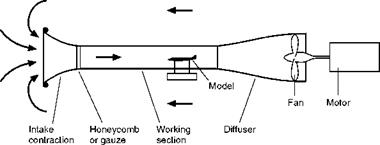
As an alternative, open circuit tunnels are sometimes used. In these, only the working section contraction and fan sections are required as illustrated in Fig. 2.14 (overleaf). The air is simply sucked in from the atmosphere through the contraction to the working section, and then exhausted back into the atmos­phere, rather like a large vacuum cleaner. The advantage of the open-return type of tunnel is that it takes up much less space, and costs less than a closed- return type. The principal disadvantages are that dust is drawn in, and the

Wind tunnels

Fig 2.13 A closed working-section closed return wind tunnel

Wind tunnels

Fig 2.14 A simple open return tunnel

flow may be sensitive to external disturbances. Also, the pressure in the working section must be lower than atmospheric, since the air is drawn in from the atmosphere and speeded up. This means that any small leaks around the working section will pull in a jet of air. This type of tunnel is frequently used in college and university laboratories.

Wind tunnels

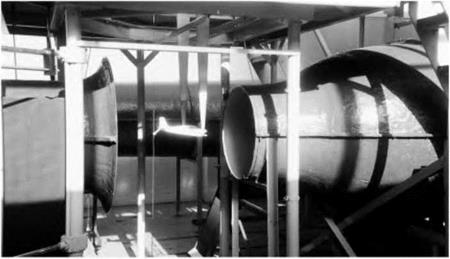
Fig 2D A small open jet wind tunnel

This type of tunnel is useful for teaching purposes, as the model is readily accessible. Though not often used for aeronautical applications these days, the open jet tunnel has found some favour for road vehicle aerodynamic testing.

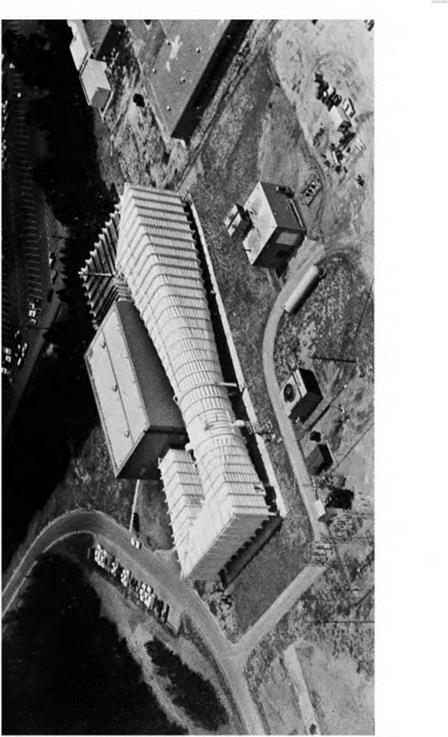
Fig 2E Wind tunnel with return circuit (opposite)

(By courtesy of the Lockheed Aircraft Corporation, USA)

The Lockheed-Georgia subsonic closed-throat wind tunnel. Length of centre line 238 m. Mechanical balances measure lift, drag, side force and pitching, rolling and yawing moments. 6710 kW electric motor drives fan of 12 m diameter.

Wind tunnels

Wind tunnels

Fig 2.15 An open jet tunnel

Another type of tunnel that is sometimes employed is the open jet type illus­trated in Figs 2D (earlier) and 2.15. In this type of tunnel the working section is not enclosed, which gives it its main advantage, accessibility. For teaching purposes, the open working section is particularly useful, and this type of tunnel is also popular for automotive aerodynamic studies where the effects of wall constraint are less predictable than for aircraft. There are other types of tunnel such as the slotted wall, but let us not confuse ourselves with such sub­tleties at this stage.

Other common types of tunnel are of course the supersonic and transonic, but these are described later in the book, after compressible flow has been explained.

Skin friction and boundary layer

Another consideration is that as we decrease the form drag the skin friction becomes of comparatively greater importance.

2. Skin Friction. Air is slowed up, and brought to a standstill, very close to a surface. If there is dust on an aeroplane wing before flight, it is usually still there after flight. The layers of air near the surface retard the layers farther away – owing to the friction between them, i. e. the viscosity – and so there is a gradual increase in velocity as the distance from the surface increases (Fig. 2.10). The distance above the plate in which the velocity regains a value close to that of the free stream may be no more than a few millimetres over a wing.

The layer or layers of air in which the shearing action takes place, that is to say between the surface and the full velocity of the airflow, is called the boundary layer. Owing to the great importance of skin friction, and necessity of keeping it within reasonable limits, particularly at high speed, much patient research work has been devoted to the study of the boundary layer.

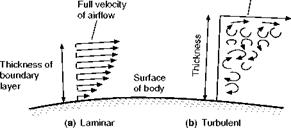
Now the boundary layer, like the main airflow, may be either laminar or turbulent (Figs 2.11 and 2C), and the difference that these two types of flow make to the total skin friction is of the same order as the effect of streamlining

This layer slowed. цр^эу layer below

This layer slowed Tip by layer below Airflow slov^cTup by surface

Airflow slowedjjp by surface_______

This layer sloWedjjp by layer above

This layerslowed_uoby layer above

Подпись: Fig 2.10Skin friction

Skin friction and boundary layer

Fig 2C Investigating the boundary layer

(By courtesy of the former British Aircraft Corporation, Preston)

Wool tufts on model of a fuselage the main flow. It has been stated that if we could ensure a laminar boundary layer over the whole surface of a wing the skin friction would be reduced to about one-tenth of its value.

The turbulent layer is characterised by high frequency eddies superimposed on the average velocity at each distance from the surface, while in the laminar case the ‘layers’ of air flow smoothly over each other. The turbulent layer, other factors being equal, has a much higher degree of shear at the surface, and it is this which causes the skin friction to be much higher than it is for the

Full velocity of airflow

Skin friction and boundary layer

Fig. 2.11 Laminar and turbulent boundary layer Thickness of layer greatly exaggerated

Skin friction and boundary layer

Fig 2.12 Transition point

laminar boundary layer. A smooth surface encourages a laminar layer, although other factors such as viscosity and the flow speed are also important. A smooth surface is also important when the boundary layer is turbulent as in this case the skin friction is reduced by a high degree of surface finish, although it remains considerably above the laminar value.

The usual tendency is for the boundary layer to start by being laminar near the leading edge of a body, but there comes a point, called the transition point, when the layer tends to become turbulent and thicker (Fig. 2.12). As the speed increases the transition point tends to move further forward, so more of the boundary layer is turbulent and the skin friction greater.

If this much is understood it will be obvious that the purpose of much research work has been to discover how the transition point moves forward, and how its movement can be controlled so as to maintain laminar flow over as much of the surface as possible.

But a further complication is that the behaviour of the boundary layer is very dependent on the size of an aerofoil (scale affect); this affects its relative thickness, whether it is laminar or turbulent, and how soon it separates from the surface. This is very important in wind tunnel testing which is discussed later. First let us look at how we can represent the drag produced by skin fric­tion and separation.

Drag coefficient

Experiments show that, within certain limitations, it is true to say that the total resistance of a body passing through the air is dependent on the following factors –

(a) The shape of the body.

(b) The frontal area of the body.

(c) The square of the velocity.

(d) The density of the air.

Of these the velocity squared law is not strictly true at any speed and is defi­nitely untrue at very low and very high speeds: when the speeds are low,
matters are complicated by the way in which the boundary layer develops and, at high speeds, by the fact that the air may be compressed.

It is sometimes thought that the air is compressed in front of a body that is moving quite slowly through the air. We know that air is compressible but this does not come into play at speeds well below the speed of sound; at such speeds air behaves very like an almost incompressible liquid such as water. The passage of sound is, of course, caused by compression in the air, and it is only when speeds are reached in the neighbourhood of the speed of sound, about 340 m/s (661 knots), that appreciable compression of the air begins to take place. High-speed aircraft fly in this region, and beyond it. It is also interesting to note that the speed at which sound travels depends on the temperature of the air and becomes appreciably less at high altitudes, and thus the problem of reaching this critical velocity has become an important consideration in high – altitude flying. In such conditions there may be considerable departure from the velocity squared law, but for the low subsonic speeds – say, from 15 to 150 m/s – this law can be taken as accurate enough for practical purposes, so that double the speed means four times the resistance. As regards frontal area, when we are considering bodies of very different dimensions we must remember the scale effect to which we have already referred; we should also notice that, if we have a one-fifth scale model of a body, the frontal area of the full-sized body will be twenty-five times that of the model.

The term ‘frontal area’ means the maximum projected area when viewed in the direction of normal motion, so the frontal area of an aircraft is the maximum cross-sectional area when viewed from the front. In some instances the surface area would be a more sensible area to take – no general rule can be laid down, and the student should remember that the chief object of experiments on resistance is to compare the resistance of bodies of a similar kind. We are not very much con­cerned with how the resistance of a wing compares with the resistance of a wheel, but we do wish to compare the resistance of wings of different sizes and shapes, and also the resistances of different types of wheels. Therefore, if we choose one method to measure the area of wings and another to measure the area of wheels (as indeed we do), it does not matter very much. We must, however, agree on which reference area we are using in a particular case if we are to compare results sensibly. It is all a question of convenience. We shall return to this when we look at the lift, drag and pitching moments of an aerofoil in the next chapter.

The law of the variation of the resistance with the density of the air is found to be very nearly correct at ordinary densities, and on first thoughts points to the advantages of flight at high altitudes.

Assuming (a), (b), (c) and (d) to be true, we can express the result by the following formula for bodies of the same shape –

R a pV2SF

pV2 looks suspiciously like the dynamic pressure, jpV2, and it is, perhaps, not surprising that the force generated by the air stream depends on this quantity.

The general formula for air resistance, or drag, can thus be written as –

R = cDPv%

where CD is a coefficient (known as the drag coefficient), which depends on the shape of the body and is found by experiment; p represents the density of the air, SF the frontal area of the body, and У the velocity.

The units in this formula will correspond to those adopted in Chapter 1, i. e. the resistance (R) will be in newtons, the density (p) in kilograms per cubic metre, the area (SF) in square metres, velocity (V) in metres per second and the drag coefficient (CD) merely a number.

From this formula we can estimate the resistance of bodies moving through the air, provided we know the value of CD for the particular shape concerned. This is usually found by experiment and, in the absence of more accurate information, the following values may be used –

for a flat plate CD = 1.2 (normal to the flow direction)

for a circular tube CD = 0.6 (axis normal to the flow direction)

for a streamline strut CD = 0.06

EXAMPLE 10.1

Find the resistance of a flat plate, 15 cm by 10 cm, placed at right angles to an airflow of velocity 90 km/h. (Assume sea-level air density of 1.225 kg/m3.)

SOLUTION

Data: CD = 1.2

p = 1.225 kg/m3

V = 90 km/h = 25m/s

SF = 15 x 10 = 150cm2 = 0.015m2

Resistance = CD іpV2SF = 1.2 X 0.5 X 1.225 X 25 X 25 X 0.015 = 6.89 N

Although we have so far applied this formula to resistance only, it is really of far wider application; it can, in fact, be used to represent any force and, with a small modification, moment, produced by the flow of air and the reader will be well advised to be sure that he understands just what it means. Therefore, let us sum up the position by saying that the aerodynamic drag experienced by any body depends on the shape of the body (represented by the coefficient CD in the formula), the dynamic pressure of the air when it is of the given density and flowing at the given velocity (represented by IpV2), and the size of the body, in this case given by the frontal area (represented by SF).

We can base our coefficient on areas other than SF, if this is more convenient; this we shall do in the next chapter, when we look at the forces and moments produced by an aerofoil. If we change the reference area, though, CD will have to be correspondingly changed to keep the total resistance at the correct value; so we must agree on which reference area we are using in each case.

Air resistance or drag

Whenever a body is moved through air, or other viscous fluid, a definite resist­ance to its motion is produced. In aeronautical work this resistance is usually referred to as drag.

Drag is the enemy of flight, and efforts must be made to reduce the resistance of every part of an aeroplane to a minimum, provided strength and other essen­tial factors can be maintained. For this reason many thousands of experiments have been carried out to investigate the problems of air resistance; in fact, in this, as in almost every branch of the subject, our knowledge is founded mainly on the mean result of accumulated experimental data. Nowadays, however, there are increasingly more accurate theoretical methods of estimating drag.

Streamlines and form drag [4] [5] 2

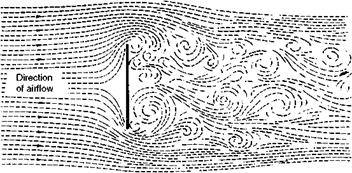
1. Form Drag. This is the portion of the resistance which is due to the fact that when a viscous fluid flows past a body, the pressure on the forward-facing part is on average higher than that on the rearward-facing portion. The extreme example of this type of resistance is a flat plate placed at right angles to the wind. The resistance is very large and almost entirely due to the pressure difference between the front and rear faces, the skin friction being negligible in comparison (Fig. 2.7).

Experiments show that not only is the pressure in front of the plate greater than the atmospheric pressure, but that the pressure behind is less than that of the atmosphere, causing a kind of ‘sucking’ effect on the plate.

Air resistance or drag

Fig 2.7 Form drag

Air resistance or drag

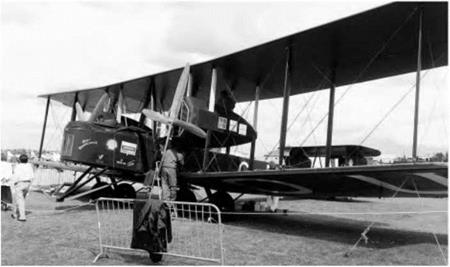
Fig 2A Parasite drag A flying replica of the Vickers Vimy bomber which was the first aeroplane to make a non-stop flight across the Atlantic (in 1919). The extensive use of bracing wires and struts creates a great deal of parasite drag.

Air resistance or drag
Подпись: Resistance, 50%

Resistance, 15%

Air resistance or drag

Fig 2.8 Effect of streamlining

It is essential that form drag should be reduced to a minimum in all those parts of the aeroplane which are exposed to the air. This can be done by so shaping them that the flow of air past them is as smooth as possible, and much experimental work has been carried out with this in view. The results show the enormous advantage to be gained by the streamlining of all exposed parts; in fact, the figures obtained are so remarkable that they are difficult to believe without a practical demonstration. At a conservative estimate it can be said that a round tube has not much more than half the resistance of a flat plate, while if the tube is converted into the best possible streamline shape the resistance will be only one-tenth that of the round tube or one-twentieth that of the flat plate d ig – 2.8).

The streamline shapes which have given the least resistance at subsonic speeds have had a fineness ratio – i. e. alb – of between 3 and 4 (see Fig. 2.9), and the maximum value of b should be about one-third of the way back from the nose. These dimensions, however, may vary considerably without increasing the resistance to any great extent.

Fig 2B Streamlining

(By courtesy of the former British Aircraft Corporation) Concorde 002 in contrast to the Vickers Vimy of Fig. 2A

Подпись: 49AIR AND AIRFLOW – SUBSONIC SPEEDS

Air resistance or drag

It should be mentioned that although we now have a fair idea of the ideal shape for any separate body, it by no means follows that two bodies of this shape – e. g. a fuselage and a wing – will give the least resistance when joined together.

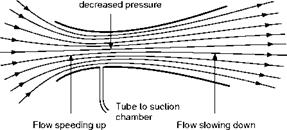
The venturi tube

One of the most interesting examples of Bernoulli’s Theorem is provided by the venturi tube (Fig. 2.6). This simple but effective instrument is nothing but a tube which gradually narrows to a throat, and then expands even more gradually to the exit. Its effectiveness as a means of causing a decrease of pressure below that of the atmosphere depends very much on the exact shape.

If a photograph is taken, or a diagram made, of the flow of air or water through a venturi tube, it will be observed that the streamlines are closest together at the throat, and this gives an unfortunate impression that the fluid has been compressed at this point. Such an impression is the last thing we want to convey, and what we would like to be able to do is to show a video, or, better still, an actual experiment, which would make it quite clear that while it is true that the streamlines are closer together at the throat, the velocity of flow is also higher. This is the important point: the dynamic pressure has gone up and therefore, in accordance with Bernoulli’s principle, the static pressure has gone down. If a tube is taken from the throat and connected to a U-tube containing water, the suction will be clearly shown.

An interesting experiment with a venturi tube is to place an ordinary pitot tube (without a static) facing the airflow at various positions in the tube. Connect the pitot tube to a U-tube, and leave the other side of the U-tube open to the atmospheric pressure outside the air stream. The pitot tube will record P + їрУ[3], i. e. the static pressure in the stream plus the dynamic pressure, and the U-tube will therefore show the difference between this and the atmospheric pressure outside the stream. It will be found that p + ypV2 is very nearly con­stant, whether the pitot tube is placed in the free air stream in front of the venturi, or in the mouth, or the throat, or near the exit. This is a convincing proof of Bernoulli’s Theorem. The air speed increases from mouth to throat and then decreases again to the exit. The air speed increases very nearly in the same proportion as the area of cross-section of the venturi decreases, and this suggests that there is little or no change in the density of the air. Even more convincing evidence that the density does not change is provided by the flow of water through a venturi tube; the pattern of flow and the results obtained are very similar to those in air, and we know that water is for all practical pur­poses incompressible.

There are many practical examples of the venturi tube in everyday life, but there is no need to quote them, because we have sufficient examples in flying to illustrate this important principle. The choke tube in a carburettor is one; a wind tunnel is another, the experiments usually being done in the high-speed

High-speed flow

The venturi tube

pressure decreasing pressure increasing

Fig 2.6 Flow through venturi tube flow at the throat, and the air speed at this point is often measured by a single static hole in the side of the tunnel. A small venturi may be fitted inside a larger one, and the suction at the throat of the small venturi is then sufficient to drive gyroscopic instruments.

Air speed indicator corrections

The speed indicated by the air speed indicator is called the Air Speed Indictor Reading (ASIR). There are several sources of error in this reading. Firstly, the instrument itself may not have been calibrated correctly, or may be suffering from some wear. This error is called instrument error. By recalibrating the instrument it is possible to determine what the correction should be at every indicated speed. The speed corrected for instrument error is called the Indicated Air Speed (IAS). There will also be errors due to the positioning of the pitot and static tubes on the aircraft. It is virtually impossible to find a pos­ition where the static pressure is always exactly the same as the pressure in the free airstream away from the aircraft. To determine the correction for such position errors, the aircraft can be flown in formation with another aircraft with specially calibrated instruments. Once the position error correction has been applied, the speed is known as the Calibrated Air Speed (CAS). Finally, for any aircraft that can fly faster than about 200 mph, it is necessary to apply a correction for compressibility, since Bernoulli’s equation only applies to low – speed effectively incompressible flows.

After all the corrections have been applied, the resulting speed is called the Equivalent Air Speed (EAS). Once the equivalent air speed has been obtained it is quite easy to estimate the True Air Speed (TAS) which is required for navi­gation purposes. For a light piston-engined aircraft, the corrections will be relatively small, and for simple navigational estimates, the pilot can assume that the speed read from his instrument the ASIR is roughly the same as the equiv­alent air speed EAS. The procedure for calculating the true air speed is as follows.

Suppose that at 6000 m the air speed indicator reads 204 knots, i. e. 105 m/s. Ignoring any instrument or position errors, this means that the pressure on the pitot tube is the same as would be produced by a speed of 105 m/s at standard sea-level density of 1.225 kg/m3; but this pressure is kpV2, i. e. 1/2 X 1.225 X 105 X 105.

Now according to the International Standard Atmosphere the air density at 6000 m is 0.66 kg/m3, and if the true air speed is V m/s, then the pressure on the pitot tube will be 1/2 X 0.66 X V2, which must be the same as

1/2 X 1.226 X 105 X 105 so

0.66V2 = 1.226 X 1052 or

V = Vl.226/0.66 X 105 = 1.36 X 10⁵

142.8 m/s.

Thus the indicated air speed is 105 m/s, and the true air speed approximately 143 m/s.

Note that, expressed in symbols, the true air speed (TAS) is the equivalent air speed (EAS) divided by the square root of the relative density (a), or

TAS = EAS/ Vcr

A similar calculation for 12 200 m will reveal the interesting result that at that height the true air speed is slightly more than double the indicated air speed!

We have said that the instrument indicated air speed may sometimes be more useful to the pilot that the true air speed. For purposes of navigation, however, he must estimate his speed over the ground, and with traditional navigation methods, he must first determine the true air speed, then make cor­rections to allow for the speed of the atmospheric wind relative to the ground. The true air speed can be determined using the procedure above, but to do this we need to know the air density or the relative density. This can be obtained by using the altimeter reading, and tables for the variation of relative density in the ISA. In practice, as an alternative to calculations, the pilot can use tables showing the relationship between true air speed and indicated air speed at dif­ferent heights in ISA conditions.

For high-speed aircraft, the indicated air speed has to be corrected for com­pressibility, and to do this we need a further instrument, one that indicates the speed relative to the local speed of sound. This instrument is called a machmeter. However, we are again trying to run before we can walk, and we will leave the treatment of compressible flow to later chapters.

Nowadays navigation has been revolutionised by the introduction of ground-based radio, and satellite navigation systems which can give very accu­rate indications of position and speed relative to the ground. Despite these advances, however, aspiring pilots still have to learn the traditional methods of navigation in order to qualify for their licence. Old instruments like the air speed indicator and the altimeter are simple and reliable, and will not break down in the event of an electrical failure or a violent thunderstorm. Even on the most advanced modem airliners, an old mechanical air speed indicator and pressure altimeter are fitted, and will continue to work even if all the electrical systems have failed.