Our heavyweight helicopter equal in the world does not have
In Rostov started production of the most load-lifting rotary-wing car The Russian holding «Helicopt[...]

Everything about aircrafts and helicopters. News and events in aviation worldwide. Civil, transportation, military helicopters and airplanes.

Everything about aircrafts and helicopters. News and events in aviation worldwide. Civil, transportation, military helicopters and airplanes.

Everything about aircrafts and helicopters. News and events in aviation worldwide. Civil, transportation, military helicopters and airplanes.

Everything about aircrafts and helicopters. News and events in aviation worldwide. Civil, transportation, military helicopters and airplanes.


The baseline mission is 250 passengers over a 9000 km range. For the reference subsonic transport with a cruise Mach number of 0 8 Table 5 show s a cruise lift-to drag ratio of about 18. the same can be said for the specific fuel consumption of 0.61, The wing has a typical dimensions for a conventional transport. Also the weight fractions arc very much like those of todays aircraft
A reference Mach number of 1.6 is chosen so the design would to easily meet future ozone layer depletion regulations and sonic boom corridor limitations. Choosing a higher Mach number would also make range, payload and Mach number variations difficult due to the high number of active constraints. At Mach 1.6 the OFW is clearly superior to the SWB. Interestingly enough, the enuse lift-to-drag ratio of the OFW is close to that of the SWB. The optimizer chose to improve the lift-to-drag of the SWB up to the level of the OFW at the expense of the structure The other explanation is that the size of the OFW could be reduced by increasing the thickncss-to-chord ratio and that this outweighed the decrease in lift-to-drag The absolute drag the OFW’ is still 16 less than that of the SWB! The structure of the OFW is also 14 lighter than for the SWB. In the case of the OFW. the lift-to-drag ratios of around 10.5 during cruise were achieved without a large structural penalty because of span loading and the fact that the OFW wing is much thicker. The OFW has similar TOC’s as the subsonic transport. Though both configurations arc not constrained by sonic boom or ozone layer depletion, they are both constrained by takeoff and sideline noise. Because of its better takeofT lift-to-drag ratio and lower w ing loading the OFW’ cuts back the engine at takeoff to meet the noise requirement The SW’B uses most of the suppression that is allowed. The price for suppression seems to be less than the price for the extra installation drag of a higher bypass ratio. The OFW mean sonic boom overpressure is only half of that of the SW’B The OW’B is not discussed as a reference aircraft because of its poor performance.
Input requires more than 200 variables for a full definition of the aircraft. Roughly one third of
these variables are technology constants and are assumed to remain constant.
All designs were optimized with respect to the following 30 engine cycle, mission and
geometry variables:
• Maximum takeoff mass M
u>
• Powerplant Bypass ratio BPR. Maximum turbine entry temperature SLS T 4 ^ The corresponding total pressure ratio e. Combustor temperature cutback dunng takeoff u. Combustor temperature cutback at takeoff noise control point and start climb bj4xb The thrust
margin variable allows the engines to be oversized with respect to stan cruise. Noise suppression can be installed to achieve FAR 36.
• Mission. The flight profile is shown in Figure 100. Thrust, sweep, altitude and Mach number can be set at takeoff, takeoff thrust-cutback, midpoint climb, stan cruise and end cruise, as well as at holding and diversion. The landing and approach arc executed at maximum landing weight. For a specific mission segment definition point cither the Mach number or the altitude was fixed during the optimization. The variable mission thrust settings make it possible to meet the noise regulations with thrust • cutback. Since the design loads are calculated based on the prescribed mission it is possible to minimize the aircraft loads in conjunction with the geometry. The lift-off speed is not less than 1.2 limes the minimum control speed. In particular, the delta-wing configurations tend to take off at lift-off speeds greater than this value because of high take-off drag.
• Dimensions. Wing Area S. Wing Aspect ratio AR is only a design variable for wing-body configurations. For flying wings, the aspect ratio is determined by the wing area S and the wing thickness-to-chord ratio and the heuristic design rule that the payload should fit inside the structure without excess (vertical) space. Fuselage length is only a design variable for wing-body configurations. The configuration fineness ratio determines the fuselage diameter of SWB’s wings and the maximum absolute thickness of OFW’s. Wing Root thickness-lo – chord ratio r/c ^^ is an important variable to trade off wave drag against w ing weight. In the
case of the OFW the thickness always converged to values around 19 ^ This high value can probably only be achieved by employing boundar) layer control devices.
• Sweeps schedule. Cruise sweep Л f This is the same as the sweep for fixed sweep configurations. Climb sweep Л. . and take-off sweep Л are only of significance for variable
iiihw hi
sweep configurations. The sweep of the OFW is limited to 70° to avoid How separation.
• Пар schedule. Lilt increments due to Пар deflection at takeoff and landing. ЛС; r, and
AC. л і-
LJIapJ
• Component locations. Spanw ise location of two powerplants on half w mg: ^ and pr(lfty
Spanwise location of two fuel tanks on half wing: У{аяк1 and У1апГ and the spanwisc widths
of the tanks. The spanwisc location of the main gear leg[9] The x-location of the centroids
of these items is determined by balance considerations For flying wings the relative component location did turn out to be an important design variable to achieve the benefits of span loading.
Each of these variables are constrained to the domain of their validity. In addition a large number of constraints have to be satisfied.
• Geometry. The powerplants (4), gear legs (3) and fuel tanks (2) arc constrained to not interfere with each other’s location. The powerplants are placed outside the direct vicinity of the passenger cabin to protect passengers from engine explosion debris The gear track was limited to 35 m to enable operation from runways that arc at least 150 feet wide. The volume of the fuel tanks was sufficient to accommodate all the required fuel as well as a fuel volume
equivalent to half the pay load The mean trailing edge swccpback angle was limited to 30° for arrow wings due to the expected aero-elastic and control problems of more highly swept symmetric thin wings [356]. The maximum aircraft width and length is constrained to the current large aircraft gates at Frankfurt airport. This leads to a maximum structural span of about 120 m for OFW’s.
• Performance. The range was constrained lo a value not smaller than the design range. The takeoff field length and landing field length was constrained to 3300 ni (11000ft) to allow operations from most international runways. The one-cnginc out screen height climb requirement was set in accordance with the FAR25 regulations A minimum all engine climb gradient of 4% must be maintained at the takeoff FAR-36 cutback thrust level. The approach angle
.O
is 4 .
The width of the sonic boom carpet increases with Mach number, and therefore it will be much easier to use sonic boom corridors at the lower Mach numbers. Such a trip could involve going from Munich across the Adriatic sea (Ml.6 supersonic) to the Sinai Peninsula (M 1.15 boomlcss) through the red sea (M1.6) to India. At this time there are no models available to accurately predict the effects of aircraft effluents on the ozone layer.
2 % cruisefuel manoeuver
17.4 The Space of Optimized SCT’s
In this section we will compare optimized configurations. The companions arc made for designs
with fixed mission parameters, such as constant range, payload, and Mach number.
All aircraft arc evaluated with the same analysis routines. All aircraft arc designed with the same level of structural, aerodynamic and propulsion technology. This level is based on that achieved by a supersonic transports that can be produced in 2005. The most important pans are:
Aerodynamics
Skin friction is based on fully turbulent How w ith characteristic sand grain roughness. It is not likely that laminar flow can bring a real advantage to the SCT before 2005 Unresolved issues are the absence of experimental facilities, the high-Re numbers, the wave drag penalty incurred due to the required low-cross flow pressure distributions and the weight – and space penalty due to the suction equipment. Тік – inviscid flow drag is based on the theoretical minimum potential drag for a given distribution of lift and volume. This drag is then corrected based on the actual achieved drag levels in the detailed design This correction factor therefore reflects the potential drag improvement that is still achievable. Factors of 1.1 • 1.2 for the volume dependent wave drag and the the litt dependent wave drag arc typical for a high performance design (371) describes the 1992 status of the aerodynamic global model and its corresponding intermediate model applied to the design of an ofw. Ref. (373) also show s an example of its application to an arrow wing aircraft.
Structures
Structural calculations are based on a mix of composite materials and metallic alloys. DA experience shows that intermediate carbon fibers with BMI resins achieve strain levels in excess of 0.5 % resulting in weight savings over conventional primary structures in excess of 25 Я-. The airframe life was specified to be over 75.000 hours with 50,000 supersonic flying hours and 25,000 pressure cycles. A minimum skin thickness of 2 mm was specified to minimize foreign object damage. An overview of SCT structures and materials technology can be found in Erman – ni’s publication 1361]. Weight is calculated with shell-theory [371] describes the 1992 status of the structural model. Reference (359] presents the intermediate model applied to the design of an arrow wing fuselage.
Propulsion
A turbofan engine with mixing and a variable throat area was used. Polytropic component efficiencies arc typical of a future generation: between 90 and 935& for the compressor, fan and turbine. The maximum turbine entry’ temperature was limited to 1800 К and the maximum pressure ratio to 50. iNoisc suppression of up to 14 dB is allow ed, but a penalty in thrust and weight is paid.
Economy – Objective Function
Since aircraft cost is used to compare the various configurations, the cost model is one of the most important. The DA economic model represents the cost structure of a curopcan airline. The objective function ihat is used throughout this study is total operating cost relative to a subsonic reference. In some cases this operating cost was corrected for the expected increase in ticket pnee to account for the block lime savings. The influence of the cost of development on sales price is included. Therefore, this study compares the relative operating cost of various aircraft for the same mission, permitting comparisons of one concept with respect to the other.
The influence on the right objective function selection on the relative “goodness" of an aircraft is clearly demonstrated by Table 3. Assume a fully loaded 250 passenger aircraft designed for a range of 9000 km with cost calculated for a reference range of 6000 km. W’e consider five types of aircraft 3 symmetric wing bodies designed for Mach 2. (a). 1.6 (b)and 0.85 (c) respectively and an oblique flying wing designed for Mach 2.0 (d) and 1.6 (e) and an oblique wing body designed for Mach 1.6 <f) Based on DOC and M. aircraft c (subsonic) is the best
to
followed by e. d. b. a and f. Including ІОСЧ and the expected increase of revenue the Oblique Flying Wings d. c are the best followed by a. b. c and f. This comparison clearly shows the necessity to agree on a common objective function.
|
Type |
DOC |
TOC |
TOC-Д Rev |
|
|
a: M 2 0 SWB |
286 |
366 |
622 |
4.72 |
|
b: M 1 6 SWB |
266 |
3.46 |
6.03 |
4.74 |
|
с: M 0.8 SWB |
139 |
2.54 |
5.19 |
5.03 |
|
d: M 2.0 OFW |
251 |
3.28 |
5.79 |
4.28 |
|
с: M 1.6 OFW |
238 |
3.17 |
5.71 |
4 41 |
|
f: M 1.6 OWB |
323 |
4.14 |
6.79 |
5.50 |
|
Table 3 Effect of objective on goodness |
Technology Standard
Supersonic aircraft are assumed to have some technologies that are not required for subsonic aircraft:
• Flutter mode control load alleviation, which would allow increased sweep with thin wings.
• Active stability and control for all supersonic aircraft. Both the symmetric and asymmetric configuration have similar stability margins and have their neutral point at the MZFW center of gravity location.
• Powcrplant variable geometry inlet and nozzle design.
• Improved navigational and environmental control systems.
To obtain a good impression about the impact of the sons of technologies proposed for the supersonic transport they were applied to a A340 design. We took the A340 specification and optiniiz. cd the configuration with the same models, requirements, technology factors and constraints as applied to the 2005 supersonic transport. Table 4 shows the results of this study. The first column shows the actual A340 data. Ref (371) is a single point optimization of an aircraft with the A340 mission and technology[8]. These difference between the optimized and the datum A340 are well outside the spectrum of the accuracy of the global method. Ref. [373] is the same specification with the 2005 supersonic technology. The dropped by 31 In the
last column the cabin standard and the range arc reduced to SCT specification. This SCT standard is 10 % first class (40" pitch). 30 % business (36" pitch) and the rest economy (32" pitch).
|
A340-date |
Ref. 1 |
Ref. 2 |
SCT |
|
|
L/D |
200 |
19.7 |
19.7 |
19.2 |
|
s. fx. |
0.59 |
0.58 |
0.58 |
0.58 |
|
DEM (t) |
127 |
125 |
80 |
71.9 |
|
271 |
275 |
189 |
155 |
|
|
Range (km) |
13900 |
15000 |
15000 |
11000 |
|
Cabin |
A340 |
A 340 |
A 340 |
SCT |
|
Structure |
Alu |
Alu |
CF |
CF |
|
Table 4 Technolog} Standard |
17.6.1 Introduction
To design a next generation of supersonic transport a global model was developed to investigate the performance potentials of a wide range of aircraft variants.
 |
Figure 99 MIDAS design concepts
a) A conventional wing-bodv configuration. This symmetric wing body <$WB) configuration is also the preferred configuration for military aircraft. In reference [367] Rcch and Leyman provide an excellent insight into the development of Concorde, the only operational supersonic transport of this type The SWB represents the conservative approach for a new sec
ond generation SST and all group-of-fivc (Boeing – MDD – NASA. DAS A – AS – BAet baseline configurations are of this type. The flying-wing as presented in Figure 99 is not a true new type since the passenger cabin is concentrated in the center of the planform and therefore not different from the conventional configuration. For these configurations the horizontal tail or canard only serves as a control surface. The horizontal tail docs not contribute to the stability because of the high downwash ratio behind the low aspect ratio wing.
b) Asymmetric (oblique) wing body configuration. First proposed in 1912 by H. dc Marcay and B. Moonen. this novel concept was later successfully developed by R T Jones at NASA Ames Research Center dunng 70’s. A large volume of work is available on oblique wing-bodies, notably references (362) (365)(358). Recently, Elliot, Hoskins and Miller at General Electric Company (360) called for a revival of the the oblique wing program because of us larger performance margins and its low environmental impact. This concept has also an appealing passenger cabin layout.
c) Asymmetric flying wing or Oblique Flying Wing OFW. First proposed by R. T. Jones (363) of NASA Ames, the OFW was described in detail in previous references by the first author (371JJ368) (369)(370) and by Waters. Ardema and Kroo (375). Ihe OFW offers a possible solution to the economic and environmental problems associated with supersonic flight due to a combination of good aerodynamic and structural characteristics. Seat modifications may be necessary to cope with a future modification of FAR 25 for an OFW w ith a spanwisc oriented cabin. Such a cabin is desired to take advantage of span loading. A proof of concept test (light was made with an unstable OFW at NASA Ames on May 10. 1994. by S. Moms and B. Tigner.
For successful optimization of a parameter space we have to make the objective function topography suitable for this purpose. This process is described in reference (372j. In this study we used a derivative version of the Genie optimization software (364). In addition to general engineering optimization issues, the present method adds the following issues to the development of a global model as presented in this paper:
• Coordination of input and output. This requirement forces the development to be coordinated by only a few people and therefore presents the most significant “bottleneck" for industrial application Currently we have one input coordinator for each geographic location. Changes to the model arc only made based on consensus between these representatives.
• What to model? In principle we are always modelling cost and benefit. Clear paths should be established between the major design parameters and the cost equations The benefits of a noise suppressor are easily defined, the number of dB suppressed at a reference condition can simply be used as an input parameter But at what cost? Here is where the specialist is invaluable. He will calculate how much benefit to the aircraft he can guarantee as a function of various physical quantities (jet exhaust velocity…) for what cost (thrust-loss and suppressor complexity..). An accurate prediction of these relations is of course to his professional advantage since that will indirectly determine his task in the intermediate detailed design
• Generality versus accuracy. Computers arc bad with rules of thumb since they do not know what is behind them, but they arc alsu fast and can solve the general equations upon which ihc rules of thumb arc based. So therefore it is helpful to base the model on physical realities, and not to fudge it to fit one existing data set.
• Consistency. It is desirable to use one model to determine one parameter. If this is not possible make sure that each equation representing the same parameter contains the identical set of variables and that the value and the derivatives at the cross-over points are continuous if possible.
The present method has a number of advantages over more traditional design methods.
This nietlwd.
• clarifies the goals of a design project and provide a means of communication between the disciplines. Most of the time it is not very clear what the objective of an aircraft design is By – agreeing on an objective function (for instance TOC) and a number of constraints it is possible to settle interdisciplinary differences.
• automatically debugs the analysis routines. Small model inconsistencies are usually not noticed by the expert user because he only trusts his model in a limited range. The optimizer will exploit any weakness in the model and therefore make it more visible.
• cleanly compares between competing configurations. To compare aircraft they have to be analyzed with the same technologies and missions. In addition they have to be preferably analyzed w ith the same set of equations
• reduces the number of detail-design cycles. As the experiences at DA have shown, a good baseline design will cut the number of follow – on detail cycles, thus significantly reducing the total required time. •
sign space of best configurations. Active and nearly active constraints can be monitored to indicate important performance criteria or important technologies.
• allows the progress that is made in the analysis routines to be directly translated into an improved design. This provides a great deal of motivation to the individual who makes a contribution to an improvement in the model.
Some of the advantages of the current system are also described in a paper by Reimcrs
1366].
How doc we best achieve flexibility and efficiency in our design process while effectively using the talent available to the organization? Figure % shows our solution called Multi-Disciplinary Integration of Deutsche Airbus Specialists.
On the highest level there exists a global model of aircraft performance and economy as a function of its specification and a set of design variables. The analysis routines in the global model are supplied by the departments who have final responsibility. In about an hour numerical optimization of these design variables will prov ide an estimate of the aircraft’s main characteristics and geometric dimensions.
specifi
Abstraction
principal paramete S. AR. M, CL
model maintenance
interaction
detail
experiment
Global Model
 |
Figure 97 Global optimization
Alter the optimized design is finished it is critically evaluated by the specialists. Once the decision is made to develop a design further, the departments verify the pertinent results of the global optimization in greater detail This verification includes the design of a more detailed geometry on the basis of the global optimization output, much like putting the flesh on a skeleton. The values predicted by this intermediate model are compared to those for the global model and if necessary the global model is corrected and the process is repeated. Typically, no more than two iterations are required. In some cases the intermediate design level is also automated resulting in a closed global-intermediate loop In this case only computational limitations prevent further integration. Note, that at the intermediate design level, within each department a new group of parameters must be optimized which justify the simplifying assumptions made at the global level. For instance in the global aerodynamic model, the xssumption is made that there exists a wing camber distribution that has near minimum potential drag for a given plan – form. The wing planfonn is optimized during the global optimization cycle. At the intermediate level, the camber (represented by shape functions) is then optimized to achieve minimum lift dependent wave drag for this planform and lift. Finally the resultant ratios of the achieved minimum lift dependent wave drag to the global theoretical minimum is used as a correction factor in the next global optimization. Figure 98 shows the convergence history of the intermediate aerodynamic optimization for several optimizers.
Figure 98 Intermediate aerodynamic optimization
If this ratio exceeds an allowed percentage, the model itself should be corrected The intermediate model should not introduce parameters that conflict with the global model variables. A detailed description of the intermediate model can be found in references (37|) and I373).
To date we have used this method to obtain a number of SCT configurations. The configurations presented here have many of the features of these proprietary designs, but do not present the actual configurations.
We will first discuss a design strategy which finds the optimum aircraft design in the analysis parameter space for a given mission. This parameter space is determined by the various disciplinary groups. The individual disciplines supply robust and physically correct modular analysis methods and the enabling technologies. Non-linear optimization techniques arc then used to find the best design using these modules in this parameter space This strategy reduces the number of design cycles and allows us to evaluate more configurations.
This strategy is applied to the design of supersonic transports. The main assumptions of the analysis routines will be described as well as the objective function. Several near-term technology supersonic configurations w ill be compared as a function of their mission specifications.
A. Van dcr Velde*
Synaps Inc., Atlanta, GA, USA
17.1 Abstract
The challenge in the development of a very complex system like a supersonic transport is ти only to achieve the required technology, but also to link a team of highly skilled experts. In this paper a successful industrial approach is described to integrate the individual departments with their specific knowledge into the design of a future supersonic commercial transport.
Different designs arc analyzed with a modular synthesis model and compared on the basis of operating economy w ith specified performance and environmental impact. The analysis routines of the synthesis model are mainly configuration independent and represent fixed levels of structural, aerodynamic and propulsion technology. The specialist departments are responsible for the content of the routines, and later verify the design with more refined methods. At present more than two hundred variables describe the aircraft geometry, engine characteristics and mission Thirty of those variables representing the aircraft and its flight-profile are optimized simultaneously as a function of Mach number, payload and range Because the various designs arc analyzed with the same routines and optimization procedures they can be easily compared. This aircraft pre-optimization results in a significant reduction of the number of follow-on detail-design cycles, especially for non-convcntional designs
Examples are given for the preliminary design of arrow-wing and oblique wing supersonic aircraft as compared to subsonic aircraft using the same technology. It is also shown how technology and environmental constraints influence the sized design
17.2 List of Principal Symbols

![]() engine bypass ratio Lift coefficient
engine bypass ratio Lift coefficient
design empty mass altitude
Indirect Operating Costs Mach number maximum takeoff weight
length
lift-to-drag ratio
oblique flying wing
oblique w ing body
reference wing area
Supersonic Civil Transport
specific fuel consumption (N’/hr/N)
sea level static
symmetric wing body
thickness to chord ratio
total operating cost per seat km
maximum turbine entry temperature
minimum control speed
width
Greek Letters:
maximum engine pressure ratio
sweep angle ozone depletion
sonic boom sea-level overpressure
17.3 Introduction
In the early days of aviation, the technology to design aircraft was relatively simple and the requirements on product safety minima). As a consequence, aircraft could be designed by small groups of people. Such small groups can communicate directly and therefore work very efficiently. For instance – In 1936 it look Kurt Tank exactly one year to conceive and produce the Focke Wulf Condor, the first transatlantic airliner. However as the technology became more complex, aircraft designers had to specialize to cope w ith the increased flow of information In addition, the growing market required improved safety and accurate performance guarantees. Such performance and safety guarantees could only be made by extensive analysis and testing of the aircraft design. Due to this increased work-load an aircraft is no longer designed by a single group, but by hundreds of specialists in many departments. This subdivision of work further increased productivity and enabled the development of the complicated but safe transport aircraft we have today.
Although the specialists can fit the aircraft with the best technology available in their field, it is unclear whether this will always lead to the best aircraft The best aircraft can only be designed with a truly interdisciplinary effort. The number of people and independent locations increases the design cycle time and decreases the amount of interaction between the disciplinary groups. Progress is thereby limited to incremental improvements making it difficult to achieve the breakthroughs in aircraft design still common thirty years ago. This paper will present a solution to this problem that was based on the author’s thesis at Stanford University (371 j.
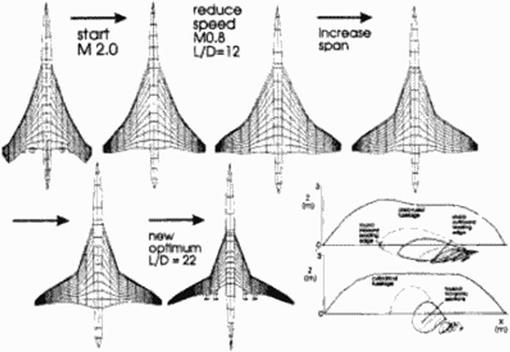
To illustrate the working of the optimizer we decided to change the Mach number from M 2.0 to 0.8 and make the wing span a design variable. In addition the length of the nacelles was halved to simulate a current high bypass ratio turbofan. We took the supersonic aircraft of the previous section and analyzed it at the subsonic speed of Mach 0 8. Though its lift-to-drag ratio improved to 12 because of the absence of wave drag, this was clearly not an optimal configuration at this flight condition. Figure 95 shows what happened Immediately after the start of the optimization, the span is increased to the maximum allowable span of 60 m ю reduce induced drag. Ncxi the wing area is reduced to reduce friction drag After about 12 hours, the configuration had converged K> the last shape shown which had a lift-to-drag ratio of 22, slightly belter than current transonic aircraft. The fact that the aircraft looks a bit like a VariEzc probably stems from the fact that the landing gear is still stored in the w ing and the aircraft has the cimc neutral point and pitching moment as the original BSCT. The outboard wing sweep looks fairly realistic. Local maximum wing normal Mach numbers are around 1.15. a very reasonable value for cruise flight, and perhaps a bit unexpected considering that we are running a panel code. Limitations to the leading edge suction and pressure levels as implemented in the potential flow code could he responsible for this phenomena Area ruling is taken out and the minimum fuselage dimensions arc selected Notable is also the automatic rcpanncling of the wing-body interface with the wing root blended into the fuselage. If we look at the section design, we notice that wing looks like a transonic aircraft design: wash out twist, large leading edge radius, and rear loading.
|
Figure 95 ESCT morphed into a VariEze type subsonic transport |
Since shocks are not modeled here, and since the design constraints arc not typical for a subsonic transport, one should not attach to much meaning to this morphed ESCT design. However. the results clearly show the flexibility of this method.
16.6 Conclusion
In this paper we present a general method for aerodynamic shape design, based on direct numerical optimization of aero-shape functions. The method was applied to the design of a 3D supersonic wing body configuration. This method is computationally efficient and competitive with designs obtained using current industnal methods, resulting in overall organizational time savings of approximately a factor of three and producing designs of comparable to better quality than those produced by inverse methods.
Acknowledgements
I would like to thank Ralph Carmichael of NASA Ames for his earlier help with the w mgbody code, and my colleagues at Stanford University: Prof. Han Kroo. Peter Gage and Scan Wakayama, who helped me with my initial attempts to use optimization Much of this work would not have been possible without the programming assistance of Siikc Logcmann. I would also like to thank Dr. M. Yoda for her editing of this paper Finally, I would like to thank Dr. Mertens of Daimler Benz Aerospace Airbus for his organizational and personal support.
The basis for the comparison was the already (fairly) optimal 1995 European Supersonic Transport Design. The goal of the optimization was to improve the cruise lift-to-drag ratio of the design by at least 5 % without penalizing the structural weight significantly and keeping the basic layout in terms of minimum dimensions. The engine nacelle was configured for cruise and not modified. The span was kept constant. The canard was considered to be not lifting at supersonic flight and was taken into account by a small drag increment.
The design variables were:
1. Angle of attack a, and twist angles expressed as a Taylor polynominal a (iCiy+cjy^+cj^+Cjy4). The root incidence was kept constant.
2. Wing location (x) at 33 52 <k, 86 of the semi-span and the tip.
3. Wing chonl(y) at 33 9b, 52 9t 86 of the semi-span and the tip. The root chord was kept constant.
4. Wing shape functions Y( (Cg4c/ у-fc^y*+cj у4)
5. 19 Fuselage cross-sections as a function of x.
The following constraints were used:
1. Cruise lift coefficient C{ <0.125.
2. Cruise pitching moment C *0 around reference point.
3. Same neutral point location as the reference configuration.
4. Cruise floor angle < 4.5°
5 23 Minimum dimensions for cockpit and the landing gear bay. and also a cabin external diameter of 4.0 m ,
6. For landing: 5 ° Bank, 12 ° pitch sufficient clearance for wing and nacelle with a gear not higher than 5.5 m..
7. Acceptable wing-body fairing by constraining root incidence, camber and thickness distribution.
8. At least the ESCT-basclinc local wing stiffness
9. 6 Minimum spar depths for the wing to assure landing gear storage, fuel volume
The coniiguiation was optimized for two operating points at Mach 2.0. Since the wing span and area were not affected it was not expected that the subsonic efficiency of the configuration would be changed after optimal flap scheduling was implemented.
The time required to reach a fully converged design was about three hours on а НР935/ lOOMhz. The original design goal was almost met. but with significant changes to the geometry. A free optimization would have achieved a greater reduction
Figure 94 shows the optimized ESCT-6 as a coarse panel geometry. The optimizer swept the outboard panels more, but to keep the same stiffness as the reference ESCT. the thickness had to be increased. The optimizer also runs against the w ing tip clearance constraint using the maximum allowable gear height. A solution was found by using forward sweep near the lip. This allowed the wing to be banked and pitched without sinking the runway. As the eight wing section cuts show-, the wing shape gradually changes from a rounded leading edge at the root to a sharp supersonic leading edge near the tip The fuselage is significantly widened in the front. Although these changes were quite radical, the goal of 5Я drag reduction was barely achieved, and it remains to be seen whether this new geometry has any other problems associated with it. In the optimization и turned out that the outboard wing sweep was the principle driving force in reducing the w ing drag