Category A PRACTICAL. APPROACH TO. ROBUSTNESS. ANALYSIS

AN EXTENSION

Parametric uncertainties are introduced in the closed loop system of Figure 12.1: the transfer function G(s, S) now depends on LTI uncertain parameters Si. For the sake of convenience, the vector 6 of parametric uncertainties is assumed to belong to the unit hypercube D:

AN EXTENSION

The necessary condition for the existence of a limit-cycle becomes:

AN EXTENSION

Defining the generalized value set G(ju) in the complex plane as:

AN EXTENSION

and assuming as in the previous subsection that N(X, w) = N(X), the issue is to find the intersection (s) of the generalized value set G(jw) with the plot of 1 N(X) in the complex plane.

The problem is thus to build the generalized value set G(ju>) as a function of из. This is not an easy problem, which is only solved for special structures of parametric uncertainties. This is especially the case of interval plants:

AN EXTENSION

where uncertain coefficients ai and bj belong to intervals. See e. g. (Kheel and Bhattacharyya, 1994) and included references.

2. A GRAPHICAL METHOD

The case of a single SISO nonlinearity is considered. In the first sub­section, a classical graphical method for detecting limit-cycles (without parametric uncertainties) is recalled. Subsection 2.2 then proposes an 1The interest of using linear tools (namely Hx control, ц analysis and ц synthesis) in a nonlinear control problem was already emphasized by (Katebi and Zhang, 1995) in a different context.

extension of this method, for detecting limit-cycles in the presence of parametric uncertainties.

2.1 A CLASSICAL METHOD

2. A GRAPHICAL METHOD

Let the closed loop system of Figure 12.1, where Ф represents a SISO nonlinearity and G(s) a transfer function. Assume that y(t) = Xsin(u}t), where X is a positive real scalar. The output of the nonlinearity, which is supposed to have odd symmetry, can be written as:

u(t) — Rsin(ujt) + Scos(u>t) + e(t) (12.1)

where e contains the super harmonic part of signal u. R and S can be computed as:

2. A GRAPHICAL METHOD

The SIDF is introduced as:

N(X, u>) = £±^- (12.3)

It is assumed in this section that the signal e ( Є ) is essentially filtered by the low-pass transfer function G(s) (first harmonic approximation), so that a necessary condition of oscillation of the closed loop is:

2. A GRAPHICAL METHOD

Remark: as a first point, the above equation represents a necessary condition for the existence of a limit-cycle, if the first harmonic approx­imation is valid. As a second point, when considering a magnitude X0 and a frequency u>o satisfying equation (12.4), the corresponding limit – cycle can be stable or unstable.

2. A GRAPHICAL METHOD

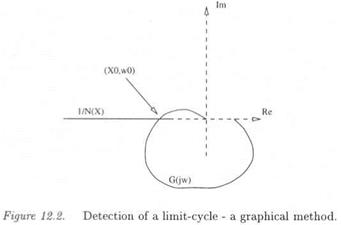
In practice, N(X, u>) generally does not depend on ш, so that equation (12.4) can be solved by looking for the intersection(s) of the plots of G(ju)) and 1/N(X) in the complex plane (see Figure 12.2).

NONLINEAR ANALYSIS IN THE PRESENCE OF PARAMETRIC UNCERTAINTIES

The aim of this chapter is to study the existence of limit-cycles in a closed loop, which simultaneously contains nonlinearities and parametric uncertainties (Ferreres and Fromion, 1998). Three methods are presen­ted. First, the issue of detecting a limit-cycle with a necessary condition of oscillation is considered: a graphical method and a /r based method are proposed. A second ц based method is then proposed, which uses a sufficient condition of non oscillation, i. e. the issue is now to check the absence of limit-cycles despite parametric uncertainties. An example is finally presented: the necessary condition of oscillation is used to syn­thesize a controller which modifies the characteristics (magnitude and frequency) of the limit-cycle.

1. INTRODUCTION

The analysis of nonlinear control systems remains a challenging prob­lem, despite numerous years of extensive research. As the starting point of this chapter, a classical problem is considered, namely a closed loop system which simultaneously contains an LTI transfer function and a separable autonomous nonlinear element:

■ If no a priori knowledge of the nonlinearity is available, this one is simply assumed to belong to a sector. Closed loop stability is checked with the circle or Popov criteria (Desoer and Vidyasagar, 1975).

■ Conversely, if the characteristics of the nonlinear element are a priori known, a solution is to replace this element by its Sinusoidal Input Describing Function (SIDF): see e. g. (Gray and Nakhla, 1981; Katebi and Zhang, 1995; Khalil, 1992) and included references. The har­monic linearization method is then applied, either for detecting the

presence of limit-cycles in the closed loop (see e. g. (Chin and Fu, 1994; Anderson and Page, 1995) for realistic applications of this clas­sical nonlinear analysis method), or for checking their absence.

It would be interesting to extend the above classical problems to the case of a closed loop, which is also subject to LTI parametric uncertain­ties. This was partially done for the case of a sector-type non linearity: see e. g. (Chapellat et al., 1991; Gahinet et al., 1995). The aim of this chapter is to extend the classical harmonic linearization method to the case of parametric uncertainties. Existing results in robustness analysis (i. e. analysis of the robustness properties of an LTI closed loop system, subject to LTI model uncertainties) are used as the basis

Two different problems are considered. The first one is to detect a limit-cycle with a necessary condition of oscillation: a graphical method is first proposed, which can be considered as an extension of the clas­sical method (section 2.). A g, based method is then proposed in section 3.. As a second problem, the problem of checking the absence of limit – cycles despite parametric uncertainties is studied. An alternative ц based method is proposed, which uses a sufficient condition of non oscillation (section 4.). An example is presented in section 5.. Concluding remarks end the chapter.

Note that the starting point of this chapter is to remark that the necessary condition of oscillation leads to a problem of detecting the singularity of a matrix, which depends on the parametric uncertainties, whereas the sufficient condition of non oscillation leads to a problem of checking a small gain condition despite parametric uncertainties. On the other hand, the problem of checking the presence or the absence of limit-cycles in the face of parametric uncertainties has primarily an en­gineering interest. The main purpose of this chapter is consequently to show that this difficult nonlinear problem can be solved efficiently with the s. s.v. )JL. Because many д tools are already available, this chapter, in the same spirit as (Katebi and Zhang, 1995), has primarily a practical interest, beyond the necessary theoretical justifications.

APPLICATION TO THE MISSILE

As a preliminary, when analyzing the robustness of a control law in the presence of time delays, three frequency bands are classically to be distinguished, namely the low, medium and high frequency bands. In the low frequency band, even if the MIMO phase margin ДФ is not especially high, the associated MIMO delay margin Д r = Д Ф / r is generally high because of the low values of ui. In the high frequency band, the roll­off properties of the controller generally ensure an infinite delay margin. The lowest values of the MIMO delay margin are consequently obtained at medium frequencies.

Подпись: Figwe 11.10.Missile example with 3 delays and 4 parametric uncertainties – compai

ison of the conservatism of the small gain approach and of the approach of section 2

The issue in this section is to compute the robust delay margin in the presence of aerodynamic uncertainties in the 4 stability derivatives Za, Ma, Zv and Mr). 3 time delays are introduced at the missile input and at the 2 outputs. A frequency gridding is used, with 100 points between 0.01 rad/s and 200 rad/s. With the exception of the last two points (181 rad/s and 200 rad/s), a finite robust delay margin is obtained with the small gain approach and a direct or inverse model perturbation. Figure 11.9 shows the results obtained with the small gain approach and
with the approach of section 2.: in an obvious way, this approach gives better results than the small gain one.
Подпись: Figure 11.11. Подпись: Missile example with Подпись: delays and Подпись: parametric uncertainties - the

APPLICATION TO THE MISSILEMore precisely, let Лгі(ш) (resp. Дт2(ш)) the lower bound of the robust delay margin obtained with the small gain approach and a direct (resp. inverse) model perturbation. Let then Д д ( т ) the lower bound of the robust delay margin obtained with the approach of section 2.. On Figure 11.9, the solid line corresponds to Дтз(си) while the dashed line corresponds to max(Ari(o;)^T2(ta)).

solid (resp. dash-dotted) line represents the lower bound of the robust delay margin obtained with the small gain approach and a direct (resp. inverse) model perturbation – the frequency range on the x axis is 3.5 rad/s, 200 rad/s.

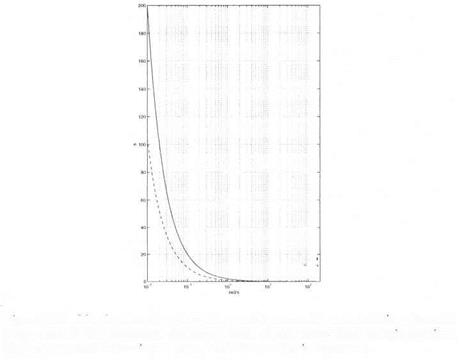
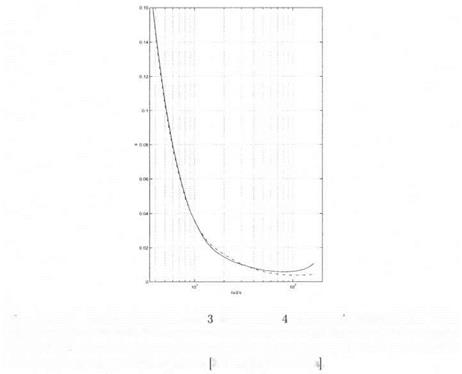
The reduced conservatism of the approach of section 2. can be further illustrated on Figure 11.10, which represents on a logarithmic scale

(solid line) and (dashed line): Д гзД ) , i. e. the margin provided by

the approach of section 2., is greater than the one provided by the small gain approach at all frequencies. Note moreover on Figure 11.10 that the result provided by the small gain approach and an inverse (resp. direct) model perturbation is indeed better at low (resp. high) frequencies.

The minimal value of Дг(ш) = тах(Ат(ш),Ат2(иі)) over the fre­
quency range is computed as 5.8 ms at з = 8 1.3 rad/s (lower bound of the robust delay margin obtained with the small gain approach – see Figure 11.11).

APPLICATION TO THE MISSILE

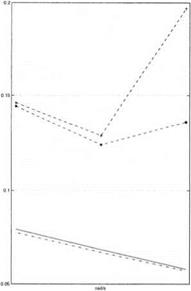
Figure 11.12. Missile example with 3 delays and 4 parametric uncertainties – the solid (resp. dash-dotted) line represents the lower bound of the robust delay margin obtained with the small gain approach and a direct (resp. inverse) model perturbation – the two dashed lines represent the lower and upper bounds of the robust delay margin obtained with the approach of section 2. – the frequency range on the x axis is [6 rad/s, 7.4 rad/s].

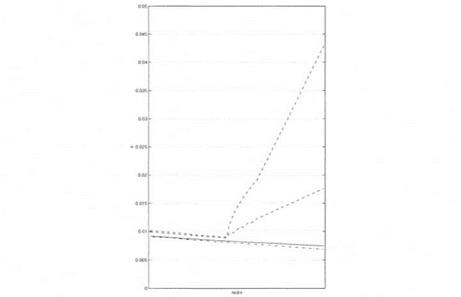
One then focuses on the results obtained with the approach of section 2.. The upper bound of the robust delay margin is infinite, except in two frequency intervals [6 rad/s, 7.4 rad/s] and [34.3 rad/s, 44.7 rad/s]. These two intervals are consequently emphasized in figures 11.12 and 11.13. Note the small gap between the lower and upper bounds of the ro­bust delay margin obtained with the approach of section 2., at least near the critical frequency. When computing the minimal value of these lower and upper bounds over the frequency range, an accurate estimate of the robust delay margin is obtained as [8.8 ms, 9.0 ms] at ш = 38.56 rad/s.

Note in Figure 11.13 that the result provided by the small gain ap­proach is nearly non conservative at the critical frequency u> = 38.56 rad/s However, the lower bound of the robust delay margin obtained with the small gain approach still decreases for ш > 38.56 rad/s, so that the min­imal value over the frequency range of the lower bound provided by the small gain approach is obtained at ui = 81.3 rad/s. Much better results are thus obtained with the approach of section 2..

APPLICATION TO THE MISSILE

Figure 11.13. Missile example with 3 delays and 4 parametric uncertainties – the solid (resp. dash-dotted) line represents the lower bound of the robust delay margin obtained with the small gain approach and a direct (resp. inverse) model perturbation – the two dashed lines represent the lower and upper bounds of the robust delay margin obtained with the approach of section 2. – the frequency range on the x axis is [34.3 rad/s, 44.7 rad/s|.

4. CONCLUSION

The approaches of sections 2. and 3. are compared:

■ At least in the missile example, better results are obtained with the approach of section 2.. This is logical, since a much finer description of the delay frequency response is used.

■ The small gain approach of section 3. only provides a lower bound of the robust delay margin, while the approach of section 2. provides an interval of this margin. A destabilizing value is moreover obtained for the mixed model perturbation and time delays. The interest of the method of section 2. is also to provide a measure of the conservatism of a lower bound of the robust delay margin.

■ Nevertheless, real (resp. complex) scalars represent the uncertainty in the delay frequency response in section 2. (resp. section 3.). The presence of complex scalars improve the regularity of the ц plot as a function of frequency ш. As a consequence, the peaks on the ц plot are more narrow with the approach of section 2., so that a finer frequency gridding is to be used.

The small gain approach of section 3. is easier to implement, since it essentially reduces to a skewed ц problem. The associated algorithm is polynomial time. Conversely, the approach of section 2. is possibly less easy to implement, but better results are expected and an interval of the robust delay margin is obtained instead of just a lower bound. Note that the algorithm in this book is exponential time, but that a polynomial time version could be derived (Ferreres et al., 1996b).

AN IMPROVED ALGORITHM

The issue is to compute the robust delay margin, i. e. the minimal value of the MIMO delay margin when Ді belongs to its unit ball. The following algorithm, which is to be applied at each frequency u>, will be used in the following section:

1. AN IMPROVED ALGORITHMComputation of an upper bound of typically the mixed

H upper bound of (Fan et al., 1991). If it is greater than 1, stop. It is indeed impossible to guarantee that the closed loop without time delays is stable when the classical model uncertainties in Д i belong to the unit ball.

2. Computation of a lower bound of the robust delay margin using the small gain approach of section 3. and a direct model perturbation. If an infinite margin is obtained, stop.

3. Computation of a lower bound of the robust delay margin using the small gain approach of section 3. and an inverse model perturbation. If an infinite margin is obtained, stop.

4. The method of section 2. is applied.

Remark: Steps 2 and 3 are performed before Step 4 because they are computationally less involving. Their purpose is to eliminate the fre­quency points, for which the margin is infinite.

Подпись: Figure 11.9.Missile example with 3 delays and 4 parametric uncertainties – the solid

(resp. dashed) line represents the lower bound of the robust delay margin obtained with the approach of section 2. (resp. with the small gain approach).

COMPUTATIONAL METHOD

The following Lemma is introduced as a preliminary. It can be proved in the same way as Lemma 2..1 of chapter 8.

LEMMA 3..1 Let M a complex matrix, Ді a mixed model perturbation which is to be maintained inside its unit ball, and Д2 a mixed model perturbation whose size is free. Then:

COMPUTATIONAL METHOD

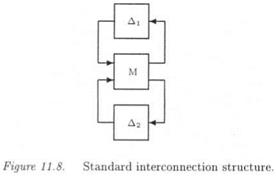
We now come back to the initial problem. Remember that Д 1 is a mixed model perturbation which gathers the parametric uncertainties and neg­lected dynamics, while Д2 = diag(8{,… ,6^) is a structured complex model perturbation corresponding to time delays. The associated inter­connection structure M – Д, with Д = diag(AьДг), is presented in Figure 11.8. Note that matrices M and Д are the values of the transfer matrices M(s) and Д(й) at s = ju. Frequency to is fixed in the following.

The idea is simply to use the first v upper bound of chapter 8 in order to compute a lower bound of the robust delay margin. A is to be main­tained inside its unit ball, while the size of Д2 is free. The difficulty is to prove that a lower bound of the robust delay margin is indeed obtained with this approach.

Let mi the dimension of Д*. In the same way as in chapter 8 (section L), scaling matrices D_{ associated to perturbations A{ are introduced (*.e DiAi = AiDi)- D and £>2 are then defined as:

COMPUTATIONAL METHOD

so that D = D + D2 is a scaling matrix associated to Д. a is an upper bound of і’д(М) if the following LMI is satisfied:

COMPUTATIONAL METHOD

When multiplying the above inequality on the left and on the right by:

COMPUTATIONAL METHOD

The above LMI becomes:

XMfDi + Di)MX – XDX + j(XGMX — XM’GX) < a2P2 (11.38)

Let:

Подпись:

Подпись: where:
Подпись: Omi 0 0 If7І2
Подпись: (11.39)

Di = XDiX M = X~lMX G = XGX

Equation (11.38) can be rewritten as:

M*{DX + P2)M – Di+ j(GM – M*G) < a2P2

The key point is to note that the above LMI implies that a is also an upper bound of і’д(М), with:

A = diag(A ЬД2) (11.42)

and A2 is a full complex block with the same dimensions as A2.

COMPUTATIONAL METHOD

As a consequence, using Lemma 3..1 and the fact that 2(H) = o(H) for any complex matrix H, it can be claimed that:

Noting that FU{M, A) = D^2Fu(M, Ai)D21^2, the above property is rewritten as:

(t(D2^2Fu(M, A)D2 l^2) < a (11.44)

Remember that FU{M, A{) is the transfer matrix seen by the complex structured perturbation A2, which models the time delays (see Fig­ure 11.8). Following subsections 3.1 and 3.2, the above equation means that the sufficient condition of robust stability, with respect to uncertain time delays, is satisfied for all Ai Є BA 1. a can thus be used in equa­tions (11.25) and (11.27) to compute lower bounds of the robust MIMO phase and delay margins.

INTRODUCTION OF MODEL UNCERTAINTIES

3.3.1 INTRODUCTION

INTRODUCTION OF MODEL UNCERTAINTIES

Consider the general case of a standard interconnection structure M(s) – A(s),with A(s) = diag(Ai (s), A2(s)): Ai(s)is a mixed model perturb­ation gathering all classical model uncertainties, whereas Дг(з) gathers all uncertain time delays (see equation (11.4)). As proved in the follow­ing, the issue of computing a lower bound of the robust delay margin essentially reduces to a skewed ц problem, in which the mixed model perturbation Ді is to be maintained inside its unit ball, while the size of the model perturbation Д2 is free.

The problem is however more complex than it may appear at a first glance: when the only uncertainties in the closed loop are the time delays, it was indeed remarked in the previous subsections that the small gain approach provides a conservative value of the MIMO delay margin, even if the exact value of the s. s.v. is computed. In other words, the small gain theorem, with or without scaling matrices, provides just a sufficient condition of stability. In the same way, even if the problem of computing a lower bound of the robust delay margin essentially reduces to a skewed H problem, this does not mean that the exact value of the robust delay margin would be obtained if the exact value of the skewed s. s.v. could be computed.

A STRUCTURED APPROACH

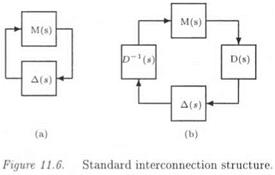
In the previous subsection, a specific structure was given to the model perturbation Д(а) only a posteriori, so that equations (11.25) and (11.27) are just sufficient conditions of stability of the closed loops of figures 11.5 and 11.6.a.

It is nevertheless possible to introduce scaling matrices in order to re­duce the conservatism of the approach. The model perturbation A(s) is diagonal (see equation (11.22)), so that diagonal scales D(s) = diag(di(s)) commute with the model perturbation, i. e.:

D{s)A{s)D~l{s) = A(s) (11.30)

These scales can thus be introduced in the closed loop of Figure 11.6.a without modifying its stability properties (see Figure 11.6.b). The small gain theorem gives a new sufficient condition of stability at frequency to:

Подпись: 1 a(to) Noting:

Подпись: (11.32)min <r(D(jto)M(jto)D 1(ju;))

D(ju)

less conservative values of the MIMO phase and delay margins can be computed with equations (11.25) and (11.27). The issue is to minimize at frequency to the quantity:

with respect to invertible and diagonal real and positive scaling matrices D(juj). This is the same problem as in subsection 2.2 of chapter 5 (com­putation of acomplex ц upper bound). (Sub)optimal solutions to this op­timization problem can be found in the ц Analysis and Synthesis Toolbox or in the Robust Control Toolbox (the routinepsv. m of this last Toolbox is especially efficient).

AN UNSTRUCTURED APPROACH

AN UNSTRUCTURED APPROACH

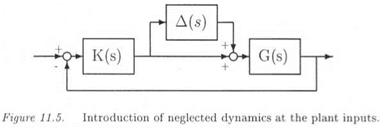
Let the closed loop of Figure 11.5, where K(s) and G(s) are the con­troller and the plant. A block of neglected dynamics A(s)is added at the plant inputs. This closed loop is first equivalently transformed into the standard interconnection structure M(s) – Д(в) of Figure П. б.а. M(s) is the transfer matrix seen by the model perturbation A(s) in Figure 11.5. A necessary and sufficient condition of stability is provided by the small gain theorem at frequency u:

AN UNSTRUCTURED APPROACH

It was assumed above that A(s) is an unstructured model perturbation. Nevertheless, a specific structure can be given a posteriori to Д(з):

I + Д(з) = diag(e ^’)

AN UNSTRUCTURED APPROACH Подпись: (11.22)

or:

AN UNSTRUCTURED APPROACH

The idea is thus to introduce phases фі in order to compute a MIMO phase margin with equation (11.20). When combining equations (11.20) and (11.22), one obtains:

AN UNSTRUCTURED APPROACH

Let:

A MIMO phase margin at frequency w is:

Подпись: (11.25) (11.26) (11.27) фі < 2 Arcsin(a{<jj)/2) Vi If the following structure is now given to Д(з):
I + Д(з) = diag{e~ns)

and using фі = шті, a MIMO delay margin at frequency ш is:

Подпись: i! <Подпись: ViArcsin(a(u>) / 2)

Remarks:

(i) ifa(cu) > 2, the MIMO phase margin is ± 180 degrees, and the MIMO delay margin is infinite.

(ii)

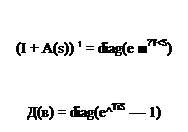
Подпись: i.e.: Подпись: (I + A(s)) 1 = diag(e ■?T<S) Д(в) = diag(e^TiS — 1) Подпись: (11.28)

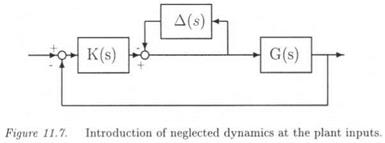
MIMO phase or delay margins can also be computed with an inverse model perturbation at the plant inputs (see Figure 11.7). In this case, the delays are to be introduced as:

Direct model perturbations rather account for high frequency model un­certainties, whereas inverse model perturbations rather represent low fre­quency model uncertainties (Doyle et al., 1982). As a consequence, bet­ter estimates of the delay margin can be expected with an inverse (resp. direct) model perturbation at low (resp. high) frequencies (see section

3.

AN UNSTRUCTURED APPROACH

).

AN ALTERNATIVE SMALL GAIN APPROACH

AN ALTERNATIVE SMALL GAIN APPROACH

A classical method is first presented for computing a MIMO phase or delay margin, in the case of a closed loop without any other model uncertainty than the uncertain time delays: a conservative value of the MIMO phase or delay margin is computed with the small gain theorem (first subsection), possibly with D scaling matrices (second subsection). The method is extended to the case of a closed loop subject to uncertain time delays and to classical model uncertainties (third subsection).